Cities with the Highest Percentage of Immigrants from South Central Asia in Minnesota
RELATED REPORTS & OPTIONS
South Central Asia
Minnesota
Compare Cities
Map of Cities with the Highest Percentage of Immigrants from South Central Asia in Minnesota
0.00%
6.00%
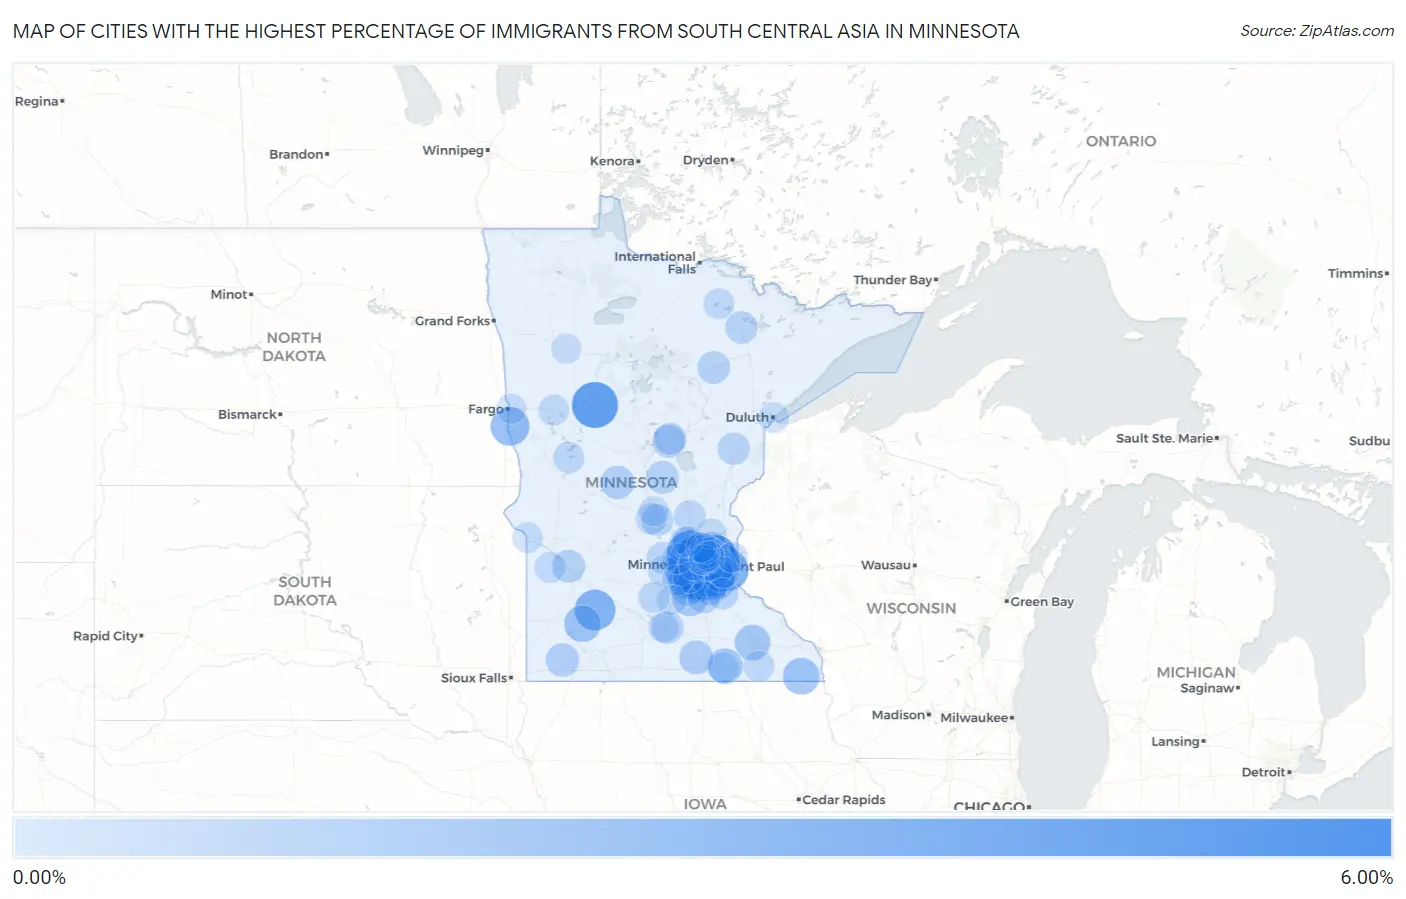
Cities with the Highest Percentage of Immigrants from South Central Asia in Minnesota
| City | South Central Asia | vs State | vs National | |
| 1. | Eden Prairie | 5.74% | 0.80%(+4.94)#1 | 1.31%(+4.43)#425 |
| 2. | Plymouth | 5.10% | 0.80%(+4.30)#2 | 1.31%(+3.79)#513 |
| 3. | Corcoran | 4.84% | 0.80%(+4.04)#3 | 1.31%(+3.53)#556 |
| 4. | Osage | 4.74% | 0.80%(+3.94)#4 | 1.31%(+3.43)#566 |
| 5. | Shoreview | 3.74% | 0.80%(+2.94)#5 | 1.31%(+2.43)#798 |
| 6. | Woodbury | 3.59% | 0.80%(+2.79)#6 | 1.31%(+2.28)#846 |
| 7. | Minnetonka | 3.49% | 0.80%(+2.69)#7 | 1.31%(+2.18)#871 |
| 8. | Medina | 3.42% | 0.80%(+2.63)#8 | 1.31%(+2.12)#896 |
| 9. | Golden Valley | 3.36% | 0.80%(+2.56)#9 | 1.31%(+2.05)#917 |
| 10. | Eagan | 3.27% | 0.80%(+2.47)#10 | 1.31%(+1.96)#950 |
| 11. | Little Canada | 3.22% | 0.80%(+2.42)#11 | 1.31%(+1.91)#972 |
| 12. | Wabasso | 3.22% | 0.80%(+2.42)#12 | 1.31%(+1.91)#974 |
| 13. | Hopkins | 3.19% | 0.80%(+2.40)#13 | 1.31%(+1.89)#987 |
| 14. | Falcon Heights | 2.77% | 0.80%(+1.97)#14 | 1.31%(+1.46)#1,158 |
| 15. | Victoria | 2.76% | 0.80%(+1.96)#15 | 1.31%(+1.45)#1,160 |
| 16. | Richfield | 2.70% | 0.80%(+1.90)#16 | 1.31%(+1.39)#1,190 |
| 17. | Comstock | 2.67% | 0.80%(+1.87)#17 | 1.31%(+1.36)#1,212 |
| 18. | Edina | 2.55% | 0.80%(+1.75)#18 | 1.31%(+1.24)#1,266 |
| 19. | Maple Grove | 2.55% | 0.80%(+1.75)#19 | 1.31%(+1.24)#1,267 |
| 20. | St Anthony City Hennepin And Ramsey Counties | 2.25% | 0.80%(+1.45)#20 | 1.31%(+0.942)#1,448 |
| 21. | Prior Lake | 2.13% | 0.80%(+1.33)#21 | 1.31%(+0.822)#1,538 |
| 22. | North Oaks | 2.08% | 0.80%(+1.28)#22 | 1.31%(+0.772)#1,575 |
| 23. | Spring Grove | 2.06% | 0.80%(+1.26)#23 | 1.31%(+0.749)#1,592 |
| 24. | Walnut Grove | 2.04% | 0.80%(+1.24)#24 | 1.31%(+0.736)#1,605 |
| 25. | Chanhassen | 1.95% | 0.80%(+1.15)#25 | 1.31%(+0.644)#1,682 |
| 26. | Roseville | 1.85% | 0.80%(+1.05)#26 | 1.31%(+0.539)#1,773 |
| 27. | Apple Valley | 1.80% | 0.80%(+1.000)#27 | 1.31%(+0.491)#1,819 |
| 28. | Rochester | 1.76% | 0.80%(+0.962)#28 | 1.31%(+0.453)#1,850 |
| 29. | Shakopee | 1.75% | 0.80%(+0.948)#29 | 1.31%(+0.439)#1,868 |
| 30. | Mapleview | 1.72% | 0.80%(+0.925)#30 | 1.31%(+0.416)#1,894 |
| 31. | North St Paul | 1.63% | 0.80%(+0.830)#31 | 1.31%(+0.320)#1,995 |
| 32. | Carver | 1.61% | 0.80%(+0.810)#32 | 1.31%(+0.301)#2,021 |
| 33. | New Prague | 1.61% | 0.80%(+0.807)#33 | 1.31%(+0.298)#2,030 |
| 34. | Lilydale | 1.58% | 0.80%(+0.778)#34 | 1.31%(+0.269)#2,068 |
| 35. | Bloomington | 1.42% | 0.80%(+0.617)#35 | 1.31%(+0.108)#2,275 |
| 36. | Blaine | 1.38% | 0.80%(+0.579)#36 | 1.31%(+0.070)#2,335 |
| 37. | Jordan | 1.31% | 0.80%(+0.510)#37 | 1.31%(+0.001)#2,415 |
| 38. | Hartland | 1.30% | 0.80%(+0.496)#38 | 1.31%(-0.013)#2,426 |
| 39. | New Brighton | 1.26% | 0.80%(+0.459)#39 | 1.31%(-0.051)#2,476 |
| 40. | St Louis Park | 1.20% | 0.80%(+0.403)#40 | 1.31%(-0.106)#2,558 |
| 41. | Burnsville | 1.20% | 0.80%(+0.401)#41 | 1.31%(-0.108)#2,563 |
| 42. | Long Prairie | 1.17% | 0.80%(+0.376)#42 | 1.31%(-0.134)#2,619 |
| 43. | Wilmont | 1.17% | 0.80%(+0.368)#43 | 1.31%(-0.141)#2,630 |
| 44. | Columbia Heights | 1.10% | 0.80%(+0.296)#44 | 1.31%(-0.213)#2,752 |
| 45. | Rosemount | 1.09% | 0.80%(+0.294)#45 | 1.31%(-0.215)#2,757 |
| 46. | Montevideo | 1.03% | 0.80%(+0.229)#46 | 1.31%(-0.280)#2,886 |
| 47. | Lakeville | 1.03% | 0.80%(+0.227)#47 | 1.31%(-0.283)#2,892 |
| 48. | Lastrup | 1.02% | 0.80%(+0.222)#48 | 1.31%(-0.288)#2,908 |
| 49. | Crosby | 0.99% | 0.80%(+0.194)#49 | 1.31%(-0.316)#2,963 |
| 50. | Mounds View | 0.95% | 0.80%(+0.148)#50 | 1.31%(-0.362)#3,051 |
| 51. | Nashwauk | 0.92% | 0.80%(+0.118)#51 | 1.31%(-0.391)#3,117 |
| 52. | Sturgeon Lake | 0.90% | 0.80%(+0.100)#52 | 1.31%(-0.409)#3,153 |
| 53. | Arden Hills | 0.90% | 0.80%(+0.099)#53 | 1.31%(-0.411)#3,157 |
| 54. | Cook | 0.87% | 0.80%(+0.073)#54 | 1.31%(-0.437)#3,213 |
| 55. | Mankato | 0.83% | 0.80%(+0.036)#55 | 1.31%(-0.473)#3,310 |
| 56. | Cuyuna | 0.81% | 0.80%(+0.011)#56 | 1.31%(-0.498)#3,362 |
| 57. | Maplewood | 0.80% | 0.80%(+0.005)#57 | 1.31%(-0.504)#3,375 |
| 58. | Hilltop | 0.80% | 0.80%(-0.003)#58 | 1.31%(-0.512)#3,396 |
| 59. | St Cloud | 0.75% | 0.80%(-0.053)#59 | 1.31%(-0.562)#3,536 |
| 60. | St Paul | 0.74% | 0.80%(-0.060)#60 | 1.31%(-0.569)#3,556 |
| 61. | Minneapolis | 0.73% | 0.80%(-0.064)#61 | 1.31%(-0.573)#3,572 |
| 62. | Elko New Market | 0.72% | 0.80%(-0.077)#62 | 1.31%(-0.586)#3,616 |
| 63. | Inver Grove Heights | 0.72% | 0.80%(-0.081)#63 | 1.31%(-0.590)#3,622 |
| 64. | Princeton | 0.69% | 0.80%(-0.105)#64 | 1.31%(-0.614)#3,700 |
| 65. | Hampton | 0.68% | 0.80%(-0.122)#65 | 1.31%(-0.631)#3,746 |
| 66. | St Bonifacius | 0.66% | 0.80%(-0.134)#66 | 1.31%(-0.643)#3,793 |
| 67. | Waite Park | 0.65% | 0.80%(-0.148)#67 | 1.31%(-0.657)#3,834 |
| 68. | Howard Lake | 0.59% | 0.80%(-0.205)#68 | 1.31%(-0.714)#4,017 |
| 69. | Spring Lake Park | 0.57% | 0.80%(-0.225)#69 | 1.31%(-0.734)#4,073 |
| 70. | Battle Lake | 0.54% | 0.80%(-0.261)#70 | 1.31%(-0.770)#4,198 |
| 71. | Newport | 0.53% | 0.80%(-0.270)#71 | 1.31%(-0.780)#4,227 |
| 72. | Gaylord | 0.53% | 0.80%(-0.271)#72 | 1.31%(-0.780)#4,228 |
| 73. | New Hope | 0.52% | 0.80%(-0.276)#73 | 1.31%(-0.785)#4,249 |
| 74. | Lester Prairie | 0.52% | 0.80%(-0.278)#74 | 1.31%(-0.787)#4,252 |
| 75. | Chaska | 0.52% | 0.80%(-0.280)#75 | 1.31%(-0.789)#4,268 |
| 76. | Dawson | 0.51% | 0.80%(-0.288)#76 | 1.31%(-0.797)#4,298 |
| 77. | Nett Lake | 0.49% | 0.80%(-0.306)#77 | 1.31%(-0.815)#4,368 |
| 78. | Austin | 0.49% | 0.80%(-0.310)#78 | 1.31%(-0.819)#4,380 |
| 79. | Audubon | 0.49% | 0.80%(-0.311)#79 | 1.31%(-0.820)#4,386 |
| 80. | Cologne | 0.48% | 0.80%(-0.320)#80 | 1.31%(-0.829)#4,418 |
| 81. | Spring Valley | 0.48% | 0.80%(-0.321)#81 | 1.31%(-0.830)#4,430 |
| 82. | Delano | 0.47% | 0.80%(-0.325)#82 | 1.31%(-0.834)#4,451 |
| 83. | Albertville | 0.47% | 0.80%(-0.330)#83 | 1.31%(-0.839)#4,469 |
| 84. | Wayzata | 0.44% | 0.80%(-0.364)#84 | 1.31%(-0.873)#4,631 |
| 85. | Stillwater | 0.41% | 0.80%(-0.390)#85 | 1.31%(-0.899)#4,730 |
| 86. | North Mankato | 0.41% | 0.80%(-0.392)#86 | 1.31%(-0.901)#4,739 |
| 87. | Brooklyn Park | 0.40% | 0.80%(-0.396)#87 | 1.31%(-0.905)#4,771 |
| 88. | Ortonville | 0.38% | 0.80%(-0.414)#88 | 1.31%(-0.924)#4,855 |
| 89. | Brooklyn Center | 0.37% | 0.80%(-0.424)#89 | 1.31%(-0.934)#4,893 |
| 90. | Coon Rapids | 0.36% | 0.80%(-0.437)#90 | 1.31%(-0.946)#4,947 |
| 91. | Otsego | 0.35% | 0.80%(-0.452)#91 | 1.31%(-0.961)#5,033 |
| 92. | East Bethel | 0.34% | 0.80%(-0.454)#92 | 1.31%(-0.964)#5,045 |
| 93. | Duluth | 0.34% | 0.80%(-0.458)#93 | 1.31%(-0.967)#5,068 |
| 94. | Robbinsdale | 0.33% | 0.80%(-0.467)#94 | 1.31%(-0.976)#5,120 |
| 95. | Fridley | 0.33% | 0.80%(-0.473)#95 | 1.31%(-0.982)#5,146 |
| 96. | Henderson | 0.31% | 0.80%(-0.485)#96 | 1.31%(-0.995)#5,214 |
| 97. | Fosston | 0.31% | 0.80%(-0.491)#97 | 1.31%(-1.00)#5,235 |
| 98. | Champlin | 0.30% | 0.80%(-0.499)#98 | 1.31%(-1.01)#5,284 |
| 99. | Moorhead | 0.29% | 0.80%(-0.504)#99 | 1.31%(-1.01)#5,304 |
| 100. | Sartell | 0.29% | 0.80%(-0.505)#100 | 1.31%(-1.01)#5,310 |
Common Questions
What are the Top 10 Cities with the Highest Percentage of Immigrants from South Central Asia in Minnesota?
Top 10 Cities with the Highest Percentage of Immigrants from South Central Asia in Minnesota are:
#1
5.74%
#2
5.10%
#3
4.84%
#4
4.74%
#5
3.74%
#6
3.59%
#7
3.49%
#8
3.42%
#9
3.36%
#10
3.27%
What city has the Highest Percentage of Immigrants from South Central Asia in Minnesota?
Eden Prairie has the Highest Percentage of Immigrants from South Central Asia in Minnesota with 5.74%.
What is the Percentage of Immigrants from South Central Asia in the State of Minnesota?
Percentage of Immigrants from South Central Asia in Minnesota is 0.80%.
What is the Percentage of Immigrants from South Central Asia in the United States?
Percentage of Immigrants from South Central Asia in the United States is 1.31%.