Cities with the Highest Percentage of Immigrants from South Central Asia in Indiana
RELATED REPORTS & OPTIONS
South Central Asia
Indiana
Compare Cities
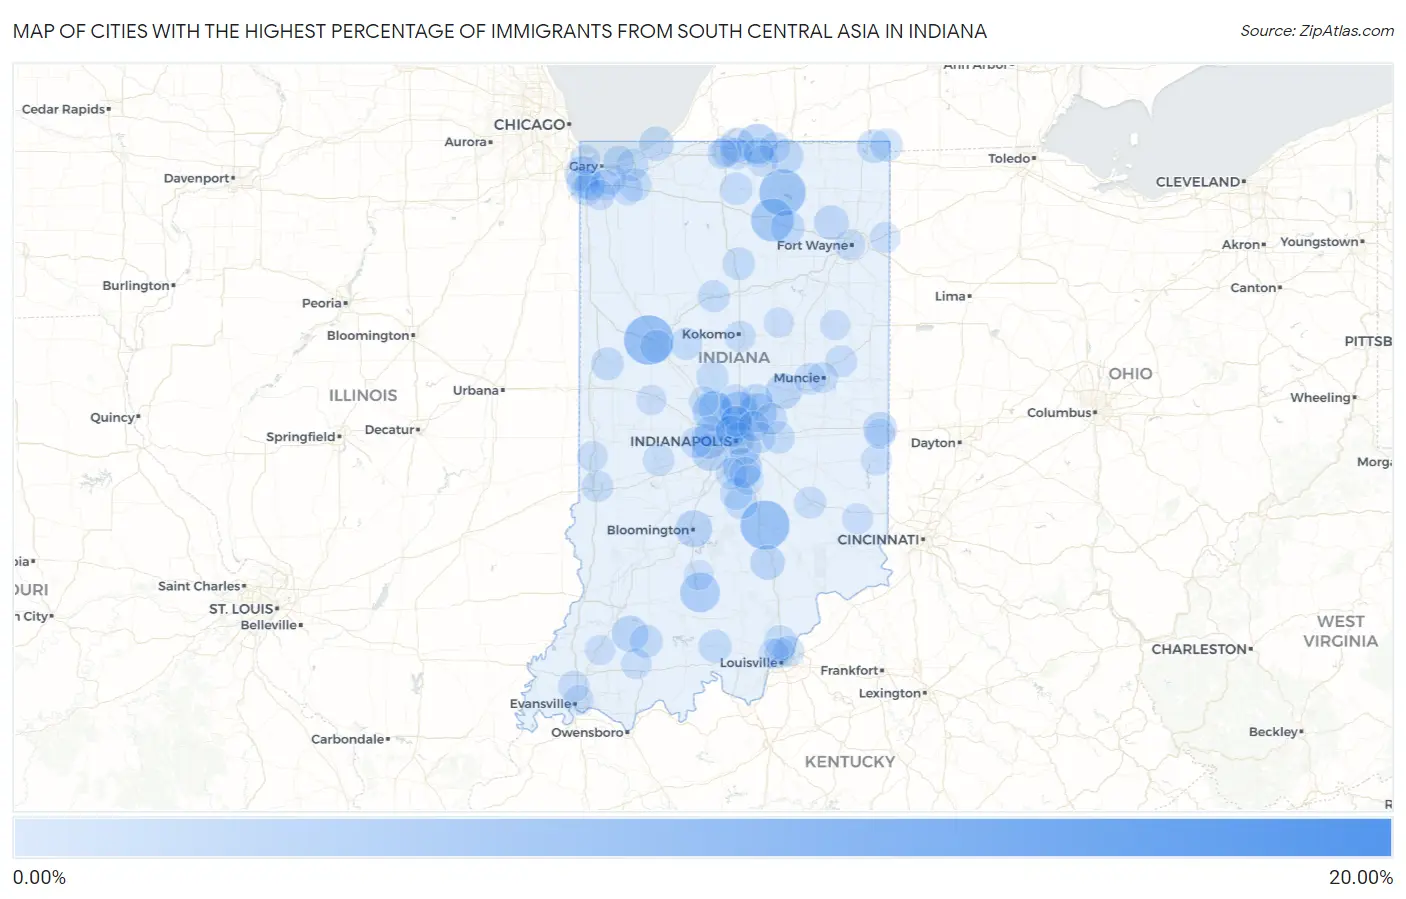
Map of Cities with the Highest Percentage of Immigrants from South Central Asia in Indiana
0.00%
20.00%
Cities with the Highest Percentage of Immigrants from South Central Asia in Indiana
| City | South Central Asia | vs State | vs National | |
| 1. | New Lisbon | 17.54% | 0.61%(+16.9)#1 | 1.31%(+16.2)#54 |
| 2. | West Lafayette | 6.67% | 0.61%(+6.06)#2 | 1.31%(+5.36)#328 |
| 3. | Columbus | 6.54% | 0.61%(+5.93)#3 | 1.31%(+5.24)#341 |
| 4. | Syracuse | 5.65% | 0.61%(+5.04)#4 | 1.31%(+4.34)#438 |
| 5. | Goldsmith | 4.57% | 0.61%(+3.96)#5 | 1.31%(+3.26)#598 |
| 6. | Warsaw | 4.41% | 0.61%(+3.80)#6 | 1.31%(+3.11)#631 |
| 7. | Simonton Lake | 3.42% | 0.61%(+2.81)#7 | 1.31%(+2.12)#898 |
| 8. | Mitchell | 3.37% | 0.61%(+2.76)#8 | 1.31%(+2.06)#913 |
| 9. | Whitestown | 3.35% | 0.61%(+2.74)#9 | 1.31%(+2.04)#921 |
| 10. | Carmel | 3.13% | 0.61%(+2.52)#10 | 1.31%(+1.82)#1,018 |
| 11. | Greenwood | 3.10% | 0.61%(+2.49)#11 | 1.31%(+1.79)#1,032 |
| 12. | Fishers | 3.02% | 0.61%(+2.41)#12 | 1.31%(+1.71)#1,067 |
| 13. | Bloomington | 2.43% | 0.61%(+1.82)#13 | 1.31%(+1.12)#1,343 |
| 14. | Plainfield | 2.35% | 0.61%(+1.74)#14 | 1.31%(+1.05)#1,384 |
| 15. | Otwell | 2.17% | 0.61%(+1.56)#15 | 1.31%(+0.866)#1,498 |
| 16. | Edgewood | 2.08% | 0.61%(+1.47)#16 | 1.31%(+0.774)#1,570 |
| 17. | Avon | 1.99% | 0.61%(+1.38)#17 | 1.31%(+0.684)#1,649 |
| 18. | Munster | 1.90% | 0.61%(+1.29)#18 | 1.31%(+0.588)#1,726 |
| 19. | Seymour | 1.61% | 0.61%(+1.00)#19 | 1.31%(+0.306)#2,017 |
| 20. | Granger | 1.61% | 0.61%(+1.00)#20 | 1.31%(+0.304)#2,019 |
| 21. | Long Beach | 1.60% | 0.61%(+0.994)#21 | 1.31%(+0.297)#2,033 |
| 22. | Middlebury | 1.60% | 0.61%(+0.994)#22 | 1.31%(+0.297)#2,034 |
| 23. | Churubusco | 1.59% | 0.61%(+0.975)#23 | 1.31%(+0.277)#2,058 |
| 24. | Pierceton | 1.49% | 0.61%(+0.878)#24 | 1.31%(+0.180)#2,178 |
| 25. | Spring Grove | 1.41% | 0.61%(+0.795)#25 | 1.31%(+0.097)#2,296 |
| 26. | Spring Hill | 1.39% | 0.61%(+0.779)#26 | 1.31%(+0.081)#2,316 |
| 27. | Fremont | 1.29% | 0.61%(+0.680)#27 | 1.31%(-0.018)#2,438 |
| 28. | Meridian Hills | 1.20% | 0.61%(+0.593)#28 | 1.31%(-0.105)#2,556 |
| 29. | Prince S Lakes | 1.18% | 0.61%(+0.565)#29 | 1.31%(-0.133)#2,618 |
| 30. | Zionsville | 1.14% | 0.61%(+0.525)#30 | 1.31%(-0.173)#2,680 |
| 31. | Marengo | 1.13% | 0.61%(+0.519)#31 | 1.31%(-0.179)#2,690 |
| 32. | Williamsport | 1.08% | 0.61%(+0.473)#32 | 1.31%(-0.225)#2,782 |
| 33. | Jasper | 1.07% | 0.61%(+0.463)#33 | 1.31%(-0.235)#2,798 |
| 34. | Lafayette | 1.04% | 0.61%(+0.430)#34 | 1.31%(-0.268)#2,863 |
| 35. | Valparaiso | 1.01% | 0.61%(+0.405)#35 | 1.31%(-0.293)#2,915 |
| 36. | Clear Lake | 1.01% | 0.61%(+0.400)#36 | 1.31%(-0.298)#2,924 |
| 37. | Bremen | 1.01% | 0.61%(+0.397)#37 | 1.31%(-0.301)#2,930 |
| 38. | Macy | 1.00% | 0.61%(+0.390)#38 | 1.31%(-0.308)#2,947 |
| 39. | Noblesville | 0.96% | 0.61%(+0.351)#39 | 1.31%(-0.347)#3,014 |
| 40. | Chesterton | 0.96% | 0.61%(+0.348)#40 | 1.31%(-0.350)#3,022 |
| 41. | Beech Grove | 0.93% | 0.61%(+0.319)#41 | 1.31%(-0.379)#3,086 |
| 42. | Trafalgar | 0.91% | 0.61%(+0.300)#42 | 1.31%(-0.398)#3,132 |
| 43. | Rossville | 0.86% | 0.61%(+0.247)#43 | 1.31%(-0.450)#3,249 |
| 44. | Indianapolis | 0.85% | 0.61%(+0.242)#44 | 1.31%(-0.456)#3,267 |
| 45. | Sellersburg | 0.81% | 0.61%(+0.204)#45 | 1.31%(-0.494)#3,355 |
| 46. | Kirklin | 0.81% | 0.61%(+0.199)#46 | 1.31%(-0.499)#3,365 |
| 47. | Greenfield | 0.77% | 0.61%(+0.159)#47 | 1.31%(-0.539)#3,467 |
| 48. | Logansport | 0.75% | 0.61%(+0.144)#48 | 1.31%(-0.554)#3,513 |
| 49. | Dyer | 0.73% | 0.61%(+0.121)#49 | 1.31%(-0.577)#3,583 |
| 50. | Hobart | 0.71% | 0.61%(+0.100)#50 | 1.31%(-0.598)#3,642 |
| 51. | Greencastle | 0.71% | 0.61%(+0.099)#51 | 1.31%(-0.598)#3,645 |
| 52. | Albany | 0.70% | 0.61%(+0.091)#52 | 1.31%(-0.607)#3,673 |
| 53. | Yorktown | 0.70% | 0.61%(+0.090)#53 | 1.31%(-0.607)#3,674 |
| 54. | Greensburg | 0.70% | 0.61%(+0.090)#54 | 1.31%(-0.608)#3,678 |
| 55. | Mishawaka | 0.68% | 0.61%(+0.073)#55 | 1.31%(-0.624)#3,728 |
| 56. | Terre Haute | 0.66% | 0.61%(+0.048)#56 | 1.31%(-0.649)#3,809 |
| 57. | Bargersville | 0.60% | 0.61%(-0.012)#57 | 1.31%(-0.709)#3,997 |
| 58. | Danville | 0.59% | 0.61%(-0.020)#58 | 1.31%(-0.718)#4,028 |
| 59. | St John | 0.58% | 0.61%(-0.031)#59 | 1.31%(-0.729)#4,061 |
| 60. | Fortville | 0.56% | 0.61%(-0.053)#60 | 1.31%(-0.751)#4,127 |
| 61. | Kokomo | 0.54% | 0.61%(-0.073)#61 | 1.31%(-0.771)#4,199 |
| 62. | Westfield | 0.51% | 0.61%(-0.103)#62 | 1.31%(-0.800)#4,307 |
| 63. | Ogden Dunes | 0.49% | 0.61%(-0.118)#63 | 1.31%(-0.816)#4,371 |
| 64. | Dunlap | 0.49% | 0.61%(-0.125)#64 | 1.31%(-0.823)#4,392 |
| 65. | Darmstadt | 0.48% | 0.61%(-0.134)#65 | 1.31%(-0.832)#4,443 |
| 66. | Whiteland | 0.47% | 0.61%(-0.143)#66 | 1.31%(-0.841)#4,479 |
| 67. | Wynnedale | 0.46% | 0.61%(-0.152)#67 | 1.31%(-0.849)#4,523 |
| 68. | Cumberland | 0.45% | 0.61%(-0.160)#68 | 1.31%(-0.857)#4,560 |
| 69. | Schererville | 0.45% | 0.61%(-0.161)#69 | 1.31%(-0.858)#4,567 |
| 70. | Jeffersonville | 0.45% | 0.61%(-0.164)#70 | 1.31%(-0.862)#4,589 |
| 71. | Williams Creek | 0.44% | 0.61%(-0.166)#71 | 1.31%(-0.864)#4,595 |
| 72. | Liberty | 0.43% | 0.61%(-0.179)#72 | 1.31%(-0.876)#4,651 |
| 73. | Muncie | 0.43% | 0.61%(-0.179)#73 | 1.31%(-0.877)#4,652 |
| 74. | Aberdeen | 0.40% | 0.61%(-0.212)#74 | 1.31%(-0.909)#4,792 |
| 75. | Notre Dame | 0.39% | 0.61%(-0.224)#75 | 1.31%(-0.922)#4,850 |
| 76. | Bristol | 0.38% | 0.61%(-0.234)#76 | 1.31%(-0.932)#4,891 |
| 77. | Fort Wayne | 0.36% | 0.61%(-0.247)#77 | 1.31%(-0.945)#4,943 |
| 78. | Sunman | 0.34% | 0.61%(-0.269)#78 | 1.31%(-0.967)#5,066 |
| 79. | Brownsburg | 0.34% | 0.61%(-0.270)#79 | 1.31%(-0.968)#5,072 |
| 80. | Holland | 0.33% | 0.61%(-0.283)#80 | 1.31%(-0.981)#5,144 |
| 81. | Woodburn | 0.33% | 0.61%(-0.285)#81 | 1.31%(-0.982)#5,151 |
| 82. | Merrillville | 0.31% | 0.61%(-0.295)#82 | 1.31%(-0.993)#5,208 |
| 83. | South Bend | 0.27% | 0.61%(-0.338)#83 | 1.31%(-1.04)#5,438 |
| 84. | Clinton | 0.27% | 0.61%(-0.341)#84 | 1.31%(-1.04)#5,455 |
| 85. | New Albany | 0.27% | 0.61%(-0.344)#85 | 1.31%(-1.04)#5,479 |
| 86. | Richmond | 0.26% | 0.61%(-0.349)#86 | 1.31%(-1.05)#5,515 |
| 87. | Hammond | 0.24% | 0.61%(-0.374)#87 | 1.31%(-1.07)#5,669 |
| 88. | Crawfordsville | 0.23% | 0.61%(-0.384)#88 | 1.31%(-1.08)#5,736 |
| 89. | Oakland City | 0.21% | 0.61%(-0.404)#89 | 1.31%(-1.10)#5,888 |
| 90. | Montpelier | 0.20% | 0.61%(-0.406)#90 | 1.31%(-1.10)#5,908 |
| 91. | Lawrence | 0.20% | 0.61%(-0.411)#91 | 1.31%(-1.11)#5,938 |
| 92. | Crown Point | 0.19% | 0.61%(-0.421)#92 | 1.31%(-1.12)#6,005 |
| 93. | Sweetser | 0.18% | 0.61%(-0.430)#93 | 1.31%(-1.13)#6,069 |
| 94. | Clarksville | 0.18% | 0.61%(-0.434)#94 | 1.31%(-1.13)#6,092 |
| 95. | Floyds Knobs | 0.17% | 0.61%(-0.435)#95 | 1.31%(-1.13)#6,101 |
| 96. | Evansville | 0.15% | 0.61%(-0.462)#96 | 1.31%(-1.16)#6,276 |
| 97. | Elkhart | 0.15% | 0.61%(-0.465)#97 | 1.31%(-1.16)#6,298 |
| 98. | Lebanon | 0.14% | 0.61%(-0.466)#98 | 1.31%(-1.16)#6,304 |
| 99. | Bedford | 0.13% | 0.61%(-0.480)#99 | 1.31%(-1.18)#6,396 |
| 100. | Franklin | 0.13% | 0.61%(-0.480)#100 | 1.31%(-1.18)#6,397 |
Common Questions
What are the Top 10 Cities with the Highest Percentage of Immigrants from South Central Asia in Indiana?
Top 10 Cities with the Highest Percentage of Immigrants from South Central Asia in Indiana are:
#1
6.67%
#2
6.54%
#3
5.65%
#4
4.41%
#5
3.42%
#6
3.37%
#7
3.35%
#8
3.13%
#9
3.10%
#10
3.02%
What city has the Highest Percentage of Immigrants from South Central Asia in Indiana?
West Lafayette has the Highest Percentage of Immigrants from South Central Asia in Indiana with 6.67%.
What is the Percentage of Immigrants from South Central Asia in the State of Indiana?
Percentage of Immigrants from South Central Asia in Indiana is 0.61%.
What is the Percentage of Immigrants from South Central Asia in the United States?
Percentage of Immigrants from South Central Asia in the United States is 1.31%.