Cities with the Highest Percentage of Immigrants from South Central Asia in Virginia
RELATED REPORTS & OPTIONS
South Central Asia
Virginia
Compare Cities
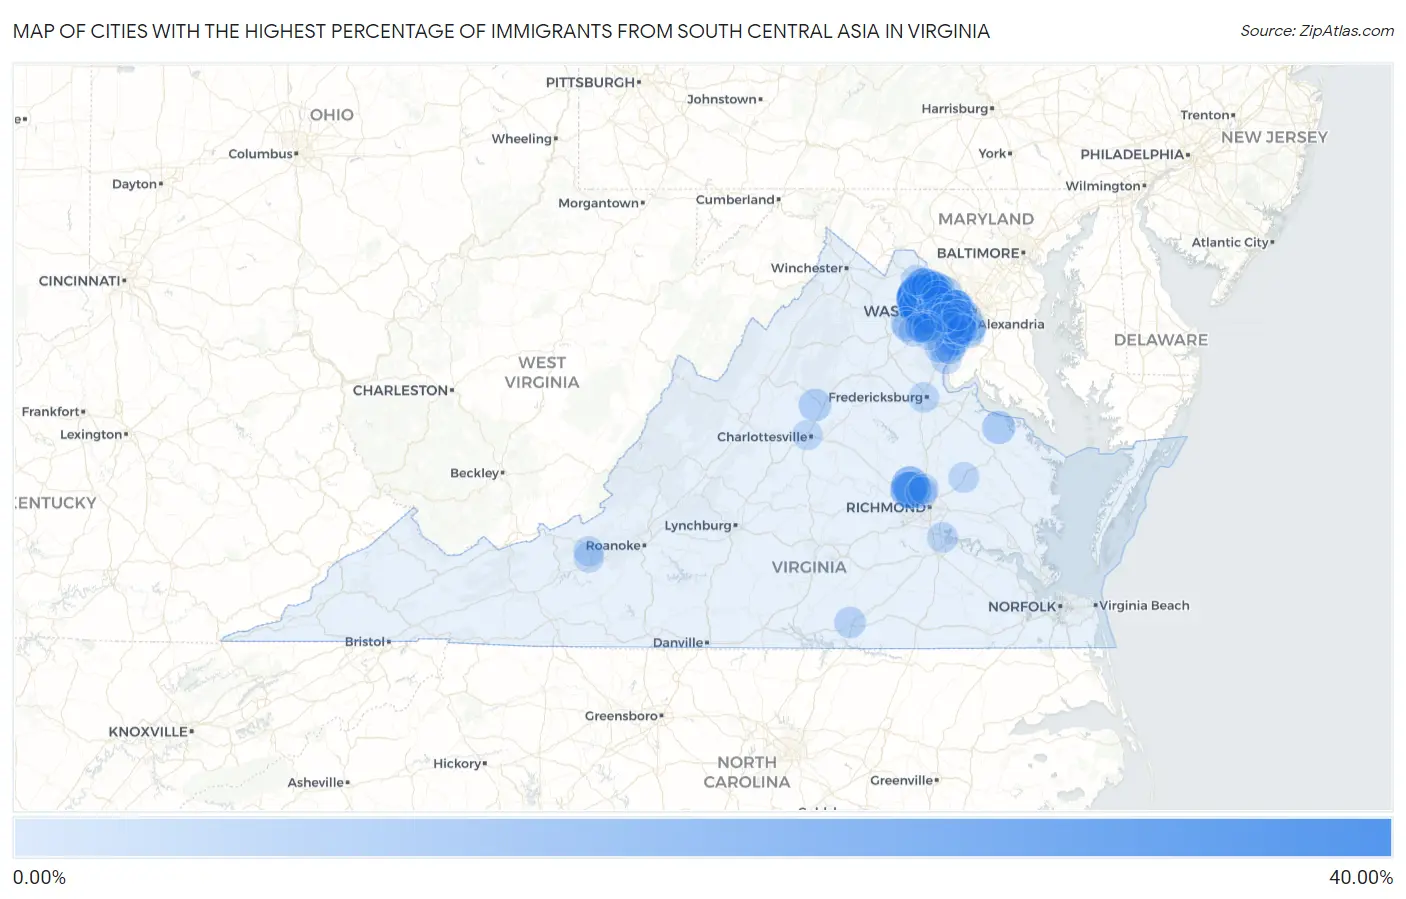
Map of Cities with the Highest Percentage of Immigrants from South Central Asia in Virginia
0.00%
40.00%
Cities with the Highest Percentage of Immigrants from South Central Asia in Virginia
| City | South Central Asia | vs State | vs National | |
| 1. | Loudoun Valley Estates | 33.22% | 2.13%(+31.1)#1 | 1.31%(+31.9)#11 |
| 2. | Sully Square | 30.78% | 2.13%(+28.6)#2 | 1.31%(+29.5)#15 |
| 3. | Moorefield | 24.46% | 2.13%(+22.3)#3 | 1.31%(+23.2)#24 |
| 4. | Brambleton | 24.06% | 2.13%(+21.9)#4 | 1.31%(+22.7)#25 |
| 5. | Mcnair | 23.63% | 2.13%(+21.5)#5 | 1.31%(+22.3)#26 |
| 6. | Oak Grove | 21.44% | 2.13%(+19.3)#6 | 1.31%(+20.1)#30 |
| 7. | Chantilly | 16.42% | 2.13%(+14.3)#7 | 1.31%(+15.1)#58 |
| 8. | Goose Creek | 15.74% | 2.13%(+13.6)#8 | 1.31%(+14.4)#67 |
| 9. | Arcola | 15.55% | 2.13%(+13.4)#9 | 1.31%(+14.2)#69 |
| 10. | Merrifield | 15.40% | 2.13%(+13.3)#10 | 1.31%(+14.1)#73 |
| 11. | South Riding | 14.78% | 2.13%(+12.6)#11 | 1.31%(+13.5)#77 |
| 12. | Floris | 14.75% | 2.13%(+12.6)#12 | 1.31%(+13.4)#79 |
| 13. | Navy | 14.46% | 2.13%(+12.3)#13 | 1.31%(+13.2)#83 |
| 14. | Innsbrook | 14.05% | 2.13%(+11.9)#14 | 1.31%(+12.7)#89 |
| 15. | Wyndham | 13.86% | 2.13%(+11.7)#15 | 1.31%(+12.5)#91 |
| 16. | Short Pump | 13.51% | 2.13%(+11.4)#16 | 1.31%(+12.2)#95 |
| 17. | Pimmit Hills | 12.95% | 2.13%(+10.8)#17 | 1.31%(+11.6)#107 |
| 18. | Dulles Town Center | 12.93% | 2.13%(+10.8)#18 | 1.31%(+11.6)#108 |
| 19. | Greenbriar | 12.45% | 2.13%(+10.3)#19 | 1.31%(+11.1)#121 |
| 20. | Tysons | 12.42% | 2.13%(+10.3)#20 | 1.31%(+11.1)#122 |
| 21. | Fair Lakes | 12.11% | 2.13%(+9.98)#21 | 1.31%(+10.8)#127 |
| 22. | Stone Ridge | 11.84% | 2.13%(+9.71)#22 | 1.31%(+10.5)#130 |
| 23. | Idylwood | 11.74% | 2.13%(+9.61)#23 | 1.31%(+10.4)#133 |
| 24. | Belmont | 11.44% | 2.13%(+9.31)#24 | 1.31%(+10.1)#143 |
| 25. | Laurel Hill | 10.19% | 2.13%(+8.06)#25 | 1.31%(+8.89)#174 |
| 26. | Ashburn | 9.99% | 2.13%(+7.86)#26 | 1.31%(+8.68)#178 |
| 27. | Cascades | 9.96% | 2.13%(+7.83)#27 | 1.31%(+8.65)#179 |
| 28. | Broadlands | 9.87% | 2.13%(+7.74)#28 | 1.31%(+8.56)#181 |
| 29. | University Center | 9.54% | 2.13%(+7.41)#29 | 1.31%(+8.23)#187 |
| 30. | Great Falls | 9.51% | 2.13%(+7.37)#30 | 1.31%(+8.20)#188 |
| 31. | Franklin Farm | 8.99% | 2.13%(+6.86)#31 | 1.31%(+7.68)#208 |
| 32. | Wolf Trap | 8.24% | 2.13%(+6.10)#32 | 1.31%(+6.93)#245 |
| 33. | Union Mill | 8.14% | 2.13%(+6.00)#33 | 1.31%(+6.83)#249 |
| 34. | Bailey S Crossroads | 8.00% | 2.13%(+5.87)#34 | 1.31%(+6.69)#252 |
| 35. | Montross | 7.61% | 2.13%(+5.48)#35 | 1.31%(+6.30)#267 |
| 36. | Sterling | 7.13% | 2.13%(+4.99)#36 | 1.31%(+5.82)#294 |
| 37. | Herndon | 6.99% | 2.13%(+4.86)#37 | 1.31%(+5.68)#306 |
| 38. | Hutchison | 6.82% | 2.13%(+4.69)#38 | 1.31%(+5.52)#314 |
| 39. | Springfield | 6.79% | 2.13%(+4.66)#39 | 1.31%(+5.48)#317 |
| 40. | Lowes Island | 6.73% | 2.13%(+4.60)#40 | 1.31%(+5.42)#320 |
| 41. | Great Falls Crossing | 6.70% | 2.13%(+4.57)#41 | 1.31%(+5.40)#325 |
| 42. | Twin Lakes | 6.70% | 2.13%(+4.56)#42 | 1.31%(+5.39)#327 |
| 43. | Sudley | 6.65% | 2.13%(+4.51)#43 | 1.31%(+5.34)#332 |
| 44. | Sugarland Run | 6.25% | 2.13%(+4.12)#44 | 1.31%(+4.94)#365 |
| 45. | Kincora | 5.99% | 2.13%(+3.86)#45 | 1.31%(+4.69)#386 |
| 46. | Woodburn | 5.86% | 2.13%(+3.73)#46 | 1.31%(+4.56)#405 |
| 47. | Countryside | 5.85% | 2.13%(+3.71)#47 | 1.31%(+4.54)#411 |
| 48. | Potomac Mills | 5.78% | 2.13%(+3.64)#48 | 1.31%(+4.47)#418 |
| 49. | Centreville | 5.74% | 2.13%(+3.61)#49 | 1.31%(+4.44)#424 |
| 50. | Lake Barcroft | 5.73% | 2.13%(+3.60)#50 | 1.31%(+4.42)#426 |
| 51. | Reston | 5.61% | 2.13%(+3.47)#51 | 1.31%(+4.30)#441 |
| 52. | Oakton | 5.55% | 2.13%(+3.42)#52 | 1.31%(+4.24)#448 |
| 53. | Fair Oaks | 5.55% | 2.13%(+3.42)#53 | 1.31%(+4.24)#450 |
| 54. | Braddock | 5.31% | 2.13%(+3.18)#54 | 1.31%(+4.01)#477 |
| 55. | Laurel | 5.29% | 2.13%(+3.15)#55 | 1.31%(+3.98)#484 |
| 56. | Dunn Loring | 5.19% | 2.13%(+3.06)#56 | 1.31%(+3.88)#498 |
| 57. | Lansdowne | 5.17% | 2.13%(+3.04)#57 | 1.31%(+3.86)#500 |
| 58. | Burke Centre | 5.10% | 2.13%(+2.97)#58 | 1.31%(+3.80)#512 |
| 59. | South Hill | 5.08% | 2.13%(+2.95)#59 | 1.31%(+3.77)#517 |
| 60. | Groveton | 4.89% | 2.13%(+2.76)#60 | 1.31%(+3.58)#546 |
| 61. | Dranesville | 4.72% | 2.13%(+2.59)#61 | 1.31%(+3.41)#570 |
| 62. | Lorton | 4.67% | 2.13%(+2.53)#62 | 1.31%(+3.36)#585 |
| 63. | Haymarket | 4.52% | 2.13%(+2.38)#63 | 1.31%(+3.21)#606 |
| 64. | Annandale | 4.49% | 2.13%(+2.35)#64 | 1.31%(+3.18)#616 |
| 65. | Gainesville | 4.41% | 2.13%(+2.27)#65 | 1.31%(+3.10)#633 |
| 66. | Cherry Hill | 4.35% | 2.13%(+2.21)#66 | 1.31%(+3.04)#648 |
| 67. | Dale City | 4.33% | 2.13%(+2.20)#67 | 1.31%(+3.02)#652 |
| 68. | Ravensworth | 4.25% | 2.13%(+2.11)#68 | 1.31%(+2.94)#667 |
| 69. | Vienna | 4.23% | 2.13%(+2.09)#69 | 1.31%(+2.92)#672 |
| 70. | Difficult Run | 4.14% | 2.13%(+2.01)#70 | 1.31%(+2.83)#688 |
| 71. | Woodbridge | 4.11% | 2.13%(+1.98)#71 | 1.31%(+2.80)#695 |
| 72. | Central Garage | 4.02% | 2.13%(+1.89)#72 | 1.31%(+2.71)#717 |
| 73. | Linton Hall | 3.95% | 2.13%(+1.82)#73 | 1.31%(+2.64)#732 |
| 74. | Hybla Valley | 3.92% | 2.13%(+1.79)#74 | 1.31%(+2.61)#737 |
| 75. | Leesylvania | 3.87% | 2.13%(+1.73)#75 | 1.31%(+2.56)#758 |
| 76. | Enon | 3.84% | 2.13%(+1.71)#76 | 1.31%(+2.53)#766 |
| 77. | Burke | 3.84% | 2.13%(+1.71)#77 | 1.31%(+2.53)#768 |
| 78. | Newington | 3.83% | 2.13%(+1.69)#78 | 1.31%(+2.52)#770 |
| 79. | Mantua | 3.80% | 2.13%(+1.67)#79 | 1.31%(+2.49)#779 |
| 80. | Huntington | 3.77% | 2.13%(+1.64)#80 | 1.31%(+2.47)#786 |
| 81. | Leesburg | 3.77% | 2.13%(+1.63)#81 | 1.31%(+2.46)#787 |
| 82. | George Mason | 3.73% | 2.13%(+1.60)#82 | 1.31%(+2.43)#799 |
| 83. | Lincolnia | 3.67% | 2.13%(+1.54)#83 | 1.31%(+2.37)#823 |
| 84. | Fredericksburg | 3.66% | 2.13%(+1.53)#84 | 1.31%(+2.35)#829 |
| 85. | Loch Lomond | 3.64% | 2.13%(+1.50)#85 | 1.31%(+2.33)#833 |
| 86. | Mclean | 3.55% | 2.13%(+1.42)#86 | 1.31%(+2.24)#854 |
| 87. | Kings Park | 3.52% | 2.13%(+1.39)#87 | 1.31%(+2.21)#864 |
| 88. | Merrimac | 3.42% | 2.13%(+1.29)#88 | 1.31%(+2.11)#900 |
| 89. | West Springfield | 3.42% | 2.13%(+1.29)#89 | 1.31%(+2.11)#901 |
| 90. | University Of Virginia | 3.34% | 2.13%(+1.20)#90 | 1.31%(+2.03)#924 |
| 91. | Franconia | 3.33% | 2.13%(+1.20)#91 | 1.31%(+2.02)#928 |
| 92. | Yorkshire | 3.32% | 2.13%(+1.19)#92 | 1.31%(+2.01)#933 |
| 93. | Glen Allen | 3.23% | 2.13%(+1.10)#93 | 1.31%(+1.92)#965 |
| 94. | Kingstowne | 3.22% | 2.13%(+1.09)#94 | 1.31%(+1.91)#971 |
| 95. | Manassas Park | 3.21% | 2.13%(+1.07)#95 | 1.31%(+1.90)#978 |
| 96. | Blacksburg | 3.20% | 2.13%(+1.07)#96 | 1.31%(+1.89)#981 |
| 97. | Buckhall | 3.16% | 2.13%(+1.03)#97 | 1.31%(+1.86)#997 |
| 98. | Fairfax | 3.14% | 2.13%(+1.00)#98 | 1.31%(+1.83)#1,011 |
| 99. | Bull Run | 3.13% | 2.13%(+1.00)#99 | 1.31%(+1.83)#1,012 |
| 100. | West Falls Church | 3.08% | 2.13%(+0.949)#100 | 1.31%(+1.77)#1,039 |
Common Questions
What are the Top 10 Cities with the Highest Percentage of Immigrants from South Central Asia in Virginia?
Top 10 Cities with the Highest Percentage of Immigrants from South Central Asia in Virginia are:
#1
33.22%
#2
24.06%
#3
23.63%
#4
21.44%
#5
16.42%
#6
15.55%
#7
15.40%
#8
14.78%
#9
14.75%
#10
14.05%
What city has the Highest Percentage of Immigrants from South Central Asia in Virginia?
Loudoun Valley Estates has the Highest Percentage of Immigrants from South Central Asia in Virginia with 33.22%.
What is the Percentage of Immigrants from South Central Asia in the State of Virginia?
Percentage of Immigrants from South Central Asia in Virginia is 2.13%.
What is the Percentage of Immigrants from South Central Asia in the United States?
Percentage of Immigrants from South Central Asia in the United States is 1.31%.