Cities with the Highest Percentage of Immigrants from South Central Asia in North Carolina
RELATED REPORTS & OPTIONS
South Central Asia
North Carolina
Compare Cities
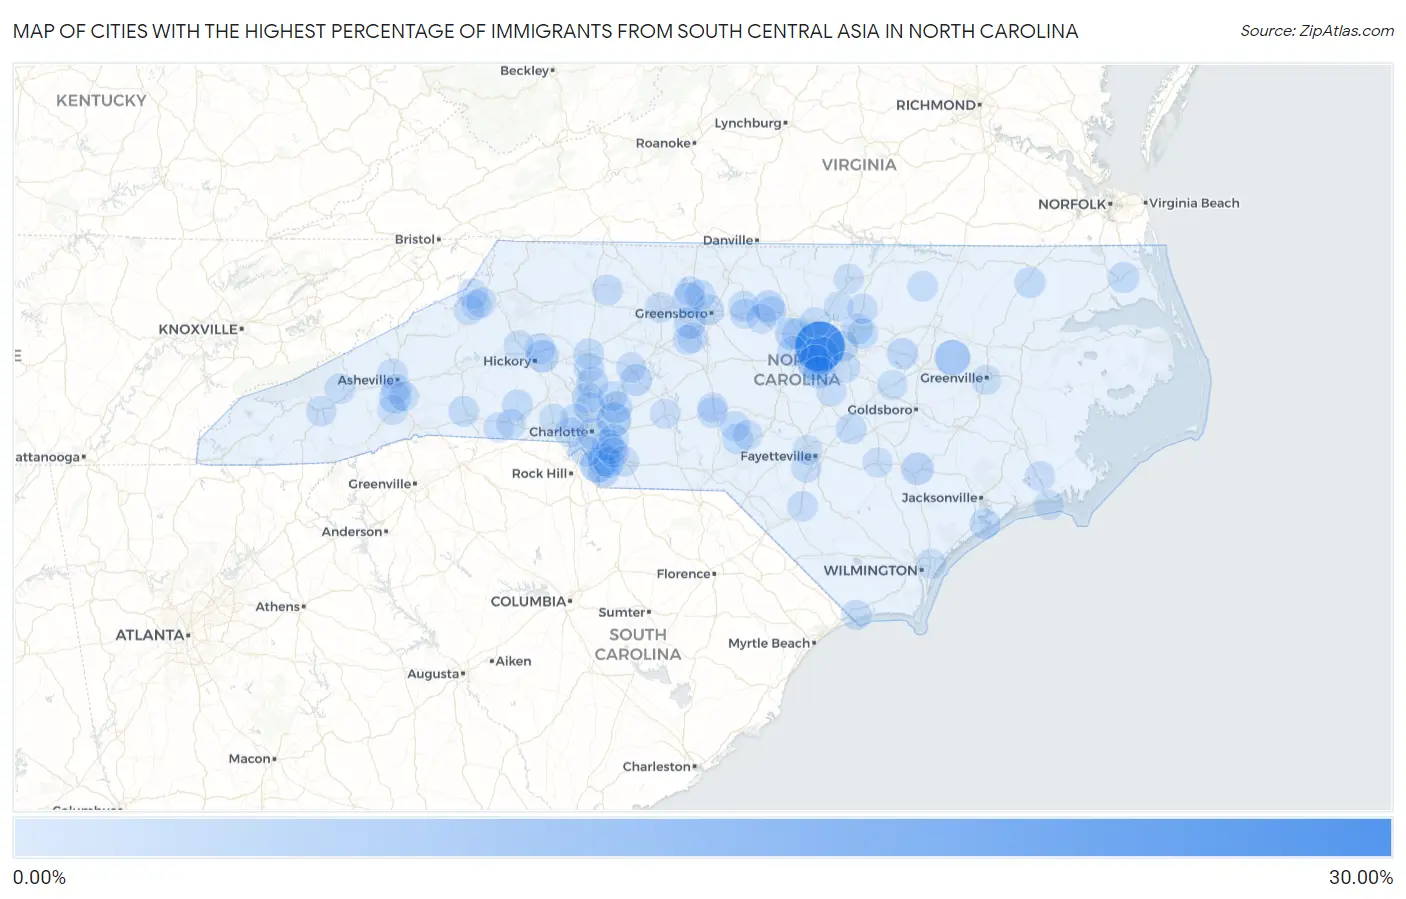
Map of Cities with the Highest Percentage of Immigrants from South Central Asia in North Carolina
0.00%
30.00%
Cities with the Highest Percentage of Immigrants from South Central Asia in North Carolina
| City | South Central Asia | vs State | vs National | |
| 1. | Morrisville | 26.16% | 1.00%(+25.2)#1 | 1.31%(+24.9)#19 |
| 2. | Cary | 10.07% | 1.00%(+9.07)#2 | 1.31%(+8.76)#176 |
| 3. | Apex | 7.43% | 1.00%(+6.44)#3 | 1.31%(+6.12)#278 |
| 4. | Macclesfield | 7.16% | 1.00%(+6.17)#4 | 1.31%(+5.86)#290 |
| 5. | Marvin | 6.40% | 1.00%(+5.40)#5 | 1.31%(+5.09)#351 |
| 6. | Harrisburg | 6.06% | 1.00%(+5.06)#6 | 1.31%(+4.75)#378 |
| 7. | St Stephens | 3.63% | 1.00%(+2.63)#7 | 1.31%(+2.32)#836 |
| 8. | Kenansville | 3.44% | 1.00%(+2.45)#8 | 1.31%(+2.14)#888 |
| 9. | Weddington | 3.29% | 1.00%(+2.30)#9 | 1.31%(+1.99)#944 |
| 10. | Concord | 3.22% | 1.00%(+2.23)#10 | 1.31%(+1.91)#970 |
| 11. | Oak Ridge | 3.16% | 1.00%(+2.16)#11 | 1.31%(+1.85)#1,001 |
| 12. | Holly Springs | 3.03% | 1.00%(+2.04)#12 | 1.31%(+1.72)#1,062 |
| 13. | Carrboro | 3.00% | 1.00%(+2.00)#13 | 1.31%(+1.69)#1,070 |
| 14. | High Point | 2.77% | 1.00%(+1.78)#14 | 1.31%(+1.47)#1,157 |
| 15. | Faith | 2.74% | 1.00%(+1.74)#15 | 1.31%(+1.43)#1,173 |
| 16. | Avery Creek | 2.64% | 1.00%(+1.64)#16 | 1.31%(+1.33)#1,229 |
| 17. | Charlotte | 2.62% | 1.00%(+1.62)#17 | 1.31%(+1.31)#1,238 |
| 18. | Waxhaw | 2.54% | 1.00%(+1.54)#18 | 1.31%(+1.23)#1,275 |
| 19. | Governors | 2.48% | 1.00%(+1.49)#19 | 1.31%(+1.17)#1,301 |
| 20. | Woodlawn | 2.43% | 1.00%(+1.43)#20 | 1.31%(+1.12)#1,346 |
| 21. | Matthews | 2.24% | 1.00%(+1.24)#21 | 1.31%(+0.931)#1,455 |
| 22. | Bailey | 2.18% | 1.00%(+1.18)#22 | 1.31%(+0.871)#1,493 |
| 23. | Mooresville | 2.15% | 1.00%(+1.15)#23 | 1.31%(+0.839)#1,522 |
| 24. | Pineville | 2.09% | 1.00%(+1.09)#24 | 1.31%(+0.781)#1,567 |
| 25. | Cornelius | 1.91% | 1.00%(+0.911)#25 | 1.31%(+0.600)#1,719 |
| 26. | Chapel Hill | 1.85% | 1.00%(+0.855)#26 | 1.31%(+0.544)#1,771 |
| 27. | Wesley Chapel | 1.78% | 1.00%(+0.784)#27 | 1.31%(+0.472)#1,832 |
| 28. | Camden | 1.67% | 1.00%(+0.670)#28 | 1.31%(+0.359)#1,949 |
| 29. | Ahoskie | 1.59% | 1.00%(+0.594)#29 | 1.31%(+0.283)#2,053 |
| 30. | Sneads Ferry | 1.59% | 1.00%(+0.592)#30 | 1.31%(+0.281)#2,054 |
| 31. | Plain View | 1.54% | 1.00%(+0.543)#31 | 1.31%(+0.231)#2,113 |
| 32. | Raleigh | 1.50% | 1.00%(+0.499)#32 | 1.31%(+0.187)#2,167 |
| 33. | Fallston | 1.49% | 1.00%(+0.496)#33 | 1.31%(+0.184)#2,171 |
| 34. | Durham | 1.47% | 1.00%(+0.476)#34 | 1.31%(+0.164)#2,199 |
| 35. | Bethlehem | 1.46% | 1.00%(+0.468)#35 | 1.31%(+0.156)#2,213 |
| 36. | Greensboro | 1.41% | 1.00%(+0.411)#36 | 1.31%(+0.100)#2,290 |
| 37. | Huntersville | 1.36% | 1.00%(+0.361)#37 | 1.31%(+0.050)#2,363 |
| 38. | Boonville | 1.32% | 1.00%(+0.323)#38 | 1.31%(+0.012)#2,403 |
| 39. | Governors Club | 1.29% | 1.00%(+0.297)#39 | 1.31%(-0.015)#2,430 |
| 40. | Elon | 1.27% | 1.00%(+0.276)#40 | 1.31%(-0.036)#2,459 |
| 41. | Foxfire | 1.26% | 1.00%(+0.263)#41 | 1.31%(-0.049)#2,471 |
| 42. | Summerfield | 1.20% | 1.00%(+0.205)#42 | 1.31%(-0.107)#2,559 |
| 43. | Statesville | 1.20% | 1.00%(+0.204)#43 | 1.31%(-0.108)#2,562 |
| 44. | Rutherfordton | 1.20% | 1.00%(+0.202)#44 | 1.31%(-0.109)#2,568 |
| 45. | Wake Forest | 1.19% | 1.00%(+0.196)#45 | 1.31%(-0.115)#2,578 |
| 46. | Rolesville | 1.18% | 1.00%(+0.179)#46 | 1.31%(-0.132)#2,617 |
| 47. | Briar Chapel | 1.09% | 1.00%(+0.091)#47 | 1.31%(-0.220)#2,771 |
| 48. | Biscoe | 1.08% | 1.00%(+0.083)#48 | 1.31%(-0.229)#2,792 |
| 49. | Hollister | 1.06% | 1.00%(+0.066)#49 | 1.31%(-0.245)#2,820 |
| 50. | Barker Ten Mile | 1.04% | 1.00%(+0.044)#50 | 1.31%(-0.268)#2,865 |
| 51. | Maggie Valley | 1.00% | 1.00%(+0.006)#51 | 1.31%(-0.306)#2,941 |
| 52. | Stallings | 0.98% | 1.00%(-0.015)#52 | 1.31%(-0.326)#2,980 |
| 53. | Sylva | 0.96% | 1.00%(-0.035)#53 | 1.31%(-0.347)#3,013 |
| 54. | Garner | 0.95% | 1.00%(-0.046)#54 | 1.31%(-0.358)#3,043 |
| 55. | Newland | 0.94% | 1.00%(-0.054)#55 | 1.31%(-0.366)#3,064 |
| 56. | Franklinton | 0.89% | 1.00%(-0.108)#56 | 1.31%(-0.420)#3,177 |
| 57. | Mebane | 0.87% | 1.00%(-0.125)#57 | 1.31%(-0.437)#3,211 |
| 58. | Carolina Meadows | 0.87% | 1.00%(-0.128)#58 | 1.31%(-0.440)#3,222 |
| 59. | Winston Salem | 0.86% | 1.00%(-0.140)#59 | 1.31%(-0.452)#3,253 |
| 60. | Fearrington Village | 0.85% | 1.00%(-0.144)#60 | 1.31%(-0.456)#3,265 |
| 61. | Woodfin | 0.84% | 1.00%(-0.161)#61 | 1.31%(-0.473)#3,307 |
| 62. | Mint Hill | 0.82% | 1.00%(-0.179)#62 | 1.31%(-0.490)#3,348 |
| 63. | Monroe | 0.79% | 1.00%(-0.208)#63 | 1.31%(-0.520)#3,419 |
| 64. | Beech Mountain | 0.75% | 1.00%(-0.245)#64 | 1.31%(-0.556)#3,518 |
| 65. | Archdale | 0.74% | 1.00%(-0.255)#65 | 1.31%(-0.567)#3,551 |
| 66. | Seven Lakes | 0.73% | 1.00%(-0.270)#66 | 1.31%(-0.582)#3,598 |
| 67. | Mount Holly | 0.72% | 1.00%(-0.277)#67 | 1.31%(-0.588)#3,619 |
| 68. | Troutman | 0.70% | 1.00%(-0.292)#68 | 1.31%(-0.603)#3,666 |
| 69. | Angier | 0.69% | 1.00%(-0.305)#69 | 1.31%(-0.616)#3,708 |
| 70. | Burlington | 0.68% | 1.00%(-0.315)#70 | 1.31%(-0.627)#3,736 |
| 71. | Belmont | 0.68% | 1.00%(-0.316)#71 | 1.31%(-0.628)#3,739 |
| 72. | Hope Mills | 0.67% | 1.00%(-0.323)#72 | 1.31%(-0.635)#3,754 |
| 73. | Sunset Beach | 0.67% | 1.00%(-0.328)#73 | 1.31%(-0.640)#3,775 |
| 74. | Havelock | 0.64% | 1.00%(-0.352)#74 | 1.31%(-0.664)#3,853 |
| 75. | Micro | 0.63% | 1.00%(-0.367)#75 | 1.31%(-0.679)#3,902 |
| 76. | Boiling Springs | 0.63% | 1.00%(-0.369)#76 | 1.31%(-0.681)#3,907 |
| 77. | Greenville | 0.62% | 1.00%(-0.375)#77 | 1.31%(-0.687)#3,925 |
| 78. | Sugar Mountain | 0.61% | 1.00%(-0.383)#78 | 1.31%(-0.695)#3,948 |
| 79. | Salisbury | 0.60% | 1.00%(-0.398)#79 | 1.31%(-0.710)#3,999 |
| 80. | Kings Grant | 0.60% | 1.00%(-0.401)#80 | 1.31%(-0.712)#4,010 |
| 81. | Pine Knoll Shores | 0.59% | 1.00%(-0.409)#81 | 1.31%(-0.721)#4,037 |
| 82. | Indian Trail | 0.59% | 1.00%(-0.411)#82 | 1.31%(-0.723)#4,047 |
| 83. | Kannapolis | 0.58% | 1.00%(-0.421)#83 | 1.31%(-0.732)#4,071 |
| 84. | Fayetteville | 0.54% | 1.00%(-0.454)#84 | 1.31%(-0.766)#4,179 |
| 85. | Trinity | 0.54% | 1.00%(-0.454)#85 | 1.31%(-0.766)#4,180 |
| 86. | Shelby | 0.54% | 1.00%(-0.458)#86 | 1.31%(-0.769)#4,194 |
| 87. | Asheville | 0.53% | 1.00%(-0.468)#87 | 1.31%(-0.780)#4,229 |
| 88. | Mills River | 0.52% | 1.00%(-0.475)#88 | 1.31%(-0.787)#4,253 |
| 89. | Oxford | 0.52% | 1.00%(-0.478)#89 | 1.31%(-0.790)#4,270 |
| 90. | Star | 0.50% | 1.00%(-0.500)#90 | 1.31%(-0.811)#4,353 |
| 91. | Seven Devils | 0.47% | 1.00%(-0.522)#91 | 1.31%(-0.834)#4,453 |
| 92. | Albemarle | 0.46% | 1.00%(-0.540)#92 | 1.31%(-0.852)#4,534 |
| 93. | Creedmoor | 0.45% | 1.00%(-0.545)#93 | 1.31%(-0.856)#4,553 |
| 94. | Royal Pines | 0.43% | 1.00%(-0.569)#94 | 1.31%(-0.881)#4,662 |
| 95. | Dallas | 0.42% | 1.00%(-0.572)#95 | 1.31%(-0.884)#4,674 |
| 96. | Clinton | 0.39% | 1.00%(-0.602)#96 | 1.31%(-0.913)#4,810 |
| 97. | Stokesdale | 0.39% | 1.00%(-0.607)#97 | 1.31%(-0.918)#4,825 |
| 98. | Pinehurst | 0.37% | 1.00%(-0.623)#98 | 1.31%(-0.934)#4,895 |
| 99. | Hudson | 0.37% | 1.00%(-0.626)#99 | 1.31%(-0.938)#4,911 |
| 100. | Swepsonville | 0.37% | 1.00%(-0.631)#100 | 1.31%(-0.943)#4,930 |
Common Questions
What are the Top 10 Cities with the Highest Percentage of Immigrants from South Central Asia in North Carolina?
Top 10 Cities with the Highest Percentage of Immigrants from South Central Asia in North Carolina are:
#1
26.16%
#2
10.07%
#3
7.43%
#4
7.16%
#5
6.40%
#6
6.06%
#7
3.63%
#8
3.44%
#9
3.29%
#10
3.22%
What city has the Highest Percentage of Immigrants from South Central Asia in North Carolina?
Morrisville has the Highest Percentage of Immigrants from South Central Asia in North Carolina with 26.16%.
What is the Percentage of Immigrants from South Central Asia in the State of North Carolina?
Percentage of Immigrants from South Central Asia in North Carolina is 1.00%.
What is the Percentage of Immigrants from South Central Asia in the United States?
Percentage of Immigrants from South Central Asia in the United States is 1.31%.