Cities with the Highest Percentage of Immigrants from South Central Asia in the United States
RELATED REPORTS & OPTIONS
South Central Asia
United States
Compare Cities
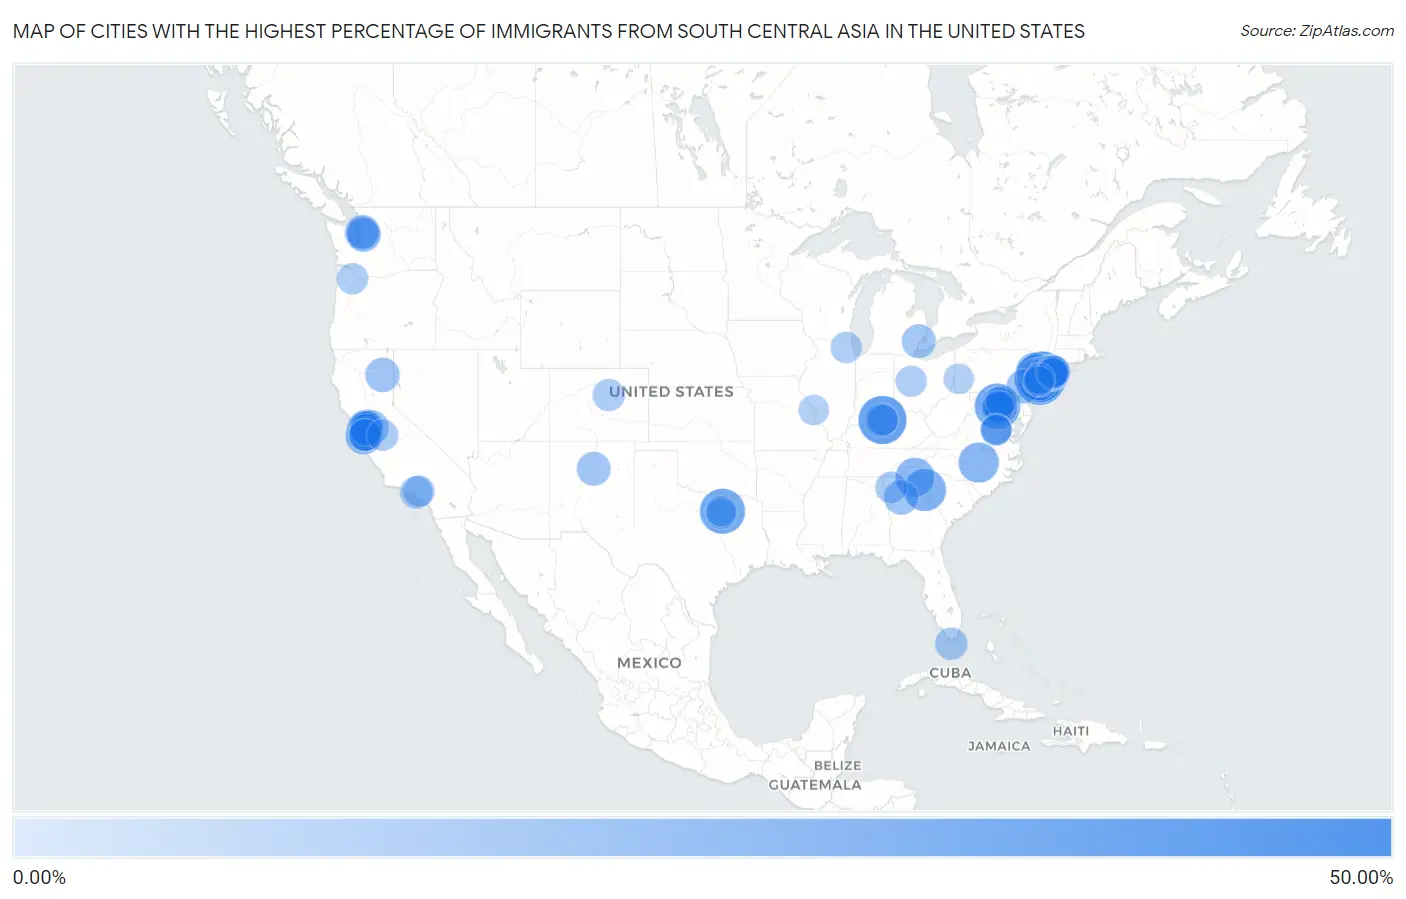
Map of Cities with the Highest Percentage of Immigrants from South Central Asia in the United States
0.00%
50.00%
Cities with the Highest Percentage of Immigrants from South Central Asia in the United States
| City | South Central Asia | vs State | vs National | |
| 1. | Mongaup Valley | 43.40% | 2.20%(+41.2)#1 | 1.31%(+42.1)#1 |
| 2. | Monroe Manor | 41.58% | 3.62%(+38.0)#1 | 1.31%(+40.3)#2 |
| 3. | Deans | 39.37% | 3.62%(+35.8)#2 | 1.31%(+38.1)#3 |
| 4. | Iselin | 38.78% | 3.62%(+35.2)#3 | 1.31%(+37.5)#4 |
| 5. | Ten Mile Run | 37.30% | 3.62%(+33.7)#4 | 1.31%(+36.0)#5 |
| 6. | Hurstbourne Acres | 36.72% | 0.48%(+36.2)#1 | 1.31%(+35.4)#6 |
| 7. | Forsgate | 36.48% | 3.62%(+32.9)#5 | 1.31%(+35.2)#7 |
| 8. | Princeton Meadows | 35.86% | 3.62%(+32.2)#6 | 1.31%(+34.6)#8 |
| 9. | Millbourne Borough | 35.30% | 1.15%(+34.1)#1 | 1.31%(+34.0)#9 |
| 10. | Heathcote | 33.47% | 3.62%(+29.9)#7 | 1.31%(+32.2)#10 |
| 11. | Loudoun Valley Estates | 33.22% | 2.13%(+31.1)#1 | 1.31%(+31.9)#11 |
| 12. | Monmouth Junction | 33.22% | 3.62%(+29.6)#8 | 1.31%(+31.9)#12 |
| 13. | Hebron | 32.84% | 1.60%(+31.2)#1 | 1.31%(+31.5)#13 |
| 14. | Dayton | 31.85% | 3.62%(+28.2)#9 | 1.31%(+30.5)#14 |
| 15. | Sully Square | 30.78% | 2.13%(+28.6)#2 | 1.31%(+29.5)#15 |
| 16. | Belle Mead | 29.66% | 3.62%(+26.0)#10 | 1.31%(+28.3)#16 |
| 17. | Frazer | 29.17% | 1.15%(+28.0)#2 | 1.31%(+27.9)#17 |
| 18. | Lowndesville | 28.80% | 0.45%(+28.3)#1 | 1.31%(+27.5)#18 |
| 19. | Morrisville | 26.16% | 1.00%(+25.2)#1 | 1.31%(+24.9)#19 |
| 20. | Parsippany | 25.96% | 3.62%(+22.3)#11 | 1.31%(+24.7)#20 |
| 21. | Troy Hills | 25.72% | 3.62%(+22.1)#12 | 1.31%(+24.4)#21 |
| 22. | Sky Valley | 24.87% | 1.32%(+23.6)#1 | 1.31%(+23.6)#22 |
| 23. | Plainsboro Center | 24.48% | 3.62%(+20.9)#13 | 1.31%(+23.2)#23 |
| 24. | Moorefield | 24.46% | 2.13%(+22.3)#3 | 1.31%(+23.2)#24 |
| 25. | Brambleton | 24.06% | 2.13%(+21.9)#4 | 1.31%(+22.7)#25 |
| 26. | Mcnair | 23.63% | 2.13%(+21.5)#5 | 1.31%(+22.3)#26 |
| 27. | Fremont | 22.57% | 2.31%(+20.3)#1 | 1.31%(+21.3)#27 |
| 28. | Franklin Park | 21.92% | 3.62%(+18.3)#14 | 1.31%(+20.6)#28 |
| 29. | Saddle Rock | 21.54% | 2.20%(+19.3)#2 | 1.31%(+20.2)#29 |
| 30. | Oak Grove | 21.44% | 2.13%(+19.3)#6 | 1.31%(+20.1)#30 |
| 31. | Lake Hiawatha | 21.34% | 3.62%(+17.7)#15 | 1.31%(+20.0)#31 |
| 32. | Cupertino | 21.30% | 2.31%(+19.0)#2 | 1.31%(+20.0)#32 |
| 33. | Norris Canyon | 20.65% | 2.31%(+18.3)#3 | 1.31%(+19.3)#33 |
| 34. | Weston | 20.15% | 3.62%(+16.5)#16 | 1.31%(+18.8)#34 |
| 35. | Camino Tassajara | 20.02% | 2.31%(+17.7)#4 | 1.31%(+18.7)#35 |
| 36. | Bothell East | 19.77% | 1.78%(+18.0)#1 | 1.31%(+18.5)#36 |
| 37. | Bellerose Terrace | 19.77% | 2.20%(+17.6)#3 | 1.31%(+18.5)#37 |
| 38. | Mountain House | 19.14% | 2.31%(+16.8)#5 | 1.31%(+17.8)#38 |
| 39. | Searingtown | 18.89% | 2.20%(+16.7)#4 | 1.31%(+17.6)#39 |
| 40. | Saddle Rock Estates | 18.85% | 2.20%(+16.6)#5 | 1.31%(+17.5)#40 |
| 41. | Dublin | 18.82% | 2.31%(+16.5)#6 | 1.31%(+17.5)#41 |
| 42. | Hope | 18.72% | 3.62%(+15.1)#17 | 1.31%(+17.4)#42 |
| 43. | Scottdale | 18.70% | 1.32%(+17.4)#2 | 1.31%(+17.4)#43 |
| 44. | Harlingen | 18.65% | 3.62%(+15.0)#18 | 1.31%(+17.3)#44 |
| 45. | Bradley Gardens | 18.60% | 3.62%(+15.0)#19 | 1.31%(+17.3)#45 |
| 46. | Spaulding | 18.45% | 2.31%(+16.1)#7 | 1.31%(+17.1)#46 |
| 47. | Exton | 18.37% | 1.15%(+17.2)#3 | 1.31%(+17.1)#47 |
| 48. | Hamtramck | 17.88% | 1.17%(+16.7)#1 | 1.31%(+16.6)#48 |
| 49. | Lamy | 17.80% | 0.30%(+17.5)#1 | 1.31%(+16.5)#49 |
| 50. | Secaucus | 17.78% | 3.62%(+14.2)#20 | 1.31%(+16.5)#50 |
| 51. | Milpitas | 17.75% | 2.31%(+15.4)#8 | 1.31%(+16.4)#51 |
| 52. | West Buechel | 17.72% | 0.48%(+17.2)#2 | 1.31%(+16.4)#52 |
| 53. | Redmond | 17.70% | 1.78%(+15.9)#2 | 1.31%(+16.4)#53 |
| 54. | New Lisbon | 17.54% | 0.61%(+16.9)#1 | 1.31%(+16.2)#54 |
| 55. | San Ramon | 16.90% | 2.31%(+14.6)#9 | 1.31%(+15.6)#55 |
| 56. | Encantado | 16.88% | 0.30%(+16.6)#2 | 1.31%(+15.6)#56 |
| 57. | Menlo Park Terrace | 16.62% | 3.62%(+13.0)#21 | 1.31%(+15.3)#57 |
| 58. | Chantilly | 16.42% | 2.13%(+14.3)#7 | 1.31%(+15.1)#58 |
| 59. | Bolivar | 16.33% | 0.20%(+16.1)#1 | 1.31%(+15.0)#59 |
| 60. | Sunnyvale | 16.20% | 2.31%(+13.9)#10 | 1.31%(+14.9)#60 |
| 61. | Mill Creek East | 16.12% | 1.78%(+14.3)#3 | 1.31%(+14.8)#61 |
| 62. | Beverly Hills | 16.06% | 2.31%(+13.7)#11 | 1.31%(+14.8)#62 |
| 63. | Carteret Borough | 16.00% | 3.62%(+12.4)#22 | 1.31%(+14.7)#63 |
| 64. | Layton | 15.97% | 0.67%(+15.3)#1 | 1.31%(+14.7)#64 |
| 65. | Six Mile Run | 15.87% | 3.62%(+12.2)#23 | 1.31%(+14.6)#65 |
| 66. | Pleasanton | 15.75% | 2.31%(+13.4)#12 | 1.31%(+14.4)#66 |
| 67. | Goose Creek | 15.74% | 2.13%(+13.6)#8 | 1.31%(+14.4)#67 |
| 68. | Hicksville | 15.66% | 2.20%(+13.5)#6 | 1.31%(+14.4)#68 |
| 69. | Arcola | 15.55% | 2.13%(+13.4)#9 | 1.31%(+14.2)#69 |
| 70. | Inverness | 15.55% | 0.67%(+14.9)#1 | 1.31%(+14.2)#70 |
| 71. | Great Neck Gardens | 15.45% | 2.20%(+13.3)#7 | 1.31%(+14.1)#71 |
| 72. | Santa Clara | 15.43% | 2.31%(+13.1)#13 | 1.31%(+14.1)#72 |
| 73. | Merrifield | 15.40% | 2.13%(+13.3)#10 | 1.31%(+14.1)#73 |
| 74. | Kings Point | 15.30% | 2.20%(+13.1)#8 | 1.31%(+14.0)#74 |
| 75. | Herricks | 15.20% | 2.20%(+13.0)#9 | 1.31%(+13.9)#75 |
| 76. | Plainville | 14.97% | 1.32%(+13.6)#3 | 1.31%(+13.7)#76 |
| 77. | South Riding | 14.78% | 2.13%(+12.6)#11 | 1.31%(+13.5)#77 |
| 78. | Livingston | 14.77% | 2.31%(+12.5)#14 | 1.31%(+13.5)#78 |
| 79. | Floris | 14.75% | 2.13%(+12.6)#12 | 1.31%(+13.4)#79 |
| 80. | Muttontown | 14.75% | 2.20%(+12.5)#10 | 1.31%(+13.4)#80 |
| 81. | Glendale | 14.68% | 2.31%(+12.4)#15 | 1.31%(+13.4)#81 |
| 82. | South Barrington | 14.48% | 1.71%(+12.8)#1 | 1.31%(+13.2)#82 |
| 83. | Navy | 14.46% | 2.13%(+12.3)#13 | 1.31%(+13.2)#83 |
| 84. | Clarksburg | 14.45% | 1.92%(+12.5)#1 | 1.31%(+13.1)#84 |
| 85. | Bethany | 14.42% | 0.74%(+13.7)#1 | 1.31%(+13.1)#85 |
| 86. | Clifton Gardens | 14.28% | 2.20%(+12.1)#11 | 1.31%(+13.0)#86 |
| 87. | Garden City Park | 14.16% | 2.20%(+12.0)#12 | 1.31%(+12.9)#87 |
| 88. | East Liberty | 14.11% | 0.93%(+13.2)#1 | 1.31%(+12.8)#88 |
| 89. | Innsbrook | 14.05% | 2.13%(+11.9)#14 | 1.31%(+12.7)#89 |
| 90. | Hurstbourne | 13.99% | 0.48%(+13.5)#3 | 1.31%(+12.7)#90 |
| 91. | Wyndham | 13.86% | 2.13%(+11.7)#15 | 1.31%(+12.5)#91 |
| 92. | Robbinsville Center | 13.85% | 3.62%(+10.2)#24 | 1.31%(+12.5)#92 |
| 93. | Irving | 13.77% | 1.60%(+12.2)#2 | 1.31%(+12.5)#93 |
| 94. | Coppell | 13.61% | 1.60%(+12.0)#3 | 1.31%(+12.3)#94 |
| 95. | Short Pump | 13.51% | 2.13%(+11.4)#16 | 1.31%(+12.2)#95 |
| 96. | Kendall Park | 13.44% | 3.62%(+9.82)#25 | 1.31%(+12.1)#96 |
| 97. | Princeton Junction | 13.40% | 3.62%(+9.78)#26 | 1.31%(+12.1)#97 |
| 98. | Sheffield | 13.40% | 0.50%(+12.9)#1 | 1.31%(+12.1)#98 |
| 99. | Enlow | 13.36% | 1.15%(+12.2)#4 | 1.31%(+12.1)#99 |
| 100. | Maryland Heights | 13.33% | 0.53%(+12.8)#1 | 1.31%(+12.0)#100 |
Common Questions
What are the Top 10 Cities with the Highest Percentage of Immigrants from South Central Asia in the United States?
Top 10 Cities with the Highest Percentage of Immigrants from South Central Asia in the United States are:
#1
38.78%
#2
37.30%
#3
36.72%
#4
35.86%
#5
33.47%
#6
33.22%
#7
33.22%
#8
32.84%
#9
31.85%
#10
29.66%
What city has the Highest Percentage of Immigrants from South Central Asia in the United States?
Iselin has the Highest Percentage of Immigrants from South Central Asia in the United States with 38.78%.
What is the Percentage of Immigrants from South Central Asia in the United States?
Percentage of Immigrants from South Central Asia in the United States is 1.31%.