Cities with the Highest Percentage of Immigrants from South Central Asia in Tennessee
RELATED REPORTS & OPTIONS
South Central Asia
Tennessee
Compare Cities
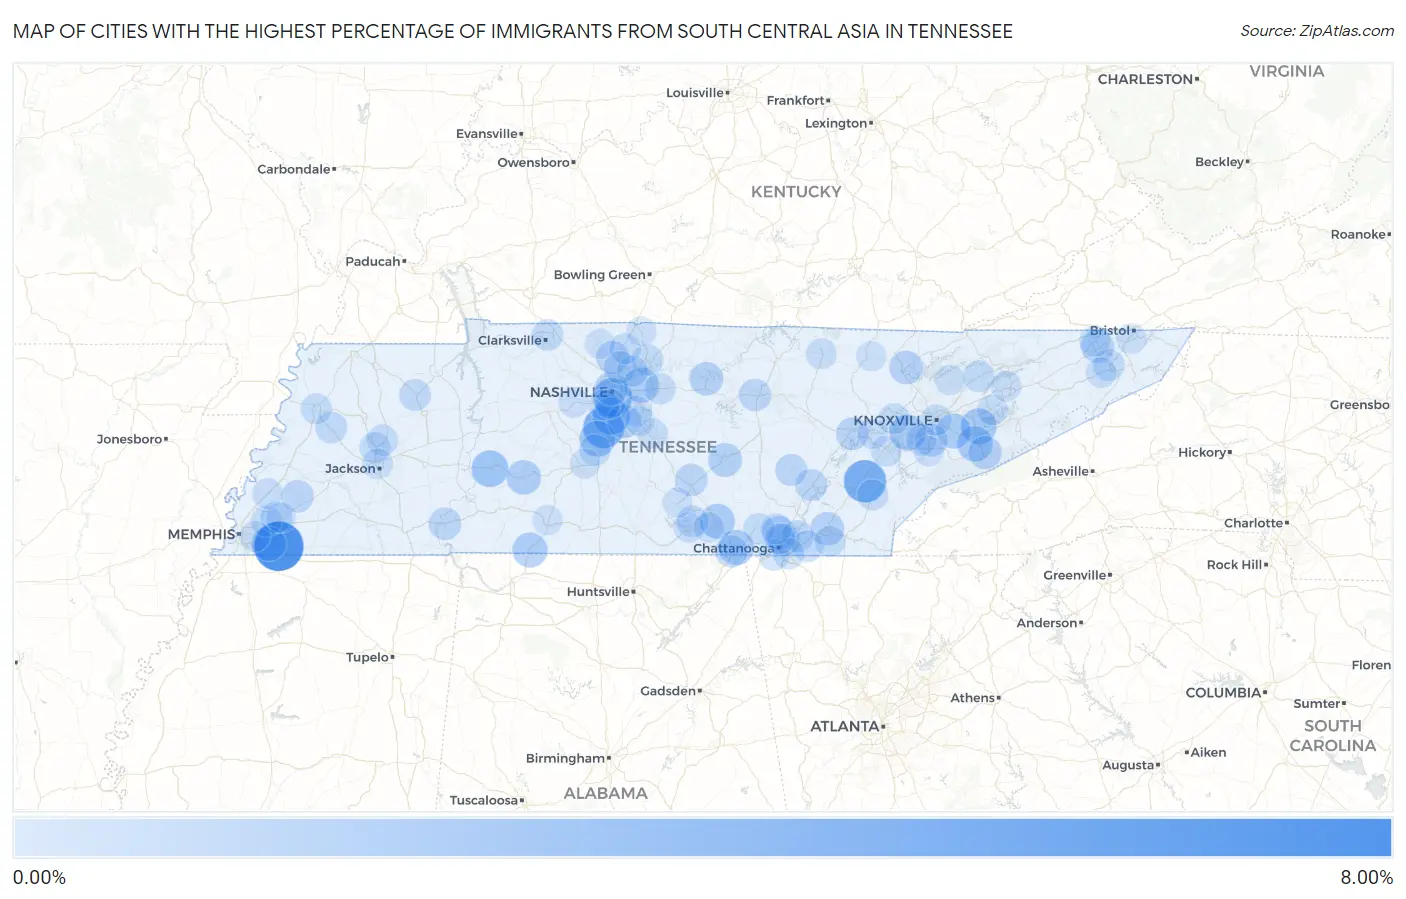
Map of Cities with the Highest Percentage of Immigrants from South Central Asia in Tennessee
0.00%
8.00%
Cities with the Highest Percentage of Immigrants from South Central Asia in Tennessee
| City | South Central Asia | vs State | vs National | |
| 1. | Collierville | 7.48% | 0.49%(+6.98)#1 | 1.31%(+6.17)#275 |
| 2. | Niota | 4.68% | 0.49%(+4.19)#2 | 1.31%(+3.37)#579 |
| 3. | Franklin | 4.23% | 0.49%(+3.73)#3 | 1.31%(+2.92)#671 |
| 4. | Blanche | 4.18% | 0.49%(+3.69)#4 | 1.31%(+2.87)#681 |
| 5. | Mcdonald | 4.08% | 0.49%(+3.58)#5 | 1.31%(+2.77)#703 |
| 6. | Berry Hill | 3.33% | 0.49%(+2.84)#6 | 1.31%(+2.02)#929 |
| 7. | Brentwood | 2.70% | 0.49%(+2.21)#7 | 1.31%(+1.39)#1,192 |
| 8. | Linden | 2.45% | 0.49%(+1.96)#8 | 1.31%(+1.14)#1,329 |
| 9. | Thompson S Station | 2.18% | 0.49%(+1.69)#9 | 1.31%(+0.873)#1,489 |
| 10. | Rocky Top | 2.17% | 0.49%(+1.68)#10 | 1.31%(+0.860)#1,502 |
| 11. | Farragut | 2.16% | 0.49%(+1.66)#11 | 1.31%(+0.848)#1,514 |
| 12. | Sevierville | 2.15% | 0.49%(+1.65)#12 | 1.31%(+0.838)#1,523 |
| 13. | Pigeon Forge | 1.95% | 0.49%(+1.46)#13 | 1.31%(+0.646)#1,681 |
| 14. | Mount Juliet | 1.88% | 0.49%(+1.39)#14 | 1.31%(+0.569)#1,748 |
| 15. | Kimball | 1.81% | 0.49%(+1.32)#15 | 1.31%(+0.500)#1,810 |
| 16. | St Joseph | 1.78% | 0.49%(+1.29)#16 | 1.31%(+0.475)#1,830 |
| 17. | Seymour | 1.76% | 0.49%(+1.27)#17 | 1.31%(+0.452)#1,852 |
| 18. | Monteagle | 1.72% | 0.49%(+1.23)#18 | 1.31%(+0.415)#1,895 |
| 19. | Germantown | 1.68% | 0.49%(+1.18)#19 | 1.31%(+0.369)#1,939 |
| 20. | Hohenwald | 1.61% | 0.49%(+1.12)#20 | 1.31%(+0.299)#2,027 |
| 21. | Mcminnville | 1.38% | 0.49%(+0.889)#21 | 1.31%(+0.073)#2,326 |
| 22. | Nolensville | 1.35% | 0.49%(+0.858)#22 | 1.31%(+0.042)#2,374 |
| 23. | Jacksboro | 1.30% | 0.49%(+0.806)#23 | 1.31%(-0.011)#2,425 |
| 24. | Cleveland | 1.29% | 0.49%(+0.795)#24 | 1.31%(-0.022)#2,443 |
| 25. | Carthage | 1.26% | 0.49%(+0.771)#25 | 1.31%(-0.045)#2,467 |
| 26. | Gatlinburg | 1.18% | 0.49%(+0.691)#26 | 1.31%(-0.125)#2,598 |
| 27. | Colonial Heights | 1.12% | 0.49%(+0.633)#27 | 1.31%(-0.183)#2,703 |
| 28. | Nashville | 1.11% | 0.49%(+0.621)#28 | 1.31%(-0.195)#2,725 |
| 29. | Walden | 1.11% | 0.49%(+0.618)#29 | 1.31%(-0.198)#2,731 |
| 30. | Ridgetop | 1.05% | 0.49%(+0.560)#30 | 1.31%(-0.256)#2,839 |
| 31. | Alcoa | 1.05% | 0.49%(+0.554)#31 | 1.31%(-0.263)#2,852 |
| 32. | Rockwood | 1.01% | 0.49%(+0.514)#32 | 1.31%(-0.302)#2,932 |
| 33. | Savannah | 0.90% | 0.49%(+0.410)#33 | 1.31%(-0.406)#3,146 |
| 34. | Goodlettsville | 0.87% | 0.49%(+0.383)#34 | 1.31%(-0.434)#3,208 |
| 35. | New Union | 0.87% | 0.49%(+0.376)#35 | 1.31%(-0.440)#3,221 |
| 36. | Cookeville | 0.84% | 0.49%(+0.343)#36 | 1.31%(-0.473)#3,308 |
| 37. | Mason | 0.82% | 0.49%(+0.327)#37 | 1.31%(-0.489)#3,346 |
| 38. | South Pittsburg | 0.78% | 0.49%(+0.290)#38 | 1.31%(-0.526)#3,432 |
| 39. | Chattanooga | 0.76% | 0.49%(+0.264)#39 | 1.31%(-0.552)#3,507 |
| 40. | Dayton | 0.73% | 0.49%(+0.237)#40 | 1.31%(-0.580)#3,591 |
| 41. | Pikeville | 0.71% | 0.49%(+0.217)#41 | 1.31%(-0.600)#3,650 |
| 42. | Harrison | 0.65% | 0.49%(+0.158)#42 | 1.31%(-0.658)#3,843 |
| 43. | Mckenzie | 0.62% | 0.49%(+0.132)#43 | 1.31%(-0.684)#3,915 |
| 44. | Friendship | 0.60% | 0.49%(+0.103)#44 | 1.31%(-0.713)#4,011 |
| 45. | Decherd | 0.56% | 0.49%(+0.071)#45 | 1.31%(-0.746)#4,107 |
| 46. | Johnson City | 0.56% | 0.49%(+0.064)#46 | 1.31%(-0.752)#4,131 |
| 47. | Collegedale | 0.55% | 0.49%(+0.054)#47 | 1.31%(-0.763)#4,170 |
| 48. | Clarksville | 0.54% | 0.49%(+0.044)#48 | 1.31%(-0.772)#4,202 |
| 49. | Rutledge | 0.52% | 0.49%(+0.024)#49 | 1.31%(-0.792)#4,278 |
| 50. | Lakeland | 0.48% | 0.49%(-0.014)#50 | 1.31%(-0.830)#4,428 |
| 51. | Spring Hill | 0.47% | 0.49%(-0.022)#51 | 1.31%(-0.838)#4,467 |
| 52. | Gallatin | 0.45% | 0.49%(-0.040)#52 | 1.31%(-0.856)#4,554 |
| 53. | Hendersonville | 0.44% | 0.49%(-0.055)#53 | 1.31%(-0.871)#4,627 |
| 54. | Lebanon | 0.43% | 0.49%(-0.060)#54 | 1.31%(-0.876)#4,647 |
| 55. | Englewood | 0.43% | 0.49%(-0.066)#55 | 1.31%(-0.883)#4,668 |
| 56. | Lookout Mountain | 0.42% | 0.49%(-0.069)#56 | 1.31%(-0.885)#4,678 |
| 57. | Powells Crossroads | 0.42% | 0.49%(-0.077)#57 | 1.31%(-0.893)#4,711 |
| 58. | Kingsport | 0.40% | 0.49%(-0.088)#58 | 1.31%(-0.904)#4,761 |
| 59. | Knoxville | 0.40% | 0.49%(-0.091)#59 | 1.31%(-0.907)#4,779 |
| 60. | Wildwood Lake | 0.37% | 0.49%(-0.119)#60 | 1.31%(-0.936)#4,903 |
| 61. | Medina | 0.37% | 0.49%(-0.121)#61 | 1.31%(-0.937)#4,907 |
| 62. | Dyersburg | 0.36% | 0.49%(-0.133)#62 | 1.31%(-0.949)#4,967 |
| 63. | Oak Ridge | 0.36% | 0.49%(-0.137)#63 | 1.31%(-0.953)#4,986 |
| 64. | Three Way | 0.34% | 0.49%(-0.150)#64 | 1.31%(-0.966)#5,061 |
| 65. | East Ridge | 0.33% | 0.49%(-0.161)#65 | 1.31%(-0.977)#5,125 |
| 66. | White House | 0.32% | 0.49%(-0.169)#66 | 1.31%(-0.985)#5,162 |
| 67. | Fairmount | 0.29% | 0.49%(-0.206)#67 | 1.31%(-1.02)#5,345 |
| 68. | Jamestown | 0.28% | 0.49%(-0.210)#68 | 1.31%(-1.03)#5,367 |
| 69. | Dandridge | 0.27% | 0.49%(-0.223)#69 | 1.31%(-1.04)#5,463 |
| 70. | Loudon | 0.26% | 0.49%(-0.228)#70 | 1.31%(-1.04)#5,496 |
| 71. | Bartlett | 0.26% | 0.49%(-0.231)#71 | 1.31%(-1.05)#5,514 |
| 72. | Memphis | 0.25% | 0.49%(-0.240)#72 | 1.31%(-1.06)#5,581 |
| 73. | Atoka | 0.25% | 0.49%(-0.244)#73 | 1.31%(-1.06)#5,597 |
| 74. | Louisville | 0.21% | 0.49%(-0.285)#74 | 1.31%(-1.10)#5,889 |
| 75. | Forest Hills | 0.20% | 0.49%(-0.289)#75 | 1.31%(-1.10)#5,911 |
| 76. | Murfreesboro | 0.20% | 0.49%(-0.294)#76 | 1.31%(-1.11)#5,958 |
| 77. | Red Bank | 0.19% | 0.49%(-0.299)#77 | 1.31%(-1.12)#5,987 |
| 78. | Jackson | 0.19% | 0.49%(-0.299)#78 | 1.31%(-1.12)#5,989 |
| 79. | Jonesborough | 0.19% | 0.49%(-0.305)#79 | 1.31%(-1.12)#6,028 |
| 80. | Kingston Springs | 0.18% | 0.49%(-0.313)#80 | 1.31%(-1.13)#6,080 |
| 81. | Morristown | 0.17% | 0.49%(-0.325)#81 | 1.31%(-1.14)#6,148 |
| 82. | Winchester | 0.15% | 0.49%(-0.344)#82 | 1.31%(-1.16)#6,274 |
| 83. | La Vergne | 0.13% | 0.49%(-0.357)#83 | 1.31%(-1.17)#6,363 |
| 84. | Maryville | 0.10% | 0.49%(-0.388)#84 | 1.31%(-1.20)#6,595 |
| 85. | Sewanee | 0.10% | 0.49%(-0.389)#85 | 1.31%(-1.21)#6,602 |
| 86. | Kingston | 0.10% | 0.49%(-0.392)#86 | 1.31%(-1.21)#6,619 |
| 87. | Bristol | 0.095% | 0.49%(-0.397)#87 | 1.31%(-1.21)#6,650 |
| 88. | Lawrenceburg | 0.060% | 0.49%(-0.431)#88 | 1.31%(-1.25)#6,883 |
| 89. | Springfield | 0.059% | 0.49%(-0.433)#89 | 1.31%(-1.25)#6,893 |
| 90. | Columbia | 0.057% | 0.49%(-0.435)#90 | 1.31%(-1.25)#6,904 |
| 91. | Huntsville | 0.053% | 0.49%(-0.439)#91 | 1.31%(-1.26)#6,936 |
| 92. | Tullahoma | 0.043% | 0.49%(-0.449)#92 | 1.31%(-1.27)#6,992 |
| 93. | Oak Hill | 0.042% | 0.49%(-0.450)#93 | 1.31%(-1.27)#6,995 |
| 94. | Maynardville | 0.041% | 0.49%(-0.451)#94 | 1.31%(-1.27)#7,001 |
| 95. | Arlington | 0.035% | 0.49%(-0.457)#95 | 1.31%(-1.27)#7,032 |
| 96. | Portland | 0.030% | 0.49%(-0.461)#96 | 1.31%(-1.28)#7,049 |
| 97. | Smyrna | 0.022% | 0.49%(-0.469)#97 | 1.31%(-1.29)#7,091 |
Common Questions
What are the Top 10 Cities with the Highest Percentage of Immigrants from South Central Asia in Tennessee?
Top 10 Cities with the Highest Percentage of Immigrants from South Central Asia in Tennessee are:
#1
7.48%
#2
4.68%
#3
4.23%
#4
3.33%
#5
2.70%
#6
2.45%
#7
2.18%
#8
2.16%
#9
2.15%
#10
1.95%
What city has the Highest Percentage of Immigrants from South Central Asia in Tennessee?
Collierville has the Highest Percentage of Immigrants from South Central Asia in Tennessee with 7.48%.
What is the Percentage of Immigrants from South Central Asia in the State of Tennessee?
Percentage of Immigrants from South Central Asia in Tennessee is 0.49%.
What is the Percentage of Immigrants from South Central Asia in the United States?
Percentage of Immigrants from South Central Asia in the United States is 1.31%.