Cities with the Highest Percentage of Immigrants from South Central Asia in Connecticut
RELATED REPORTS & OPTIONS
South Central Asia
Connecticut
Compare Cities
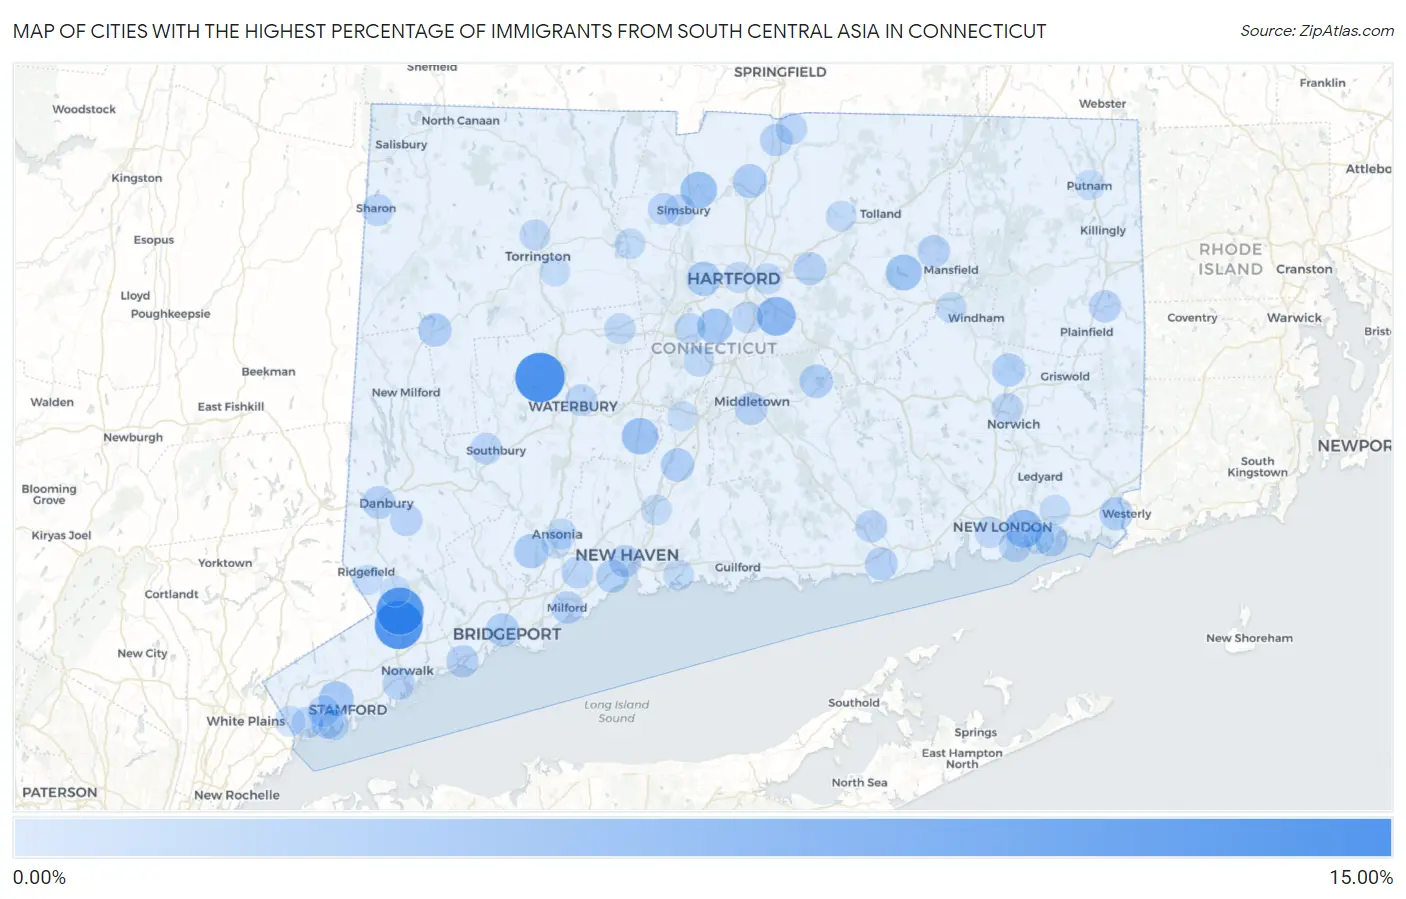
Map of Cities with the Highest Percentage of Immigrants from South Central Asia in Connecticut
0.00%
15.00%
Cities with the Highest Percentage of Immigrants from South Central Asia in Connecticut
| City | South Central Asia | vs State | vs National | |
| 1. | Watertown | 10.60% | 1.58%(+9.02)#1 | 1.31%(+9.29)#162 |
| 2. | Wilton Center | 9.81% | 1.58%(+8.23)#2 | 1.31%(+8.50)#182 |
| 3. | Cannondale | 9.40% | 1.58%(+7.82)#3 | 1.31%(+8.09)#192 |
| 4. | Rock Ridge | 9.09% | 1.58%(+7.52)#4 | 1.31%(+7.78)#205 |
| 5. | South Wilton | 6.65% | 1.58%(+5.08)#5 | 1.31%(+5.34)#330 |
| 6. | New Canaan | 6.34% | 1.58%(+4.76)#6 | 1.31%(+5.03)#354 |
| 7. | Murray | 5.66% | 1.58%(+4.08)#7 | 1.31%(+4.35)#437 |
| 8. | Taylor Corners | 5.30% | 1.58%(+3.73)#8 | 1.31%(+3.99)#481 |
| 9. | Tashua | 5.26% | 1.58%(+3.68)#9 | 1.31%(+3.95)#487 |
| 10. | Glastonbury Center | 4.91% | 1.58%(+3.34)#10 | 1.31%(+3.60)#544 |
| 11. | Daniels Farm | 4.70% | 1.58%(+3.12)#11 | 1.31%(+3.39)#575 |
| 12. | Long Hill | 4.34% | 1.58%(+2.76)#12 | 1.31%(+3.03)#651 |
| 13. | Ridgebury | 4.12% | 1.58%(+2.54)#13 | 1.31%(+2.81)#693 |
| 14. | Lakes East | 4.05% | 1.58%(+2.47)#14 | 1.31%(+2.74)#709 |
| 15. | Tariffville | 3.72% | 1.58%(+2.14)#15 | 1.31%(+2.41)#808 |
| 16. | Cheshire Village | 3.62% | 1.58%(+2.05)#16 | 1.31%(+2.31)#837 |
| 17. | East | 3.60% | 1.58%(+2.03)#17 | 1.31%(+2.30)#841 |
| 18. | South Coventry | 3.34% | 1.58%(+1.76)#18 | 1.31%(+2.03)#923 |
| 19. | Newington | 3.05% | 1.58%(+1.48)#19 | 1.31%(+1.75)#1,054 |
| 20. | Stamford | 2.87% | 1.58%(+1.30)#20 | 1.31%(+1.56)#1,117 |
| 21. | Staples | 2.57% | 1.58%(+0.994)#21 | 1.31%(+1.26)#1,256 |
| 22. | Shelton | 2.51% | 1.58%(+0.936)#22 | 1.31%(+1.20)#1,288 |
| 23. | Noroton Heights | 2.50% | 1.58%(+0.920)#23 | 1.31%(+1.19)#1,297 |
| 24. | West Hartford | 2.48% | 1.58%(+0.904)#24 | 1.31%(+1.17)#1,306 |
| 25. | Windsor Locks | 2.39% | 1.58%(+0.813)#25 | 1.31%(+1.08)#1,369 |
| 26. | Trumbull Center | 2.16% | 1.58%(+0.582)#26 | 1.31%(+0.850)#1,513 |
| 27. | Lake Pocotopaug | 2.12% | 1.58%(+0.546)#27 | 1.31%(+0.813)#1,546 |
| 28. | Pawcatuck | 2.06% | 1.58%(+0.489)#28 | 1.31%(+0.757)#1,587 |
| 29. | Wallingford Center | 2.05% | 1.58%(+0.479)#29 | 1.31%(+0.747)#1,594 |
| 30. | New Preston | 2.05% | 1.58%(+0.471)#30 | 1.31%(+0.739)#1,601 |
| 31. | Bridgeport | 2.01% | 1.58%(+0.439)#31 | 1.31%(+0.706)#1,629 |
| 32. | Baltic | 2.00% | 1.58%(+0.425)#32 | 1.31%(+0.692)#1,641 |
| 33. | Stratford Downtown | 1.90% | 1.58%(+0.323)#33 | 1.31%(+0.590)#1,723 |
| 34. | West Haven | 1.89% | 1.58%(+0.315)#34 | 1.31%(+0.582)#1,733 |
| 35. | Noank | 1.87% | 1.58%(+0.298)#35 | 1.31%(+0.565)#1,749 |
| 36. | Noroton | 1.87% | 1.58%(+0.298)#36 | 1.31%(+0.565)#1,750 |
| 37. | Bigelow Corners | 1.82% | 1.58%(+0.241)#37 | 1.31%(+0.508)#1,797 |
| 38. | Compo | 1.81% | 1.58%(+0.239)#38 | 1.31%(+0.506)#1,801 |
| 39. | Manchester | 1.81% | 1.58%(+0.235)#39 | 1.31%(+0.502)#1,804 |
| 40. | Danbury | 1.78% | 1.58%(+0.201)#40 | 1.31%(+0.469)#1,836 |
| 41. | Weston | 1.76% | 1.58%(+0.181)#41 | 1.31%(+0.449)#1,858 |
| 42. | Poplar Plains | 1.75% | 1.58%(+0.172)#42 | 1.31%(+0.439)#1,867 |
| 43. | Old Saybrook Center | 1.74% | 1.58%(+0.160)#43 | 1.31%(+0.427)#1,881 |
| 44. | Middletown | 1.66% | 1.58%(+0.084)#44 | 1.31%(+0.351)#1,959 |
| 45. | Storrs | 1.64% | 1.58%(+0.066)#45 | 1.31%(+0.333)#1,983 |
| 46. | Riverside | 1.64% | 1.58%(+0.063)#46 | 1.31%(+0.331)#1,987 |
| 47. | Southport | 1.58% | 1.58%(+0.009)#47 | 1.31%(+0.276)#2,061 |
| 48. | Thompsonville | 1.58% | 1.58%(+0.006)#48 | 1.31%(+0.273)#2,065 |
| 49. | Norwalk | 1.55% | 1.58%(-0.023)#49 | 1.31%(+0.244)#2,097 |
| 50. | Milford City Balance | 1.54% | 1.58%(-0.034)#50 | 1.31%(+0.233)#2,110 |
| 51. | New Haven | 1.54% | 1.58%(-0.036)#51 | 1.31%(+0.231)#2,115 |
| 52. | Naugatuck Borough | 1.51% | 1.58%(-0.065)#52 | 1.31%(+0.202)#2,147 |
| 53. | Moosup | 1.48% | 1.58%(-0.095)#53 | 1.31%(+0.172)#2,190 |
| 54. | Bethel | 1.47% | 1.58%(-0.104)#54 | 1.31%(+0.164)#2,200 |
| 55. | Essex Village | 1.43% | 1.58%(-0.144)#55 | 1.31%(+0.123)#2,254 |
| 56. | Stepney | 1.42% | 1.58%(-0.160)#56 | 1.31%(+0.107)#2,277 |
| 57. | Westport | 1.35% | 1.58%(-0.226)#57 | 1.31%(+0.041)#2,375 |
| 58. | Groton | 1.27% | 1.58%(-0.305)#58 | 1.31%(-0.037)#2,461 |
| 59. | Sharon | 1.24% | 1.58%(-0.335)#59 | 1.31%(-0.067)#2,499 |
| 60. | Orange | 1.22% | 1.58%(-0.353)#60 | 1.31%(-0.085)#2,519 |
| 61. | Sherwood Manor | 1.22% | 1.58%(-0.354)#61 | 1.31%(-0.087)#2,524 |
| 62. | Cos Cob | 1.20% | 1.58%(-0.374)#62 | 1.31%(-0.107)#2,560 |
| 63. | Norwich | 1.13% | 1.58%(-0.444)#63 | 1.31%(-0.177)#2,688 |
| 64. | Waterbury | 1.12% | 1.58%(-0.453)#64 | 1.31%(-0.186)#2,707 |
| 65. | Old Hill | 1.12% | 1.58%(-0.455)#65 | 1.31%(-0.188)#2,712 |
| 66. | Darien Downtown | 1.10% | 1.58%(-0.471)#66 | 1.31%(-0.204)#2,738 |
| 67. | Simsbury Center | 1.10% | 1.58%(-0.479)#67 | 1.31%(-0.212)#2,748 |
| 68. | Wethersfield | 1.09% | 1.58%(-0.483)#68 | 1.31%(-0.216)#2,758 |
| 69. | Heritage Village | 1.09% | 1.58%(-0.487)#69 | 1.31%(-0.220)#2,768 |
| 70. | West Simsbury | 1.07% | 1.58%(-0.502)#70 | 1.31%(-0.235)#2,799 |
| 71. | New Britain | 0.99% | 1.58%(-0.582)#71 | 1.31%(-0.315)#2,961 |
| 72. | Greenwich | 0.98% | 1.58%(-0.600)#72 | 1.31%(-0.333)#2,992 |
| 73. | Bristol | 0.96% | 1.58%(-0.615)#73 | 1.31%(-0.348)#3,017 |
| 74. | Torrington | 0.93% | 1.58%(-0.649)#74 | 1.31%(-0.382)#3,093 |
| 75. | Waterford | 0.92% | 1.58%(-0.660)#75 | 1.31%(-0.392)#3,120 |
| 76. | Litchfield Borough | 0.89% | 1.58%(-0.690)#76 | 1.31%(-0.422)#3,185 |
| 77. | Hartford | 0.88% | 1.58%(-0.696)#77 | 1.31%(-0.428)#3,201 |
| 78. | East Hartford | 0.82% | 1.58%(-0.751)#78 | 1.31%(-0.484)#3,332 |
| 79. | Kensington | 0.80% | 1.58%(-0.772)#79 | 1.31%(-0.504)#3,377 |
| 80. | Poquonock Bridge | 0.79% | 1.58%(-0.784)#80 | 1.31%(-0.517)#3,406 |
| 81. | Branford Center | 0.77% | 1.58%(-0.801)#81 | 1.31%(-0.534)#3,452 |
| 82. | Coleytown | 0.77% | 1.58%(-0.808)#82 | 1.31%(-0.541)#3,471 |
| 83. | Glenville | 0.74% | 1.58%(-0.836)#83 | 1.31%(-0.569)#3,558 |
| 84. | Old Greenwich | 0.74% | 1.58%(-0.839)#84 | 1.31%(-0.572)#3,564 |
| 85. | Rockville | 0.73% | 1.58%(-0.842)#85 | 1.31%(-0.574)#3,575 |
| 86. | North Haven | 0.73% | 1.58%(-0.847)#86 | 1.31%(-0.580)#3,592 |
| 87. | Willimantic | 0.68% | 1.58%(-0.894)#87 | 1.31%(-0.627)#3,737 |
| 88. | Saugatuck | 0.67% | 1.58%(-0.908)#88 | 1.31%(-0.641)#3,784 |
| 89. | Collinsville | 0.67% | 1.58%(-0.909)#89 | 1.31%(-0.641)#3,787 |
| 90. | Ansonia | 0.66% | 1.58%(-0.916)#90 | 1.31%(-0.649)#3,803 |
| 91. | Georgetown | 0.60% | 1.58%(-0.971)#91 | 1.31%(-0.704)#3,974 |
| 92. | Northford | 0.55% | 1.58%(-1.03)#92 | 1.31%(-0.759)#4,159 |
| 93. | Old Mystic | 0.50% | 1.58%(-1.07)#93 | 1.31%(-0.806)#4,327 |
| 94. | Putnam | 0.50% | 1.58%(-1.08)#94 | 1.31%(-0.809)#4,339 |
| 95. | Fairfield University | 0.47% | 1.58%(-1.10)#95 | 1.31%(-0.835)#4,456 |
| 96. | Northwest Harwinton | 0.47% | 1.58%(-1.11)#96 | 1.31%(-0.840)#4,473 |
| 97. | Ridgefield | 0.44% | 1.58%(-1.13)#97 | 1.31%(-0.864)#4,597 |
| 98. | Quinnipiac University | 0.43% | 1.58%(-1.15)#98 | 1.31%(-0.882)#4,666 |
| 99. | Meriden | 0.40% | 1.58%(-1.18)#99 | 1.31%(-0.910)#4,796 |
| 100. | Derby | 0.39% | 1.58%(-1.19)#100 | 1.31%(-0.920)#4,836 |
1
2Common Questions
What are the Top 10 Cities with the Highest Percentage of Immigrants from South Central Asia in Connecticut?
Top 10 Cities with the Highest Percentage of Immigrants from South Central Asia in Connecticut are:
#1
10.60%
#2
9.81%
#3
9.40%
#4
4.91%
#5
4.34%
#6
3.72%
#7
3.62%
#8
3.34%
#9
3.05%
#10
2.87%
What city has the Highest Percentage of Immigrants from South Central Asia in Connecticut?
Watertown has the Highest Percentage of Immigrants from South Central Asia in Connecticut with 10.60%.
What is the Percentage of Immigrants from South Central Asia in the State of Connecticut?
Percentage of Immigrants from South Central Asia in Connecticut is 1.58%.
What is the Percentage of Immigrants from South Central Asia in the United States?
Percentage of Immigrants from South Central Asia in the United States is 1.31%.