Cities with the Highest Percentage of Immigrants from South Central Asia in Iowa
RELATED REPORTS & OPTIONS
South Central Asia
Iowa
Compare Cities
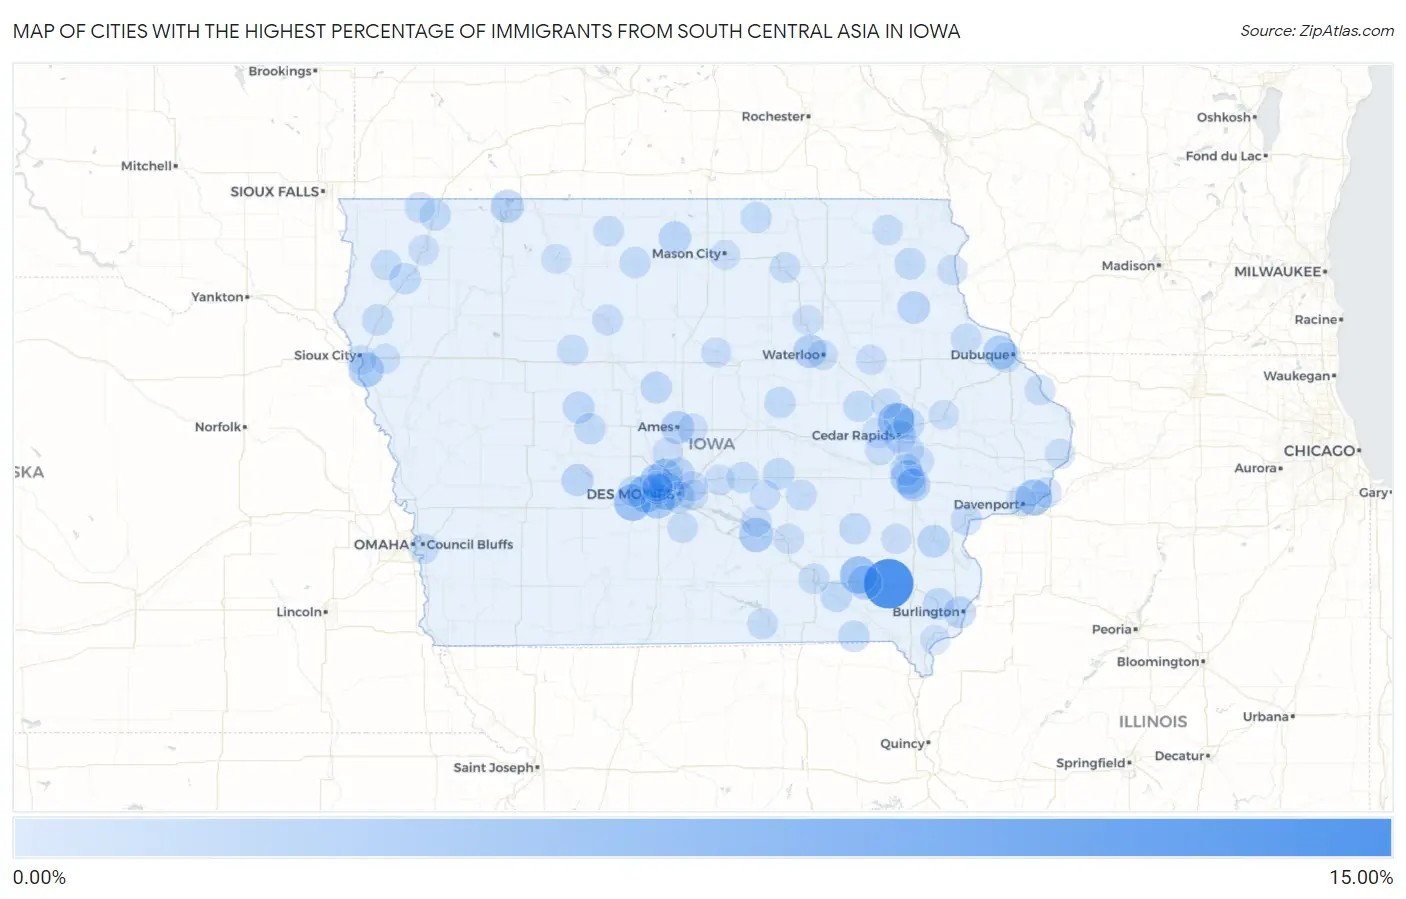
Map of Cities with the Highest Percentage of Immigrants from South Central Asia in Iowa
0.00%
15.00%
Cities with the Highest Percentage of Immigrants from South Central Asia in Iowa
| City | South Central Asia | vs State | vs National | |
| 1. | Lockridge | 11.18% | 0.55%(+10.6)#1 | 1.31%(+9.88)#149 |
| 2. | Maharishi Vedic City | 4.00% | 0.55%(+3.45)#2 | 1.31%(+2.69)#722 |
| 3. | Waukee | 3.98% | 0.55%(+3.43)#3 | 1.31%(+2.67)#728 |
| 4. | Windsor Heights | 3.88% | 0.55%(+3.33)#4 | 1.31%(+2.58)#751 |
| 5. | De Soto | 3.78% | 0.55%(+3.23)#5 | 1.31%(+2.48)#782 |
| 6. | Hiawatha | 3.72% | 0.55%(+3.17)#6 | 1.31%(+2.41)#807 |
| 7. | Bettendorf | 3.39% | 0.55%(+2.84)#7 | 1.31%(+2.08)#907 |
| 8. | Sergeant Bluff | 2.60% | 0.55%(+2.05)#8 | 1.31%(+1.29)#1,244 |
| 9. | West Des Moines | 2.55% | 0.55%(+1.99)#9 | 1.31%(+1.24)#1,268 |
| 10. | Johnston | 2.44% | 0.55%(+1.89)#10 | 1.31%(+1.14)#1,336 |
| 11. | Harvey | 2.33% | 0.55%(+1.77)#11 | 1.31%(+1.02)#1,399 |
| 12. | Fairfield | 2.27% | 0.55%(+1.72)#12 | 1.31%(+0.961)#1,439 |
| 13. | Grimes | 2.18% | 0.55%(+1.63)#13 | 1.31%(+0.873)#1,488 |
| 14. | Coralville | 2.17% | 0.55%(+1.62)#14 | 1.31%(+0.866)#1,496 |
| 15. | Asbury | 2.07% | 0.55%(+1.52)#15 | 1.31%(+0.763)#1,580 |
| 16. | Cedar Falls | 1.84% | 0.55%(+1.29)#16 | 1.31%(+0.530)#1,782 |
| 17. | Orleans | 1.74% | 0.55%(+1.19)#17 | 1.31%(+0.431)#1,876 |
| 18. | Ames | 1.68% | 0.55%(+1.13)#18 | 1.31%(+0.370)#1,936 |
| 19. | Iowa City | 1.61% | 0.55%(+1.06)#19 | 1.31%(+0.301)#2,020 |
| 20. | Columbus Junction | 1.38% | 0.55%(+0.829)#20 | 1.31%(+0.072)#2,331 |
| 21. | Cedar Rapids | 1.37% | 0.55%(+0.822)#21 | 1.31%(+0.065)#2,339 |
| 22. | Forest City | 1.36% | 0.55%(+0.812)#22 | 1.31%(+0.055)#2,356 |
| 23. | Volga | 1.23% | 0.55%(+0.678)#23 | 1.31%(-0.079)#2,509 |
| 24. | Guthrie Center | 1.18% | 0.55%(+0.633)#24 | 1.31%(-0.124)#2,597 |
| 25. | Ankeny | 1.12% | 0.55%(+0.570)#25 | 1.31%(-0.187)#2,710 |
| 26. | Des Moines | 1.09% | 0.55%(+0.542)#26 | 1.31%(-0.215)#2,756 |
| 27. | Burlington | 1.04% | 0.55%(+0.487)#27 | 1.31%(-0.270)#2,867 |
| 28. | Churdan | 0.97% | 0.55%(+0.420)#28 | 1.31%(-0.337)#2,999 |
| 29. | Stanhope | 0.97% | 0.55%(+0.418)#29 | 1.31%(-0.339)#3,005 |
| 30. | North Liberty | 0.91% | 0.55%(+0.361)#30 | 1.31%(-0.396)#3,130 |
| 31. | Danville | 0.84% | 0.55%(+0.293)#31 | 1.31%(-0.464)#3,290 |
| 32. | Eldon | 0.84% | 0.55%(+0.284)#32 | 1.31%(-0.472)#3,305 |
| 33. | Postville | 0.83% | 0.55%(+0.278)#33 | 1.31%(-0.479)#3,325 |
| 34. | Grinnell | 0.82% | 0.55%(+0.269)#34 | 1.31%(-0.488)#3,343 |
| 35. | Marion | 0.82% | 0.55%(+0.265)#35 | 1.31%(-0.492)#3,351 |
| 36. | Harper | 0.81% | 0.55%(+0.255)#36 | 1.31%(-0.502)#3,370 |
| 37. | Alton | 0.78% | 0.55%(+0.228)#37 | 1.31%(-0.529)#3,443 |
| 38. | Cantril | 0.74% | 0.55%(+0.190)#38 | 1.31%(-0.567)#3,553 |
| 39. | Merrill | 0.73% | 0.55%(+0.178)#39 | 1.31%(-0.579)#3,589 |
| 40. | Gladbrook | 0.72% | 0.55%(+0.171)#40 | 1.31%(-0.586)#3,614 |
| 41. | Sibley | 0.67% | 0.55%(+0.120)#41 | 1.31%(-0.637)#3,763 |
| 42. | Jefferson | 0.67% | 0.55%(+0.117)#42 | 1.31%(-0.640)#3,776 |
| 43. | St Ansgar | 0.61% | 0.55%(+0.063)#43 | 1.31%(-0.694)#3,944 |
| 44. | Newton | 0.59% | 0.55%(+0.041)#44 | 1.31%(-0.715)#4,021 |
| 45. | Adel | 0.59% | 0.55%(+0.040)#45 | 1.31%(-0.717)#4,026 |
| 46. | Wesley | 0.56% | 0.55%(+0.012)#46 | 1.31%(-0.745)#4,104 |
| 47. | Vinton | 0.55% | 0.55%(-0.006)#47 | 1.31%(-0.763)#4,172 |
| 48. | Muscatine | 0.54% | 0.55%(-0.006)#48 | 1.31%(-0.763)#4,174 |
| 49. | University Heights | 0.52% | 0.55%(-0.034)#49 | 1.31%(-0.791)#4,274 |
| 50. | Robins | 0.51% | 0.55%(-0.045)#50 | 1.31%(-0.802)#4,313 |
| 51. | Little Rock | 0.47% | 0.55%(-0.086)#51 | 1.31%(-0.843)#4,494 |
| 52. | Luxemburg | 0.45% | 0.55%(-0.101)#52 | 1.31%(-0.858)#4,562 |
| 53. | Montezuma | 0.45% | 0.55%(-0.102)#53 | 1.31%(-0.859)#4,570 |
| 54. | Indianola | 0.45% | 0.55%(-0.103)#54 | 1.31%(-0.860)#4,581 |
| 55. | Manson | 0.41% | 0.55%(-0.144)#55 | 1.31%(-0.901)#4,737 |
| 56. | Centerville | 0.39% | 0.55%(-0.162)#56 | 1.31%(-0.919)#4,828 |
| 57. | Charles City | 0.38% | 0.55%(-0.171)#57 | 1.31%(-0.928)#4,872 |
| 58. | Clive | 0.37% | 0.55%(-0.185)#58 | 1.31%(-0.942)#4,925 |
| 59. | Ottumwa | 0.36% | 0.55%(-0.188)#59 | 1.31%(-0.945)#4,944 |
| 60. | Humboldt | 0.36% | 0.55%(-0.195)#60 | 1.31%(-0.952)#4,980 |
| 61. | Pella | 0.34% | 0.55%(-0.210)#61 | 1.31%(-0.967)#5,069 |
| 62. | Bancroft | 0.32% | 0.55%(-0.229)#62 | 1.31%(-0.985)#5,166 |
| 63. | Le Claire | 0.30% | 0.55%(-0.252)#63 | 1.31%(-1.01)#5,287 |
| 64. | Sioux Center | 0.29% | 0.55%(-0.259)#64 | 1.31%(-1.02)#5,320 |
| 65. | Pleasant Hill | 0.29% | 0.55%(-0.264)#65 | 1.31%(-1.02)#5,342 |
| 66. | Bellevue | 0.28% | 0.55%(-0.270)#66 | 1.31%(-1.03)#5,374 |
| 67. | Urbandale | 0.28% | 0.55%(-0.273)#67 | 1.31%(-1.03)#5,391 |
| 68. | Colfax | 0.27% | 0.55%(-0.277)#68 | 1.31%(-1.03)#5,417 |
| 69. | Sheldahl | 0.26% | 0.55%(-0.289)#69 | 1.31%(-1.05)#5,507 |
| 70. | Waterloo | 0.24% | 0.55%(-0.312)#70 | 1.31%(-1.07)#5,646 |
| 71. | Solon | 0.23% | 0.55%(-0.319)#71 | 1.31%(-1.08)#5,705 |
| 72. | Altoona | 0.22% | 0.55%(-0.331)#72 | 1.31%(-1.09)#5,780 |
| 73. | Oskaloosa | 0.22% | 0.55%(-0.334)#73 | 1.31%(-1.09)#5,808 |
| 74. | Marquette | 0.21% | 0.55%(-0.337)#74 | 1.31%(-1.09)#5,839 |
| 75. | Decorah | 0.20% | 0.55%(-0.354)#75 | 1.31%(-1.11)#5,964 |
| 76. | Lawton | 0.20% | 0.55%(-0.355)#76 | 1.31%(-1.11)#5,969 |
| 77. | Sully | 0.20% | 0.55%(-0.355)#77 | 1.31%(-1.11)#5,974 |
| 78. | Ely | 0.20% | 0.55%(-0.356)#78 | 1.31%(-1.11)#5,975 |
| 79. | Atkins | 0.17% | 0.55%(-0.377)#79 | 1.31%(-1.13)#6,103 |
| 80. | Nevada | 0.17% | 0.55%(-0.378)#80 | 1.31%(-1.13)#6,107 |
| 81. | Sheldon | 0.17% | 0.55%(-0.385)#81 | 1.31%(-1.14)#6,152 |
| 82. | Davenport | 0.16% | 0.55%(-0.390)#82 | 1.31%(-1.15)#6,186 |
| 83. | Center Point | 0.16% | 0.55%(-0.396)#83 | 1.31%(-1.15)#6,223 |
| 84. | Washington | 0.15% | 0.55%(-0.401)#84 | 1.31%(-1.16)#6,259 |
| 85. | Dubuque | 0.14% | 0.55%(-0.408)#85 | 1.31%(-1.16)#6,314 |
| 86. | Walford | 0.14% | 0.55%(-0.412)#86 | 1.31%(-1.17)#6,337 |
| 87. | Council Bluffs | 0.13% | 0.55%(-0.424)#87 | 1.31%(-1.18)#6,423 |
| 88. | Iowa Falls | 0.12% | 0.55%(-0.433)#88 | 1.31%(-1.19)#6,489 |
| 89. | Independence | 0.11% | 0.55%(-0.437)#89 | 1.31%(-1.19)#6,514 |
| 90. | Anamosa | 0.091% | 0.55%(-0.460)#90 | 1.31%(-1.22)#6,687 |
| 91. | Fort Madison | 0.078% | 0.55%(-0.473)#91 | 1.31%(-1.23)#6,761 |
| 92. | Waverly | 0.077% | 0.55%(-0.474)#92 | 1.31%(-1.23)#6,766 |
| 93. | Clinton | 0.073% | 0.55%(-0.478)#93 | 1.31%(-1.23)#6,792 |
| 94. | Sioux City | 0.062% | 0.55%(-0.489)#94 | 1.31%(-1.25)#6,867 |
| 95. | Mason City | 0.029% | 0.55%(-0.522)#95 | 1.31%(-1.28)#7,058 |
| 96. | Emmetsburg | 0.027% | 0.55%(-0.524)#96 | 1.31%(-1.28)#7,066 |
Common Questions
What are the Top 10 Cities with the Highest Percentage of Immigrants from South Central Asia in Iowa?
Top 10 Cities with the Highest Percentage of Immigrants from South Central Asia in Iowa are:
#1
11.18%
#2
4.00%
#3
3.98%
#4
3.88%
#5
3.78%
#6
3.72%
#7
3.39%
#8
2.60%
#9
2.55%
#10
2.44%
What city has the Highest Percentage of Immigrants from South Central Asia in Iowa?
Lockridge has the Highest Percentage of Immigrants from South Central Asia in Iowa with 11.18%.
What is the Percentage of Immigrants from South Central Asia in the State of Iowa?
Percentage of Immigrants from South Central Asia in Iowa is 0.55%.
What is the Percentage of Immigrants from South Central Asia in the United States?
Percentage of Immigrants from South Central Asia in the United States is 1.31%.