Cities with the Highest Percentage of Immigrants from South Central Asia in Florida
RELATED REPORTS & OPTIONS
South Central Asia
Florida
Compare Cities
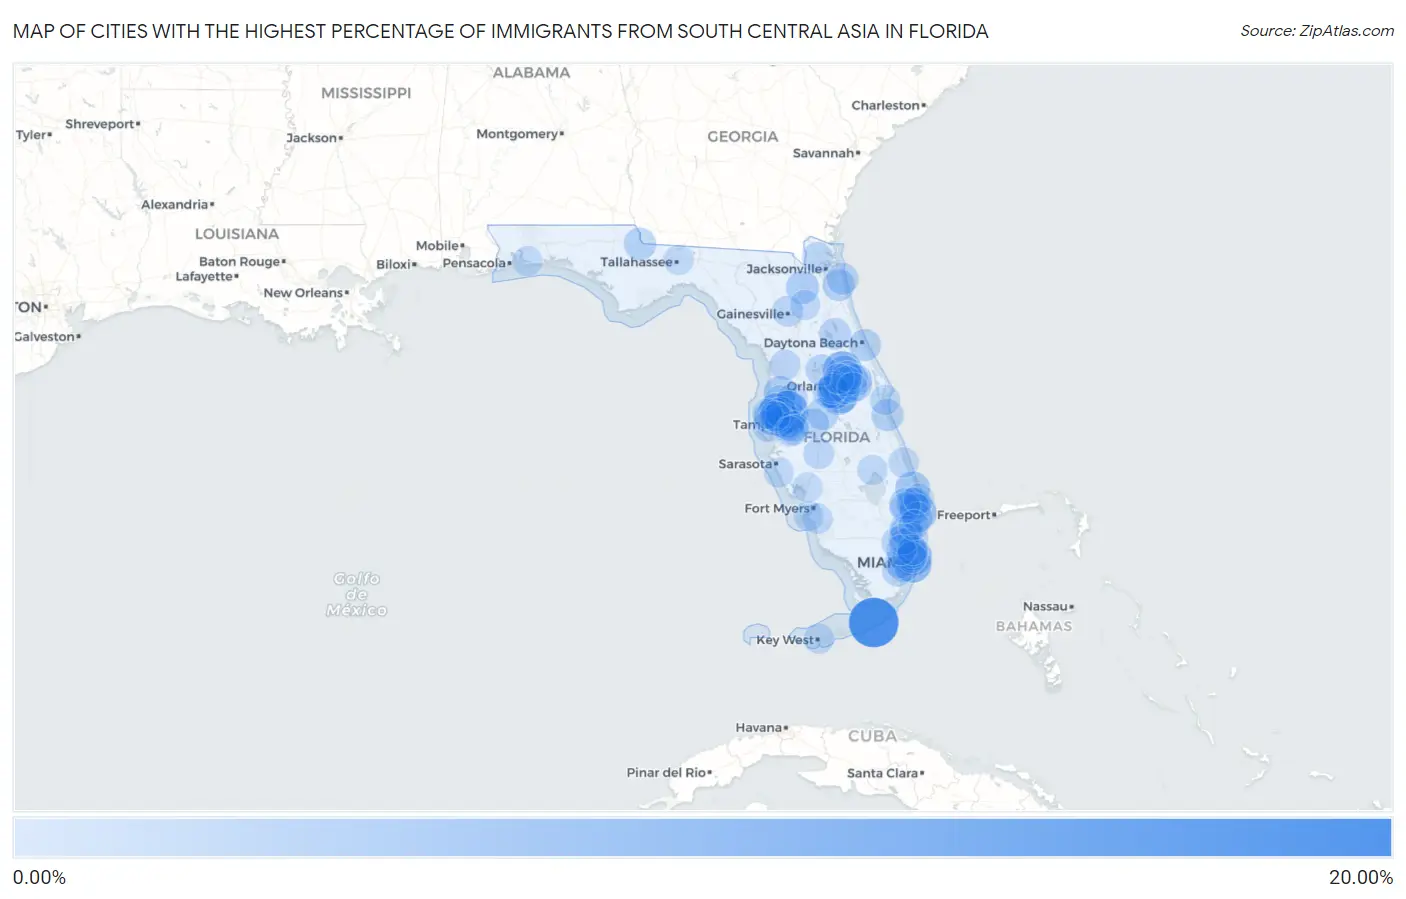
Map of Cities with the Highest Percentage of Immigrants from South Central Asia in Florida
0.00%
20.00%
Cities with the Highest Percentage of Immigrants from South Central Asia in Florida
| City | South Central Asia | vs State | vs National | |
| 1. | Layton | 15.97% | 0.67%(+15.3)#1 | 1.31%(+14.7)#64 |
| 2. | Pebble Creek | 9.57% | 0.67%(+8.90)#2 | 1.31%(+8.26)#184 |
| 3. | Heathrow | 8.46% | 0.67%(+7.79)#3 | 1.31%(+7.15)#233 |
| 4. | Indian Creek | 7.41% | 0.67%(+6.74)#4 | 1.31%(+6.10)#279 |
| 5. | Fisher Island | 6.90% | 0.67%(+6.23)#5 | 1.31%(+5.59)#312 |
| 6. | Manalapan | 5.52% | 0.67%(+4.85)#6 | 1.31%(+4.21)#453 |
| 7. | Cheval | 4.94% | 0.67%(+4.27)#7 | 1.31%(+3.64)#537 |
| 8. | Westchase | 4.65% | 0.67%(+3.98)#8 | 1.31%(+3.34)#586 |
| 9. | Hunters Creek | 4.58% | 0.67%(+3.91)#9 | 1.31%(+3.27)#596 |
| 10. | Limestone Creek | 4.52% | 0.67%(+3.85)#10 | 1.31%(+3.21)#605 |
| 11. | Bay Hill | 4.17% | 0.67%(+3.50)#11 | 1.31%(+2.86)#683 |
| 12. | Lake Mary | 4.15% | 0.67%(+3.48)#12 | 1.31%(+2.85)#687 |
| 13. | Southchase | 4.10% | 0.67%(+3.43)#13 | 1.31%(+2.79)#698 |
| 14. | East Lake Orient Park | 3.91% | 0.67%(+3.24)#14 | 1.31%(+2.60)#742 |
| 15. | Doctor Phillips | 3.86% | 0.67%(+3.19)#15 | 1.31%(+2.55)#761 |
| 16. | Parkland | 3.44% | 0.67%(+2.77)#16 | 1.31%(+2.13)#890 |
| 17. | Masaryktown | 3.42% | 0.67%(+2.75)#17 | 1.31%(+2.12)#897 |
| 18. | Lawtey | 3.23% | 0.67%(+2.57)#18 | 1.31%(+1.93)#964 |
| 19. | Keystone | 3.13% | 0.67%(+2.46)#19 | 1.31%(+1.82)#1,015 |
| 20. | Westgate | 3.06% | 0.67%(+2.39)#20 | 1.31%(+1.75)#1,049 |
| 21. | Thonotosassa | 2.90% | 0.67%(+2.23)#21 | 1.31%(+1.59)#1,106 |
| 22. | Sneads | 2.75% | 0.67%(+2.08)#22 | 1.31%(+1.44)#1,164 |
| 23. | Indialantic | 2.69% | 0.67%(+2.02)#23 | 1.31%(+1.38)#1,202 |
| 24. | Nocatee | 2.58% | 0.67%(+1.91)#24 | 1.31%(+1.27)#1,252 |
| 25. | Lake Alfred | 2.58% | 0.67%(+1.91)#25 | 1.31%(+1.27)#1,253 |
| 26. | Daytona Beach Shores | 2.56% | 0.67%(+1.89)#26 | 1.31%(+1.25)#1,262 |
| 27. | Sawgrass | 2.52% | 0.67%(+1.85)#27 | 1.31%(+1.21)#1,285 |
| 28. | Pelican Marsh | 2.52% | 0.67%(+1.85)#28 | 1.31%(+1.21)#1,286 |
| 29. | Maitland | 2.46% | 0.67%(+1.79)#29 | 1.31%(+1.15)#1,325 |
| 30. | Plantation Mobile Home Park | 2.40% | 0.67%(+1.73)#30 | 1.31%(+1.09)#1,360 |
| 31. | Horizon West | 2.38% | 0.67%(+1.71)#31 | 1.31%(+1.07)#1,372 |
| 32. | Bithlo | 2.27% | 0.67%(+1.60)#32 | 1.31%(+0.965)#1,434 |
| 33. | Weston | 2.26% | 0.67%(+1.59)#33 | 1.31%(+0.951)#1,443 |
| 34. | Connerton | 2.22% | 0.67%(+1.56)#34 | 1.31%(+0.917)#1,461 |
| 35. | Vero Lake Estates | 2.22% | 0.67%(+1.55)#35 | 1.31%(+0.911)#1,466 |
| 36. | Chuluota | 2.17% | 0.67%(+1.50)#36 | 1.31%(+0.866)#1,497 |
| 37. | South Miami | 2.14% | 0.67%(+1.47)#37 | 1.31%(+0.835)#1,525 |
| 38. | Seville | 2.14% | 0.67%(+1.47)#38 | 1.31%(+0.829)#1,532 |
| 39. | Palm Springs | 2.13% | 0.67%(+1.46)#39 | 1.31%(+0.820)#1,541 |
| 40. | Loxahatchee Groves | 2.07% | 0.67%(+1.40)#40 | 1.31%(+0.760)#1,582 |
| 41. | Tavares | 2.03% | 0.67%(+1.36)#41 | 1.31%(+0.725)#1,614 |
| 42. | Mango | 2.02% | 0.67%(+1.35)#42 | 1.31%(+0.708)#1,628 |
| 43. | University Cdp Hillsborough County | 1.94% | 0.67%(+1.27)#43 | 1.31%(+0.633)#1,694 |
| 44. | University Cdp Orange County | 1.92% | 0.67%(+1.25)#44 | 1.31%(+0.613)#1,710 |
| 45. | Odessa | 1.88% | 0.67%(+1.21)#45 | 1.31%(+0.576)#1,739 |
| 46. | Coral Springs | 1.88% | 0.67%(+1.21)#46 | 1.31%(+0.575)#1,740 |
| 47. | Wilton Manors | 1.88% | 0.67%(+1.21)#47 | 1.31%(+0.569)#1,747 |
| 48. | Fountainebleau | 1.87% | 0.67%(+1.20)#48 | 1.31%(+0.560)#1,752 |
| 49. | Bal Harbour | 1.85% | 0.67%(+1.18)#49 | 1.31%(+0.537)#1,775 |
| 50. | Wesley Chapel | 1.76% | 0.67%(+1.09)#50 | 1.31%(+0.449)#1,856 |
| 51. | Brandon | 1.75% | 0.67%(+1.08)#51 | 1.31%(+0.441)#1,865 |
| 52. | Temple Terrace | 1.75% | 0.67%(+1.08)#52 | 1.31%(+0.437)#1,870 |
| 53. | Davie | 1.74% | 0.67%(+1.07)#53 | 1.31%(+0.435)#1,875 |
| 54. | Highland City | 1.73% | 0.67%(+1.06)#54 | 1.31%(+0.426)#1,882 |
| 55. | Northdale | 1.71% | 0.67%(+1.04)#55 | 1.31%(+0.398)#1,914 |
| 56. | Town N Country | 1.70% | 0.67%(+1.03)#56 | 1.31%(+0.393)#1,919 |
| 57. | Nassau Village Ratliff | 1.68% | 0.67%(+1.01)#57 | 1.31%(+0.370)#1,938 |
| 58. | Feather Sound | 1.67% | 0.67%(+1.00)#58 | 1.31%(+0.364)#1,943 |
| 59. | Oviedo | 1.66% | 0.67%(+0.994)#59 | 1.31%(+0.356)#1,953 |
| 60. | Tampa | 1.66% | 0.67%(+0.989)#60 | 1.31%(+0.351)#1,960 |
| 61. | Gainesville | 1.63% | 0.67%(+0.958)#61 | 1.31%(+0.319)#1,997 |
| 62. | Lutz | 1.63% | 0.67%(+0.957)#62 | 1.31%(+0.318)#1,998 |
| 63. | Sunny Isles Beach | 1.60% | 0.67%(+0.934)#63 | 1.31%(+0.295)#2,037 |
| 64. | Gotha | 1.59% | 0.67%(+0.916)#64 | 1.31%(+0.277)#2,059 |
| 65. | St Leo | 1.57% | 0.67%(+0.897)#65 | 1.31%(+0.258)#2,082 |
| 66. | Sunrise | 1.56% | 0.67%(+0.894)#66 | 1.31%(+0.256)#2,085 |
| 67. | Valrico | 1.54% | 0.67%(+0.870)#67 | 1.31%(+0.231)#2,114 |
| 68. | Zolfo Springs | 1.53% | 0.67%(+0.866)#68 | 1.31%(+0.227)#2,119 |
| 69. | Gulf Stream | 1.53% | 0.67%(+0.864)#69 | 1.31%(+0.225)#2,122 |
| 70. | Three Lakes | 1.52% | 0.67%(+0.849)#70 | 1.31%(+0.210)#2,135 |
| 71. | North Bay Village | 1.51% | 0.67%(+0.839)#71 | 1.31%(+0.200)#2,151 |
| 72. | Wellington | 1.50% | 0.67%(+0.831)#72 | 1.31%(+0.193)#2,161 |
| 73. | Inverness Highlands North | 1.50% | 0.67%(+0.827)#73 | 1.31%(+0.188)#2,164 |
| 74. | Conway | 1.48% | 0.67%(+0.810)#74 | 1.31%(+0.171)#2,191 |
| 75. | Carrollwood | 1.41% | 0.67%(+0.742)#75 | 1.31%(+0.103)#2,286 |
| 76. | Three Oaks | 1.40% | 0.67%(+0.728)#76 | 1.31%(+0.089)#2,304 |
| 77. | Palm Beach Shores | 1.40% | 0.67%(+0.728)#77 | 1.31%(+0.089)#2,305 |
| 78. | Fish Hawk | 1.39% | 0.67%(+0.717)#78 | 1.31%(+0.078)#2,321 |
| 79. | Windermere | 1.38% | 0.67%(+0.711)#79 | 1.31%(+0.072)#2,329 |
| 80. | Hallandale Beach | 1.37% | 0.67%(+0.698)#80 | 1.31%(+0.059)#2,350 |
| 81. | Bradfordville | 1.34% | 0.67%(+0.669)#81 | 1.31%(+0.030)#2,381 |
| 82. | Miramar | 1.30% | 0.67%(+0.629)#82 | 1.31%(-0.010)#2,422 |
| 83. | Winter Springs | 1.29% | 0.67%(+0.624)#83 | 1.31%(-0.015)#2,431 |
| 84. | East Lake | 1.29% | 0.67%(+0.621)#84 | 1.31%(-0.018)#2,436 |
| 85. | Goldenrod | 1.27% | 0.67%(+0.603)#85 | 1.31%(-0.036)#2,457 |
| 86. | Boca Raton | 1.26% | 0.67%(+0.589)#86 | 1.31%(-0.050)#2,473 |
| 87. | Citrus Park | 1.25% | 0.67%(+0.578)#87 | 1.31%(-0.061)#2,488 |
| 88. | Key West | 1.25% | 0.67%(+0.577)#88 | 1.31%(-0.062)#2,489 |
| 89. | Riverview | 1.24% | 0.67%(+0.566)#89 | 1.31%(-0.073)#2,503 |
| 90. | Okeechobee | 1.22% | 0.67%(+0.553)#90 | 1.31%(-0.086)#2,522 |
| 91. | Keystone Heights | 1.22% | 0.67%(+0.547)#91 | 1.31%(-0.092)#2,540 |
| 92. | Indian River Estates | 1.21% | 0.67%(+0.537)#92 | 1.31%(-0.102)#2,551 |
| 93. | Forest City | 1.21% | 0.67%(+0.536)#93 | 1.31%(-0.103)#2,553 |
| 94. | Cocoa Beach | 1.20% | 0.67%(+0.531)#94 | 1.31%(-0.108)#2,565 |
| 95. | Osprey | 1.19% | 0.67%(+0.525)#95 | 1.31%(-0.114)#2,575 |
| 96. | Iona | 1.19% | 0.67%(+0.520)#96 | 1.31%(-0.119)#2,584 |
| 97. | Tallahassee | 1.19% | 0.67%(+0.519)#97 | 1.31%(-0.119)#2,588 |
| 98. | Holley | 1.18% | 0.67%(+0.512)#98 | 1.31%(-0.127)#2,601 |
| 99. | Alafaya | 1.18% | 0.67%(+0.508)#99 | 1.31%(-0.130)#2,613 |
| 100. | Cleveland | 1.18% | 0.67%(+0.507)#100 | 1.31%(-0.132)#2,616 |
Common Questions
What are the Top 10 Cities with the Highest Percentage of Immigrants from South Central Asia in Florida?
Top 10 Cities with the Highest Percentage of Immigrants from South Central Asia in Florida are:
#1
15.97%
#2
9.57%
#3
8.46%
#4
7.41%
#5
6.90%
#6
5.52%
#7
4.94%
#8
4.65%
#9
4.58%
#10
4.52%
What city has the Highest Percentage of Immigrants from South Central Asia in Florida?
Layton has the Highest Percentage of Immigrants from South Central Asia in Florida with 15.97%.
What is the Percentage of Immigrants from South Central Asia in the State of Florida?
Percentage of Immigrants from South Central Asia in Florida is 0.67%.
What is the Percentage of Immigrants from South Central Asia in the United States?
Percentage of Immigrants from South Central Asia in the United States is 1.31%.