Cities with the Highest Percentage of Immigrants from South Central Asia in Georgia
RELATED REPORTS & OPTIONS
South Central Asia
Georgia
Compare Cities
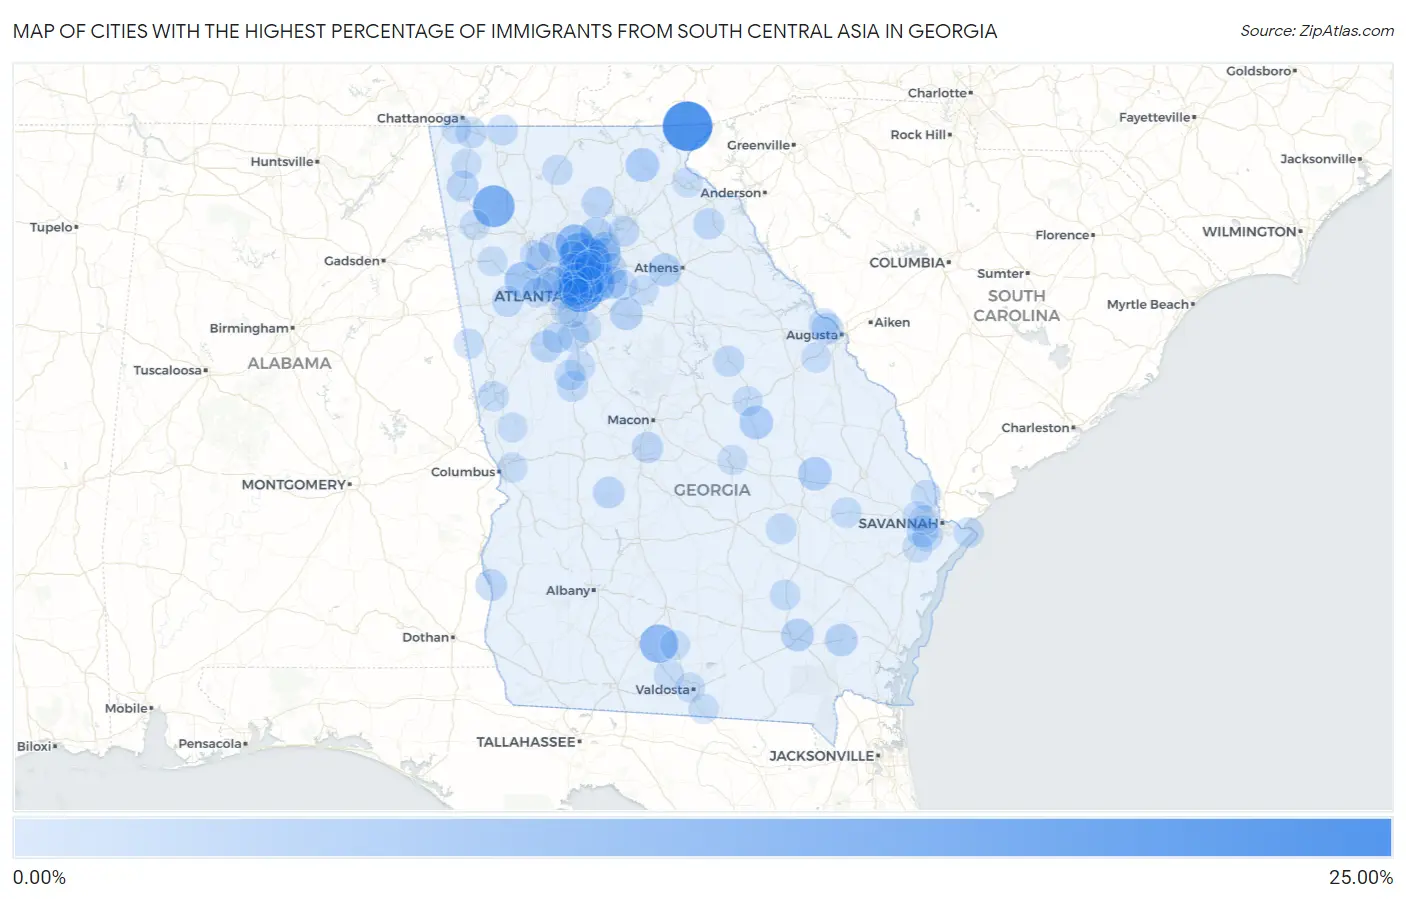
Map of Cities with the Highest Percentage of Immigrants from South Central Asia in Georgia
0.00%
25.00%
Cities with the Highest Percentage of Immigrants from South Central Asia in Georgia
| City | South Central Asia | vs State | vs National | |
| 1. | Sky Valley | 24.87% | 1.32%(+23.6)#1 | 1.31%(+23.6)#22 |
| 2. | Scottdale | 18.70% | 1.32%(+17.4)#2 | 1.31%(+17.4)#43 |
| 3. | Plainville | 14.97% | 1.32%(+13.6)#3 | 1.31%(+13.7)#76 |
| 4. | Alpharetta | 11.73% | 1.32%(+10.4)#4 | 1.31%(+10.4)#134 |
| 5. | Johns Creek | 11.62% | 1.32%(+10.3)#5 | 1.31%(+10.3)#138 |
| 6. | Milton | 10.97% | 1.32%(+9.64)#6 | 1.31%(+9.66)#155 |
| 7. | Ellenton | 10.81% | 1.32%(+9.49)#7 | 1.31%(+9.50)#159 |
| 8. | Crescent | 10.41% | 1.32%(+9.09)#8 | 1.31%(+9.11)#168 |
| 9. | Mountain Park | 9.44% | 1.32%(+8.12)#9 | 1.31%(+8.13)#191 |
| 10. | Clarkston | 8.74% | 1.32%(+7.42)#10 | 1.31%(+7.43)#218 |
| 11. | Dunwoody | 8.49% | 1.32%(+7.17)#11 | 1.31%(+7.19)#230 |
| 12. | Hiram | 7.64% | 1.32%(+6.31)#12 | 1.31%(+6.33)#266 |
| 13. | Doraville | 6.43% | 1.32%(+5.10)#13 | 1.31%(+5.12)#350 |
| 14. | Lilburn | 5.72% | 1.32%(+4.40)#14 | 1.31%(+4.41)#428 |
| 15. | Suwanee | 5.68% | 1.32%(+4.36)#15 | 1.31%(+4.37)#433 |
| 16. | Helen | 4.95% | 1.32%(+3.63)#16 | 1.31%(+3.64)#536 |
| 17. | Harrison | 4.93% | 1.32%(+3.61)#17 | 1.31%(+3.62)#541 |
| 18. | Stillmore | 4.78% | 1.32%(+3.45)#18 | 1.31%(+3.47)#564 |
| 19. | Snellville | 4.23% | 1.32%(+2.91)#19 | 1.31%(+2.92)#669 |
| 20. | North Decatur | 4.10% | 1.32%(+2.78)#20 | 1.31%(+2.79)#696 |
| 21. | Deenwood | 4.05% | 1.32%(+2.73)#21 | 1.31%(+2.75)#708 |
| 22. | Bogart | 4.00% | 1.32%(+2.67)#22 | 1.31%(+2.69)#724 |
| 23. | Cumming | 3.99% | 1.32%(+2.67)#23 | 1.31%(+2.68)#726 |
| 24. | Oxford | 3.94% | 1.32%(+2.61)#24 | 1.31%(+2.63)#734 |
| 25. | Nahunta | 3.82% | 1.32%(+2.50)#25 | 1.31%(+2.52)#771 |
| 26. | Duluth | 3.53% | 1.32%(+2.21)#26 | 1.31%(+2.23)#861 |
| 27. | Sandy Springs | 3.52% | 1.32%(+2.20)#27 | 1.31%(+2.21)#866 |
| 28. | Peachtree City | 3.06% | 1.32%(+1.73)#28 | 1.31%(+1.75)#1,051 |
| 29. | Brookhaven | 2.86% | 1.32%(+1.54)#29 | 1.31%(+1.55)#1,121 |
| 30. | Norcross | 2.76% | 1.32%(+1.44)#30 | 1.31%(+1.45)#1,161 |
| 31. | Dawsonville | 2.63% | 1.32%(+1.31)#31 | 1.31%(+1.33)#1,230 |
| 32. | Montezuma | 2.57% | 1.32%(+1.24)#32 | 1.31%(+1.26)#1,257 |
| 33. | Smyrna | 2.54% | 1.32%(+1.22)#33 | 1.31%(+1.23)#1,272 |
| 34. | Fort Gaines | 2.51% | 1.32%(+1.19)#34 | 1.31%(+1.20)#1,287 |
| 35. | Centerville | 2.48% | 1.32%(+1.16)#35 | 1.31%(+1.17)#1,302 |
| 36. | Henderson | 2.43% | 1.32%(+1.11)#36 | 1.31%(+1.12)#1,345 |
| 37. | Martinez | 2.40% | 1.32%(+1.07)#37 | 1.31%(+1.09)#1,364 |
| 38. | Kennesaw | 2.35% | 1.32%(+1.03)#38 | 1.31%(+1.05)#1,386 |
| 39. | Trion | 2.30% | 1.32%(+0.980)#39 | 1.31%(+0.994)#1,412 |
| 40. | Lawrenceville | 2.22% | 1.32%(+0.894)#40 | 1.31%(+0.908)#1,467 |
| 41. | Franklin Springs | 2.21% | 1.32%(+0.890)#41 | 1.31%(+0.903)#1,470 |
| 42. | Peachtree Corners | 2.20% | 1.32%(+0.878)#42 | 1.31%(+0.891)#1,477 |
| 43. | Sugar Hill | 2.19% | 1.32%(+0.867)#43 | 1.31%(+0.881)#1,482 |
| 44. | Bonanza | 2.17% | 1.32%(+0.850)#44 | 1.31%(+0.863)#1,500 |
| 45. | Zebulon | 2.03% | 1.32%(+0.709)#45 | 1.31%(+0.723)#1,616 |
| 46. | Tucker | 2.01% | 1.32%(+0.692)#46 | 1.31%(+0.706)#1,631 |
| 47. | Sparta | 2.01% | 1.32%(+0.684)#47 | 1.31%(+0.698)#1,636 |
| 48. | Fort Oglethorpe | 2.00% | 1.32%(+0.678)#48 | 1.31%(+0.691)#1,642 |
| 49. | Berry College | 1.97% | 1.32%(+0.647)#49 | 1.31%(+0.661)#1,667 |
| 50. | Villa Rica | 1.94% | 1.32%(+0.620)#50 | 1.31%(+0.634)#1,693 |
| 51. | Uvalda | 1.81% | 1.32%(+0.487)#51 | 1.31%(+0.501)#1,808 |
| 52. | Chamblee | 1.71% | 1.32%(+0.393)#52 | 1.31%(+0.406)#1,904 |
| 53. | North Druid Hills | 1.70% | 1.32%(+0.378)#53 | 1.31%(+0.391)#1,920 |
| 54. | Fayetteville | 1.66% | 1.32%(+0.340)#54 | 1.31%(+0.354)#1,957 |
| 55. | Evans | 1.66% | 1.32%(+0.339)#55 | 1.31%(+0.353)#1,958 |
| 56. | Cohutta | 1.65% | 1.32%(+0.324)#56 | 1.31%(+0.338)#1,977 |
| 57. | Roswell | 1.53% | 1.32%(+0.211)#57 | 1.31%(+0.225)#2,124 |
| 58. | Druid Hills | 1.46% | 1.32%(+0.143)#58 | 1.31%(+0.156)#2,211 |
| 59. | Oakwood | 1.46% | 1.32%(+0.140)#59 | 1.31%(+0.153)#2,214 |
| 60. | Stockbridge | 1.36% | 1.32%(+0.037)#60 | 1.31%(+0.050)#2,360 |
| 61. | Atlanta | 1.33% | 1.32%(+0.012)#61 | 1.31%(+0.026)#2,388 |
| 62. | East Ellijay | 1.32% | 1.32%(-0.001)#62 | 1.31%(+0.013)#2,399 |
| 63. | Hagan | 1.32% | 1.32%(-0.006)#63 | 1.31%(+0.008)#2,407 |
| 64. | Georgetown | 1.31% | 1.32%(-0.009)#64 | 1.31%(+0.005)#2,409 |
| 65. | Williamson | 1.29% | 1.32%(-0.030)#65 | 1.31%(-0.016)#2,435 |
| 66. | Alma | 1.22% | 1.32%(-0.098)#66 | 1.31%(-0.085)#2,518 |
| 67. | Lagrange | 1.17% | 1.32%(-0.148)#67 | 1.31%(-0.134)#2,623 |
| 68. | Tybee Island | 1.09% | 1.32%(-0.234)#68 | 1.31%(-0.220)#2,772 |
| 69. | Rincon | 1.07% | 1.32%(-0.249)#69 | 1.31%(-0.236)#2,800 |
| 70. | Sandersville | 1.05% | 1.32%(-0.274)#70 | 1.31%(-0.260)#2,846 |
| 71. | Conley | 1.04% | 1.32%(-0.287)#71 | 1.31%(-0.273)#2,876 |
| 72. | Acworth | 1.03% | 1.32%(-0.296)#72 | 1.31%(-0.282)#2,889 |
| 73. | Dublin | 1.03% | 1.32%(-0.296)#73 | 1.31%(-0.282)#2,890 |
| 74. | Morven | 1.02% | 1.32%(-0.300)#74 | 1.31%(-0.286)#2,903 |
| 75. | Lake Park | 1.02% | 1.32%(-0.301)#75 | 1.31%(-0.288)#2,907 |
| 76. | Woodstock | 1.01% | 1.32%(-0.313)#76 | 1.31%(-0.299)#2,925 |
| 77. | Vinings | 0.99% | 1.32%(-0.333)#77 | 1.31%(-0.319)#2,969 |
| 78. | Rome | 0.98% | 1.32%(-0.341)#78 | 1.31%(-0.327)#2,983 |
| 79. | Toccoa | 0.96% | 1.32%(-0.361)#79 | 1.31%(-0.347)#3,015 |
| 80. | Hapeville | 0.96% | 1.32%(-0.362)#80 | 1.31%(-0.349)#3,018 |
| 81. | Bloomingdale | 0.95% | 1.32%(-0.367)#81 | 1.31%(-0.353)#3,028 |
| 82. | Sparks | 0.94% | 1.32%(-0.387)#82 | 1.31%(-0.373)#3,075 |
| 83. | Pooler | 0.93% | 1.32%(-0.389)#83 | 1.31%(-0.375)#3,077 |
| 84. | Griffin | 0.92% | 1.32%(-0.406)#84 | 1.31%(-0.393)#3,122 |
| 85. | Berkeley Lake | 0.91% | 1.32%(-0.412)#85 | 1.31%(-0.398)#3,131 |
| 86. | Ephesus | 0.90% | 1.32%(-0.418)#86 | 1.31%(-0.404)#3,142 |
| 87. | Athens-Clarke County Unified Government (Balance) | 0.89% | 1.32%(-0.428)#87 | 1.31%(-0.414)#3,168 |
| 88. | Columbus | 0.89% | 1.32%(-0.429)#88 | 1.31%(-0.415)#3,169 |
| 89. | Hamilton | 0.87% | 1.32%(-0.448)#89 | 1.31%(-0.434)#3,209 |
| 90. | Loganville | 0.87% | 1.32%(-0.454)#90 | 1.31%(-0.440)#3,223 |
| 91. | Mableton | 0.85% | 1.32%(-0.472)#91 | 1.31%(-0.458)#3,270 |
| 92. | Decatur | 0.84% | 1.32%(-0.478)#92 | 1.31%(-0.465)#3,291 |
| 93. | Lookout Mountain | 0.84% | 1.32%(-0.485)#93 | 1.31%(-0.471)#3,302 |
| 94. | Rockmart | 0.82% | 1.32%(-0.500)#94 | 1.31%(-0.487)#3,339 |
| 95. | Remerton | 0.81% | 1.32%(-0.510)#95 | 1.31%(-0.497)#3,359 |
| 96. | Richmond Hill | 0.80% | 1.32%(-0.520)#96 | 1.31%(-0.506)#3,380 |
| 97. | Lithia Springs | 0.79% | 1.32%(-0.535)#97 | 1.31%(-0.522)#3,422 |
| 98. | Lafayette | 0.76% | 1.32%(-0.557)#98 | 1.31%(-0.543)#3,484 |
| 99. | Monroe | 0.75% | 1.32%(-0.570)#99 | 1.31%(-0.557)#3,519 |
| 100. | Blythe | 0.74% | 1.32%(-0.578)#100 | 1.31%(-0.564)#3,544 |
Common Questions
What are the Top 10 Cities with the Highest Percentage of Immigrants from South Central Asia in Georgia?
Top 10 Cities with the Highest Percentage of Immigrants from South Central Asia in Georgia are:
#1
24.87%
#2
18.70%
#3
14.97%
#4
11.73%
#5
11.62%
#6
10.97%
#7
10.81%
#8
9.44%
#9
8.74%
#10
8.49%
What city has the Highest Percentage of Immigrants from South Central Asia in Georgia?
Sky Valley has the Highest Percentage of Immigrants from South Central Asia in Georgia with 24.87%.
What is the Percentage of Immigrants from South Central Asia in the State of Georgia?
Percentage of Immigrants from South Central Asia in Georgia is 1.32%.
What is the Percentage of Immigrants from South Central Asia in the United States?
Percentage of Immigrants from South Central Asia in the United States is 1.31%.