Cities with the Most Immigrants from Pakistan in New Jersey
RELATED REPORTS & OPTIONS
Pakistan
New Jersey
Compare Cities
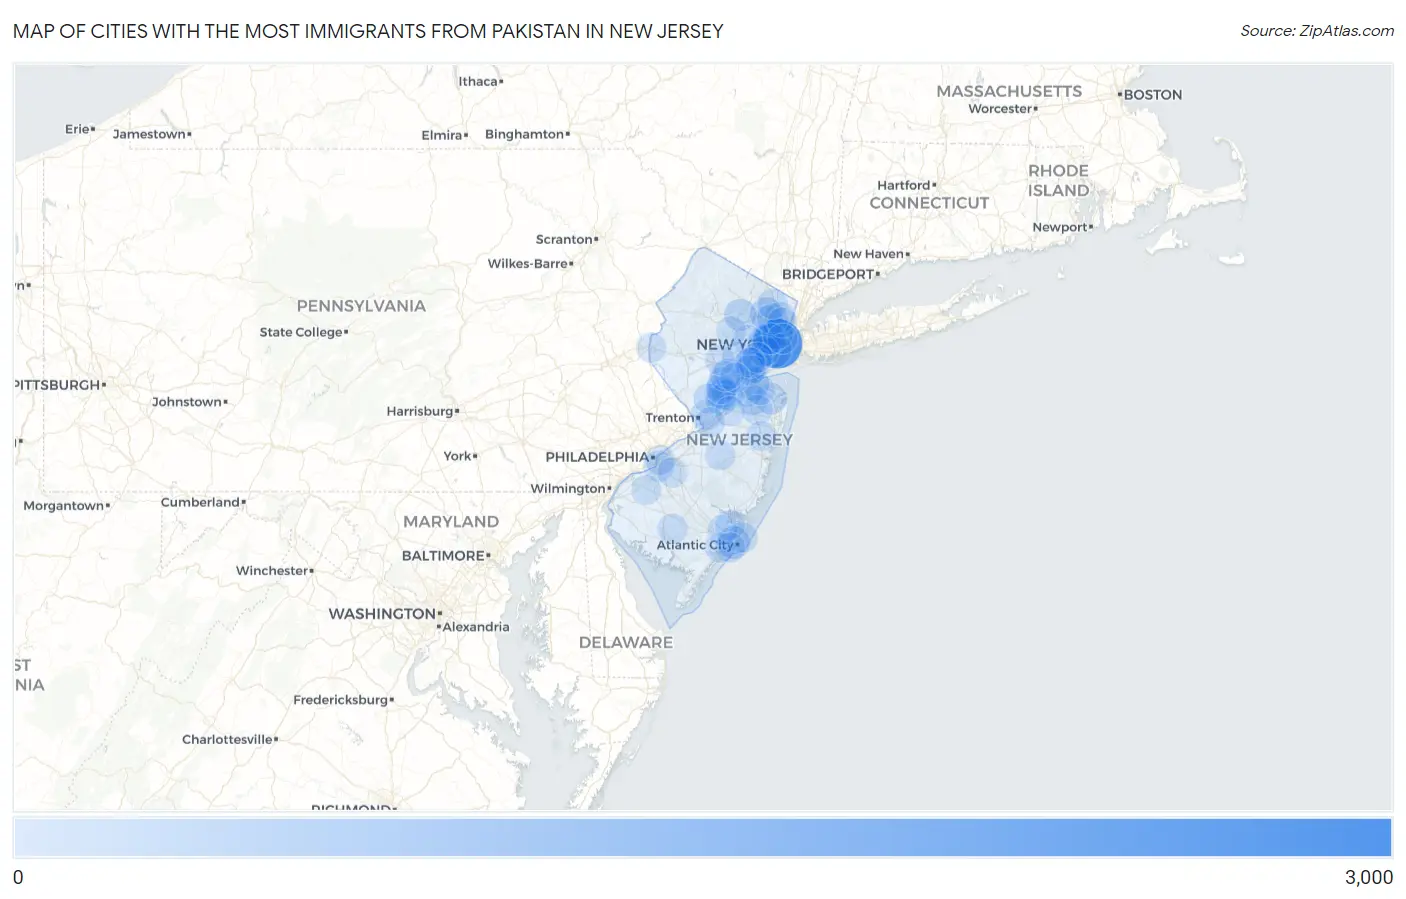
Map of Cities with the Most Immigrants from Pakistan in New Jersey
0
3,000
Cities with the Most Immigrants from Pakistan in New Jersey
| City | Pakistan | vs State | vs National | |
| 1. | Jersey City | 2,985 | 27,580(10.82%)#1 | 393,877(0.76%)#5 |
| 2. | Bayonne | 866 | 27,580(3.14%)#2 | 393,877(0.22%)#39 |
| 3. | Carteret Borough | 649 | 27,580(2.35%)#3 | 393,877(0.16%)#65 |
| 4. | Sayreville Borough | 566 | 27,580(2.05%)#4 | 393,877(0.14%)#87 |
| 5. | Madison Park | 450 | 27,580(1.63%)#5 | 393,877(0.11%)#116 |
| 6. | Newark | 438 | 27,580(1.59%)#6 | 393,877(0.11%)#119 |
| 7. | Atlantic City | 422 | 27,580(1.53%)#7 | 393,877(0.11%)#123 |
| 8. | Paterson | 420 | 27,580(1.52%)#8 | 393,877(0.11%)#125 |
| 9. | Franklin Park | 394 | 27,580(1.43%)#9 | 393,877(0.10%)#138 |
| 10. | Iselin | 342 | 27,580(1.24%)#10 | 393,877(0.09%)#178 |
| 11. | Paramus Borough | 332 | 27,580(1.20%)#11 | 393,877(0.08%)#184 |
| 12. | Boonton | 322 | 27,580(1.17%)#12 | 393,877(0.08%)#191 |
| 13. | Bellmawr Borough | 318 | 27,580(1.15%)#13 | 393,877(0.08%)#192 |
| 14. | Avenel | 308 | 27,580(1.12%)#14 | 393,877(0.08%)#204 |
| 15. | Lincroft | 229 | 27,580(0.83%)#15 | 393,877(0.06%)#284 |
| 16. | Woodbridge | 217 | 27,580(0.79%)#16 | 393,877(0.06%)#309 |
| 17. | Heathcote | 215 | 27,580(0.78%)#17 | 393,877(0.05%)#312 |
| 18. | Harrison | 214 | 27,580(0.78%)#18 | 393,877(0.05%)#315 |
| 19. | South Plainfield Borough | 210 | 27,580(0.76%)#19 | 393,877(0.05%)#324 |
| 20. | Monmouth Junction | 210 | 27,580(0.76%)#20 | 393,877(0.05%)#326 |
| 21. | Parsippany | 197 | 27,580(0.71%)#21 | 393,877(0.05%)#353 |
| 22. | Edgewater Borough | 196 | 27,580(0.71%)#22 | 393,877(0.05%)#354 |
| 23. | Lodi Borough | 195 | 27,580(0.71%)#23 | 393,877(0.05%)#357 |
| 24. | Clifton | 174 | 27,580(0.63%)#24 | 393,877(0.04%)#406 |
| 25. | Palisades Park Borough | 170 | 27,580(0.62%)#25 | 393,877(0.04%)#420 |
| 26. | Gloucester City | 170 | 27,580(0.62%)#26 | 393,877(0.04%)#422 |
| 27. | Secaucus | 169 | 27,580(0.61%)#27 | 393,877(0.04%)#427 |
| 28. | Plainfield | 162 | 27,580(0.59%)#28 | 393,877(0.04%)#441 |
| 29. | Hackensack | 162 | 27,580(0.59%)#29 | 393,877(0.04%)#442 |
| 30. | North Plainfield Borough | 161 | 27,580(0.58%)#30 | 393,877(0.04%)#446 |
| 31. | Hillsborough | 158 | 27,580(0.57%)#31 | 393,877(0.04%)#456 |
| 32. | Dayton | 156 | 27,580(0.57%)#32 | 393,877(0.04%)#462 |
| 33. | Garfield | 155 | 27,580(0.56%)#33 | 393,877(0.04%)#465 |
| 34. | Old Bridge | 153 | 27,580(0.55%)#34 | 393,877(0.04%)#467 |
| 35. | Elizabeth | 138 | 27,580(0.50%)#35 | 393,877(0.04%)#510 |
| 36. | Robertsville | 134 | 27,580(0.49%)#36 | 393,877(0.03%)#524 |
| 37. | Princeton Meadows | 130 | 27,580(0.47%)#37 | 393,877(0.03%)#537 |
| 38. | Fords | 130 | 27,580(0.47%)#38 | 393,877(0.03%)#538 |
| 39. | Somerset | 129 | 27,580(0.47%)#39 | 393,877(0.03%)#542 |
| 40. | Elmwood Park Borough | 124 | 27,580(0.45%)#40 | 393,877(0.03%)#553 |
| 41. | Fort Lee Borough | 122 | 27,580(0.44%)#41 | 393,877(0.03%)#562 |
| 42. | Highland Park Borough | 117 | 27,580(0.42%)#42 | 393,877(0.03%)#591 |
| 43. | Menlo Park Terrace | 115 | 27,580(0.42%)#43 | 393,877(0.03%)#602 |
| 44. | Bergenfield Borough | 114 | 27,580(0.41%)#44 | 393,877(0.03%)#605 |
| 45. | Kearny | 109 | 27,580(0.40%)#45 | 393,877(0.03%)#621 |
| 46. | Preakness | 106 | 27,580(0.38%)#46 | 393,877(0.03%)#630 |
| 47. | Mercerville | 105 | 27,580(0.38%)#47 | 393,877(0.03%)#636 |
| 48. | Westville Borough | 103 | 27,580(0.37%)#48 | 393,877(0.03%)#649 |
| 49. | Ridgefield Borough | 98 | 27,580(0.36%)#49 | 393,877(0.02%)#671 |
| 50. | Ridgewood | 95 | 27,580(0.34%)#50 | 393,877(0.02%)#687 |
| 51. | Princeton | 92 | 27,580(0.33%)#51 | 393,877(0.02%)#698 |
| 52. | Brigantine | 90 | 27,580(0.33%)#52 | 393,877(0.02%)#720 |
| 53. | Northvale Borough | 90 | 27,580(0.33%)#53 | 393,877(0.02%)#722 |
| 54. | Vineland | 87 | 27,580(0.32%)#54 | 393,877(0.02%)#740 |
| 55. | Barrington Borough | 79 | 27,580(0.29%)#55 | 393,877(0.02%)#802 |
| 56. | Middlesex Borough | 77 | 27,580(0.28%)#56 | 393,877(0.02%)#814 |
| 57. | Lakehurst Borough | 77 | 27,580(0.28%)#57 | 393,877(0.02%)#816 |
| 58. | Browns Mills | 73 | 27,580(0.26%)#58 | 393,877(0.02%)#847 |
| 59. | East Freehold | 72 | 27,580(0.26%)#59 | 393,877(0.02%)#857 |
| 60. | Glassboro Borough | 68 | 27,580(0.25%)#60 | 393,877(0.02%)#885 |
| 61. | Kendall Park | 66 | 27,580(0.24%)#61 | 393,877(0.02%)#903 |
| 62. | Short Hills | 64 | 27,580(0.23%)#62 | 393,877(0.02%)#926 |
| 63. | Lincoln Park Borough | 62 | 27,580(0.22%)#63 | 393,877(0.02%)#945 |
| 64. | Metuchen Borough | 60 | 27,580(0.22%)#64 | 393,877(0.02%)#957 |
| 65. | Silver Lake Cdp Essex County | 60 | 27,580(0.22%)#65 | 393,877(0.02%)#961 |
| 66. | Ridgefield Park | 59 | 27,580(0.21%)#66 | 393,877(0.01%)#967 |
| 67. | Sicklerville | 58 | 27,580(0.21%)#67 | 393,877(0.01%)#974 |
| 68. | Camden | 56 | 27,580(0.20%)#68 | 393,877(0.01%)#996 |
| 69. | Pomona | 56 | 27,580(0.20%)#69 | 393,877(0.01%)#1,002 |
| 70. | Twin Rivers | 55 | 27,580(0.20%)#70 | 393,877(0.01%)#1,011 |
| 71. | Echelon | 53 | 27,580(0.19%)#71 | 393,877(0.01%)#1,028 |
| 72. | Keansburg Borough | 53 | 27,580(0.19%)#72 | 393,877(0.01%)#1,029 |
| 73. | Flanders | 52 | 27,580(0.19%)#73 | 393,877(0.01%)#1,040 |
| 74. | Phillipsburg | 50 | 27,580(0.18%)#74 | 393,877(0.01%)#1,056 |
| 75. | Strathmore | 50 | 27,580(0.18%)#75 | 393,877(0.01%)#1,060 |
| 76. | Vauxhall | 48 | 27,580(0.17%)#76 | 393,877(0.01%)#1,078 |
| 77. | Mendham Borough | 48 | 27,580(0.17%)#77 | 393,877(0.01%)#1,079 |
| 78. | Harrington Park Borough | 48 | 27,580(0.17%)#78 | 393,877(0.01%)#1,080 |
| 79. | Middlebush | 48 | 27,580(0.17%)#79 | 393,877(0.01%)#1,082 |
| 80. | Morristown | 47 | 27,580(0.17%)#80 | 393,877(0.01%)#1,094 |
| 81. | New Milford Borough | 47 | 27,580(0.17%)#81 | 393,877(0.01%)#1,096 |
| 82. | River Edge Borough | 47 | 27,580(0.17%)#82 | 393,877(0.01%)#1,097 |
| 83. | Spotswood Borough | 47 | 27,580(0.17%)#83 | 393,877(0.01%)#1,101 |
| 84. | Linden | 46 | 27,580(0.17%)#84 | 393,877(0.01%)#1,105 |
| 85. | South River Borough | 46 | 27,580(0.17%)#85 | 393,877(0.01%)#1,110 |
| 86. | Martinsville | 46 | 27,580(0.17%)#86 | 393,877(0.01%)#1,115 |
| 87. | Hoboken | 43 | 27,580(0.16%)#87 | 393,877(0.01%)#1,145 |
| 88. | Smithville | 42 | 27,580(0.15%)#88 | 393,877(0.01%)#1,178 |
| 89. | Little Ferry Borough | 41 | 27,580(0.15%)#89 | 393,877(0.01%)#1,193 |
| 90. | Yardville | 40 | 27,580(0.15%)#90 | 393,877(0.01%)#1,206 |
| 91. | Lakewood | 39 | 27,580(0.14%)#91 | 393,877(0.01%)#1,214 |
| 92. | Woodland Park Borough | 39 | 27,580(0.14%)#92 | 393,877(0.01%)#1,223 |
| 93. | Watsessing | 39 | 27,580(0.14%)#93 | 393,877(0.01%)#1,225 |
| 94. | Linwood | 38 | 27,580(0.14%)#94 | 393,877(0.01%)#1,242 |
| 95. | Colonia | 37 | 27,580(0.13%)#95 | 393,877(0.01%)#1,251 |
| 96. | Midland Park Borough | 37 | 27,580(0.13%)#96 | 393,877(0.01%)#1,255 |
| 97. | Mullica Hill | 35 | 27,580(0.13%)#97 | 393,877(0.01%)#1,286 |
| 98. | Tenafly Borough | 34 | 27,580(0.12%)#98 | 393,877(0.01%)#1,301 |
| 99. | New Brunswick | 33 | 27,580(0.12%)#99 | 393,877(0.01%)#1,310 |
| 100. | Ventnor City | 33 | 27,580(0.12%)#100 | 393,877(0.01%)#1,319 |
Common Questions
What are the Top 10 Cities with the Most Immigrants from Pakistan in New Jersey?
Top 10 Cities with the Most Immigrants from Pakistan in New Jersey are:
#1
2,985
#2
866
#3
450
#4
438
#5
422
#6
420
#7
394
#8
342
#9
322
#10
308
What city has the Most Immigrants from Pakistan in New Jersey?
Jersey City has the Most Immigrants from Pakistan in New Jersey with 2,985.
What is the Total Immigrants from Pakistan in the State of New Jersey?
Total Immigrants from Pakistan in New Jersey is 27,580.
What is the Total Immigrants from Pakistan in the United States?
Total Immigrants from Pakistan in the United States is 393,877.