Cities with the Most Immigrants from Cambodia in the United States
RELATED REPORTS & OPTIONS
Cambodia
United States
Compare Cities
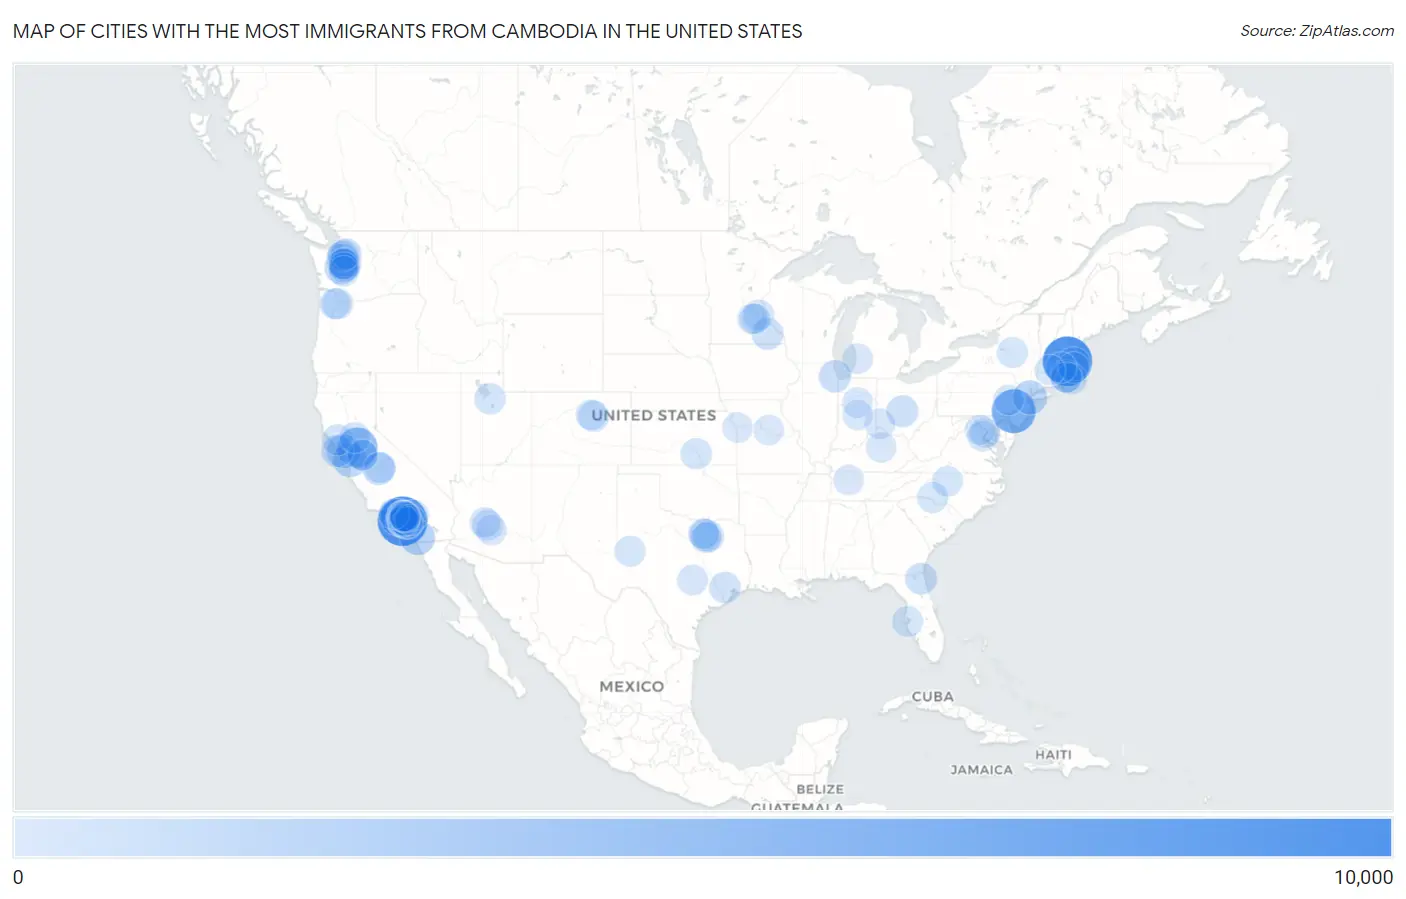
Map of Cities with the Most Immigrants from Cambodia in the United States
0
10,000
Cities with the Most Immigrants from Cambodia in the United States
| City | Cambodia | vs State | vs National | |
| 1. | Long Beach | 8,096 | 51,974(15.58%)#1 | 149,355(5.42%)#1 |
| 2. | Lowell | 8,032 | 14,305(56.15%)#1 | 149,355(5.38%)#2 |
| 3. | Philadelphia | 5,707 | 9,386(60.80%)#1 | 149,355(3.82%)#3 |
| 4. | Stockton | 4,126 | 51,974(7.94%)#2 | 149,355(2.76%)#4 |
| 5. | Los Angeles | 2,910 | 51,974(5.60%)#3 | 149,355(1.95%)#5 |
| 6. | San Diego | 2,030 | 51,974(3.91%)#4 | 149,355(1.36%)#6 |
| 7. | New York | 1,802 | 3,044(59.20%)#1 | 149,355(1.21%)#7 |
| 8. | San Jose | 1,795 | 51,974(3.45%)#5 | 149,355(1.20%)#8 |
| 9. | Oakland | 1,713 | 51,974(3.30%)#6 | 149,355(1.15%)#9 |
| 10. | Tacoma | 1,410 | 10,993(12.83%)#1 | 149,355(0.94%)#10 |
| 11. | Lynn | 1,367 | 14,305(9.56%)#2 | 149,355(0.92%)#11 |
| 12. | Lakewood | 1,242 | 51,974(2.39%)#7 | 149,355(0.83%)#12 |
| 13. | Fresno | 1,101 | 51,974(2.12%)#8 | 149,355(0.74%)#13 |
| 14. | Providence | 1,001 | 1,902(52.63%)#1 | 149,355(0.67%)#14 |
| 15. | Chicago | 993 | 3,065(32.40%)#1 | 149,355(0.66%)#15 |
| 16. | Modesto | 931 | 51,974(1.79%)#9 | 149,355(0.62%)#16 |
| 17. | San Francisco | 887 | 51,974(1.71%)#10 | 149,355(0.59%)#17 |
| 18. | Santa Ana | 881 | 51,974(1.70%)#11 | 149,355(0.59%)#18 |
| 19. | Seattle | 874 | 10,993(7.95%)#2 | 149,355(0.59%)#19 |
| 20. | Columbus | 817 | 2,620(31.18%)#1 | 149,355(0.55%)#20 |
| 21. | Jacksonville | 772 | 3,268(23.62%)#1 | 149,355(0.52%)#21 |
| 22. | Renton | 754 | 10,993(6.86%)#3 | 149,355(0.50%)#22 |
| 23. | Rochester | 744 | 4,264(17.45%)#1 | 149,355(0.50%)#23 |
| 24. | Houston | 647 | 9,997(6.47%)#1 | 149,355(0.43%)#24 |
| 25. | Kent | 633 | 10,993(5.76%)#4 | 149,355(0.42%)#25 |
| 26. | Anaheim | 623 | 51,974(1.20%)#12 | 149,355(0.42%)#26 |
| 27. | Bellflower | 610 | 51,974(1.17%)#13 | 149,355(0.41%)#27 |
| 28. | Carrollton | 578 | 9,997(5.78%)#2 | 149,355(0.39%)#28 |
| 29. | Alhambra | 575 | 51,974(1.11%)#14 | 149,355(0.38%)#29 |
| 30. | West Valley City | 565 | 1,529(36.95%)#1 | 149,355(0.38%)#30 |
| 31. | Burien | 560 | 10,993(5.09%)#5 | 149,355(0.37%)#31 |
| 32. | Aurora | 555 | 1,936(28.67%)#1 | 149,355(0.37%)#32 |
| 33. | Wichita | 548 | 688(79.65%)#1 | 149,355(0.37%)#33 |
| 34. | Rosemead | 540 | 51,974(1.04%)#15 | 149,355(0.36%)#34 |
| 35. | Monterey Park | 535 | 51,974(1.03%)#16 | 149,355(0.36%)#35 |
| 36. | Fall River | 526 | 14,305(3.68%)#3 | 149,355(0.35%)#36 |
| 37. | Santa Rosa | 518 | 51,974(1.00%)#17 | 149,355(0.35%)#37 |
| 38. | Garden Grove | 514 | 51,974(0.99%)#18 | 149,355(0.34%)#38 |
| 39. | Clovis | 501 | 51,974(0.96%)#19 | 149,355(0.34%)#39 |
| 40. | Westminster | 498 | 51,974(0.96%)#20 | 149,355(0.33%)#40 |
| 41. | El Monte | 491 | 51,974(0.94%)#21 | 149,355(0.33%)#41 |
| 42. | Portland | 490 | 2,330(21.03%)#1 | 149,355(0.33%)#42 |
| 43. | Norwalk | 481 | 51,974(0.93%)#22 | 149,355(0.32%)#43 |
| 44. | Sacramento | 453 | 51,974(0.87%)#23 | 149,355(0.30%)#44 |
| 45. | Signal Hill | 452 | 51,974(0.87%)#24 | 149,355(0.30%)#45 |
| 46. | Boston | 448 | 14,305(3.13%)#4 | 149,355(0.30%)#46 |
| 47. | Charlotte | 444 | 2,583(17.19%)#1 | 149,355(0.30%)#47 |
| 48. | Midland | 435 | 9,997(4.35%)#3 | 149,355(0.29%)#48 |
| 49. | Utica | 427 | 3,044(14.03%)#2 | 149,355(0.29%)#49 |
| 50. | San Gabriel | 421 | 51,974(0.81%)#25 | 149,355(0.28%)#50 |
| 51. | Garland | 414 | 9,997(4.14%)#4 | 149,355(0.28%)#51 |
| 52. | Martha Lake | 414 | 10,993(3.77%)#6 | 149,355(0.28%)#52 |
| 53. | Pomona | 411 | 51,974(0.79%)#26 | 149,355(0.28%)#53 |
| 54. | Aloha | 409 | 2,330(17.55%)#2 | 149,355(0.27%)#54 |
| 55. | St Petersburg | 401 | 3,268(12.27%)#2 | 149,355(0.27%)#55 |
| 56. | St Paul | 385 | 4,264(9.03%)#2 | 149,355(0.26%)#56 |
| 57. | Everett | 370 | 10,993(3.37%)#7 | 149,355(0.25%)#57 |
| 58. | Dallas | 362 | 9,997(3.62%)#5 | 149,355(0.24%)#58 |
| 59. | Greensboro | 354 | 2,583(13.70%)#2 | 149,355(0.24%)#59 |
| 60. | Cranston | 354 | 1,902(18.61%)#2 | 149,355(0.24%)#60 |
| 61. | Shakopee | 354 | 4,264(8.30%)#3 | 149,355(0.24%)#61 |
| 62. | Austin | 349 | 9,997(3.49%)#6 | 149,355(0.23%)#62 |
| 63. | Worcester | 342 | 14,305(2.39%)#5 | 149,355(0.23%)#63 |
| 64. | Lynnwood | 340 | 10,993(3.09%)#8 | 149,355(0.23%)#64 |
| 65. | Phoenix | 333 | 1,716(19.41%)#1 | 149,355(0.22%)#65 |
| 66. | Allentown | 331 | 9,386(3.53%)#2 | 149,355(0.22%)#66 |
| 67. | Seatac | 330 | 10,993(3.00%)#9 | 149,355(0.22%)#67 |
| 68. | Chicopee | 326 | 14,305(2.28%)#6 | 149,355(0.22%)#68 |
| 69. | Buena Park | 325 | 51,974(0.63%)#27 | 149,355(0.22%)#69 |
| 70. | Chandler | 317 | 1,716(18.47%)#2 | 149,355(0.21%)#70 |
| 71. | Irvine | 314 | 51,974(0.60%)#28 | 149,355(0.21%)#71 |
| 72. | Hacienda Heights | 307 | 51,974(0.59%)#29 | 149,355(0.21%)#72 |
| 73. | Denver | 305 | 1,936(15.75%)#2 | 149,355(0.20%)#73 |
| 74. | Cerritos | 301 | 51,974(0.58%)#30 | 149,355(0.20%)#74 |
| 75. | Holland | 293 | 1,657(17.68%)#1 | 149,355(0.20%)#75 |
| 76. | South Hill | 284 | 10,993(2.58%)#10 | 149,355(0.19%)#76 |
| 77. | San Bernardino | 283 | 51,974(0.54%)#31 | 149,355(0.19%)#77 |
| 78. | Ceres | 278 | 51,974(0.53%)#32 | 149,355(0.19%)#78 |
| 79. | Dale City | 273 | 4,747(5.75%)#1 | 149,355(0.18%)#79 |
| 80. | Savage | 273 | 4,264(6.40%)#4 | 149,355(0.18%)#80 |
| 81. | Tustin | 272 | 51,974(0.52%)#33 | 149,355(0.18%)#81 |
| 82. | Auburn | 267 | 10,993(2.43%)#11 | 149,355(0.18%)#82 |
| 83. | Cypress | 265 | 51,974(0.51%)#34 | 149,355(0.18%)#83 |
| 84. | Nashville | 264 | 792(33.33%)#1 | 149,355(0.18%)#84 |
| 85. | The Colony | 262 | 9,997(2.62%)#7 | 149,355(0.18%)#85 |
| 86. | Simi Valley | 261 | 51,974(0.50%)#35 | 149,355(0.17%)#86 |
| 87. | Kansas City | 260 | 764(34.03%)#1 | 149,355(0.17%)#87 |
| 88. | Annandale | 260 | 4,747(5.48%)#2 | 149,355(0.17%)#88 |
| 89. | Fairfield | 255 | 2,620(9.73%)#2 | 149,355(0.17%)#89 |
| 90. | Columbia | 253 | 764(33.12%)#2 | 149,355(0.17%)#90 |
| 91. | Lansdale Borough | 253 | 9,386(2.70%)#3 | 149,355(0.17%)#91 |
| 92. | Kokomo | 252 | 915(27.54%)#1 | 149,355(0.17%)#92 |
| 93. | Temple City | 252 | 51,974(0.48%)#36 | 149,355(0.17%)#93 |
| 94. | Corona | 251 | 51,974(0.48%)#37 | 149,355(0.17%)#94 |
| 95. | West Covina | 251 | 51,974(0.48%)#38 | 149,355(0.17%)#95 |
| 96. | Lexington | 249 | 1,031(24.15%)#1 | 149,355(0.17%)#96 |
| 97. | Baldwin Park | 247 | 51,974(0.48%)#39 | 149,355(0.17%)#97 |
| 98. | Indianapolis | 239 | 915(26.12%)#2 | 149,355(0.16%)#98 |
| 99. | Peoria | 237 | 1,716(13.81%)#3 | 149,355(0.16%)#99 |
| 100. | Brambleton | 236 | 4,747(4.97%)#3 | 149,355(0.16%)#100 |
Common Questions
What are the Top 10 Cities with the Most Immigrants from Cambodia in the United States?
Top 10 Cities with the Most Immigrants from Cambodia in the United States are:
What city has the Most Immigrants from Cambodia in the United States?
Long Beach has the Most Immigrants from Cambodia in the United States with 8,096.
What is the Total Immigrants from Cambodia in the United States?
Total Immigrants from Cambodia in the United States is 149,355.