Cities with the Most Immigrants from Argentina in Georgia
RELATED REPORTS & OPTIONS
Argentina
Georgia
Compare Cities
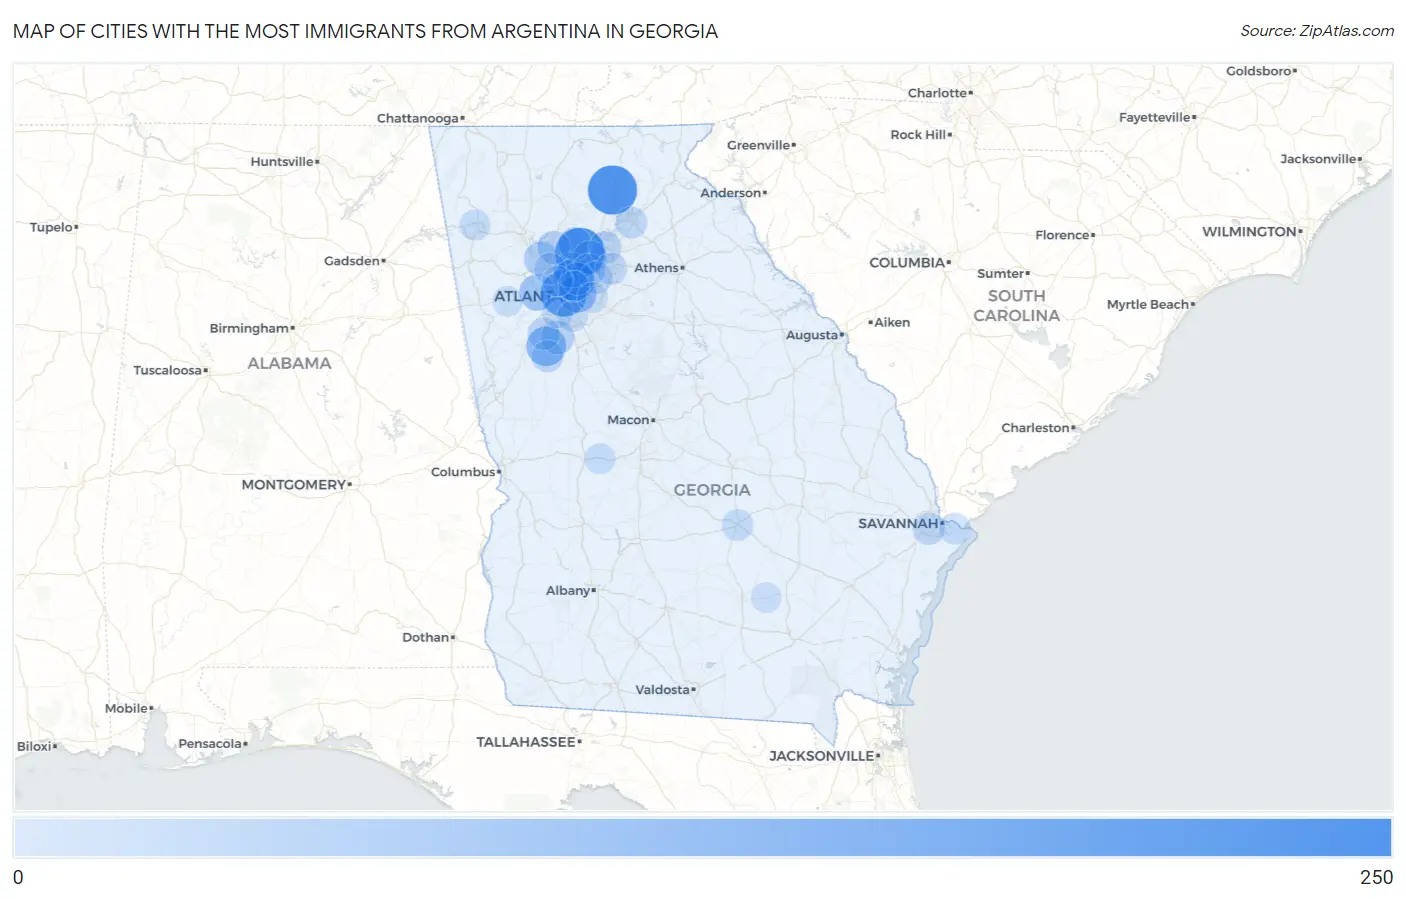
Map of Cities with the Most Immigrants from Argentina in Georgia
0
250
Cities with the Most Immigrants from Argentina in Georgia
| City | Argentina | vs State | vs National | |
| 1. | Alpharetta | 228 | 2,961(7.70%)#1 | 200,110(0.11%)#121 |
| 2. | Dahlonega | 224 | 2,961(7.57%)#2 | 200,110(0.11%)#128 |
| 3. | Atlanta | 185 | 2,961(6.25%)#3 | 200,110(0.09%)#170 |
| 4. | Brookhaven | 140 | 2,961(4.73%)#4 | 200,110(0.07%)#232 |
| 5. | Athens-Clarke County Unified Government (Balance) | 118 | 2,961(3.99%)#5 | 200,110(0.06%)#284 |
| 6. | Peachtree City | 110 | 2,961(3.71%)#6 | 200,110(0.05%)#304 |
| 7. | Decatur | 90 | 2,961(3.04%)#7 | 200,110(0.04%)#384 |
| 8. | Lithia Springs | 73 | 2,961(2.47%)#8 | 200,110(0.04%)#473 |
| 9. | Sandy Springs | 57 | 2,961(1.93%)#9 | 200,110(0.03%)#593 |
| 10. | Kennesaw | 51 | 2,961(1.72%)#10 | 200,110(0.03%)#658 |
| 11. | Fayetteville | 39 | 2,961(1.32%)#11 | 200,110(0.02%)#799 |
| 12. | Johns Creek | 38 | 2,961(1.28%)#12 | 200,110(0.02%)#809 |
| 13. | Woodstock | 34 | 2,961(1.15%)#13 | 200,110(0.02%)#888 |
| 14. | Milton | 32 | 2,961(1.08%)#14 | 200,110(0.02%)#921 |
| 15. | Norcross | 30 | 2,961(1.01%)#15 | 200,110(0.01%)#974 |
| 16. | Sugar Hill | 28 | 2,961(0.95%)#16 | 200,110(0.01%)#1,016 |
| 17. | Lilburn | 28 | 2,961(0.95%)#17 | 200,110(0.01%)#1,019 |
| 18. | Chamblee | 26 | 2,961(0.88%)#18 | 200,110(0.01%)#1,048 |
| 19. | Savannah | 24 | 2,961(0.81%)#19 | 200,110(0.01%)#1,103 |
| 20. | Tyrone | 24 | 2,961(0.81%)#20 | 200,110(0.01%)#1,124 |
| 21. | Augusta-Richmond County Consolidated Government (Balance) | 22 | 2,961(0.74%)#21 | 200,110(0.01%)#1,164 |
| 22. | Senoia | 22 | 2,961(0.74%)#22 | 200,110(0.01%)#1,192 |
| 23. | Gainesville | 20 | 2,961(0.68%)#23 | 200,110(0.01%)#1,241 |
| 24. | Lawrenceville | 19 | 2,961(0.64%)#24 | 200,110(0.01%)#1,272 |
| 25. | Marietta | 18 | 2,961(0.61%)#25 | 200,110(0.01%)#1,300 |
| 26. | Mcrae Helena | 17 | 2,961(0.57%)#26 | 200,110(0.01%)#1,368 |
| 27. | Talahi Island | 16 | 2,961(0.54%)#27 | 200,110(0.01%)#1,409 |
| 28. | College Park | 13 | 2,961(0.44%)#28 | 200,110(0.01%)#1,536 |
| 29. | Rome | 12 | 2,961(0.41%)#29 | 200,110(0.01%)#1,562 |
| 30. | Reynolds | 12 | 2,961(0.41%)#30 | 200,110(0.01%)#1,605 |
| 31. | North Druid Hills | 9 | 2,961(0.30%)#31 | 200,110(0.00%)#1,753 |
| 32. | Lake City | 7 | 2,961(0.24%)#32 | 200,110(0.00%)#1,895 |
| 33. | Redan | 6 | 2,961(0.20%)#33 | 200,110(0.00%)#1,923 |
| 34. | Nicholls | 5 | 2,961(0.17%)#34 | 200,110(0.00%)#1,998 |
| 35. | Vinings | 4 | 2,961(0.14%)#35 | 200,110(0.00%)#2,029 |
| 36. | Villa Rica | 2 | 2,961(0.07%)#36 | 200,110(0.00%)#2,111 |
Common Questions
What are the Top 10 Cities with the Most Immigrants from Argentina in Georgia?
Top 10 Cities with the Most Immigrants from Argentina in Georgia are:
#1
228
#2
224
#3
185
#4
140
#5
110
#6
90
#7
73
#8
57
#9
51
#10
39
What city has the Most Immigrants from Argentina in Georgia?
Alpharetta has the Most Immigrants from Argentina in Georgia with 228.
What is the Total Immigrants from Argentina in the State of Georgia?
Total Immigrants from Argentina in Georgia is 2,961.
What is the Total Immigrants from Argentina in the United States?
Total Immigrants from Argentina in the United States is 200,110.