Cities with the Highest Percentage of Immigrants from Venezuela in North Carolina
RELATED REPORTS & OPTIONS
Venezuela
North Carolina
Compare Cities
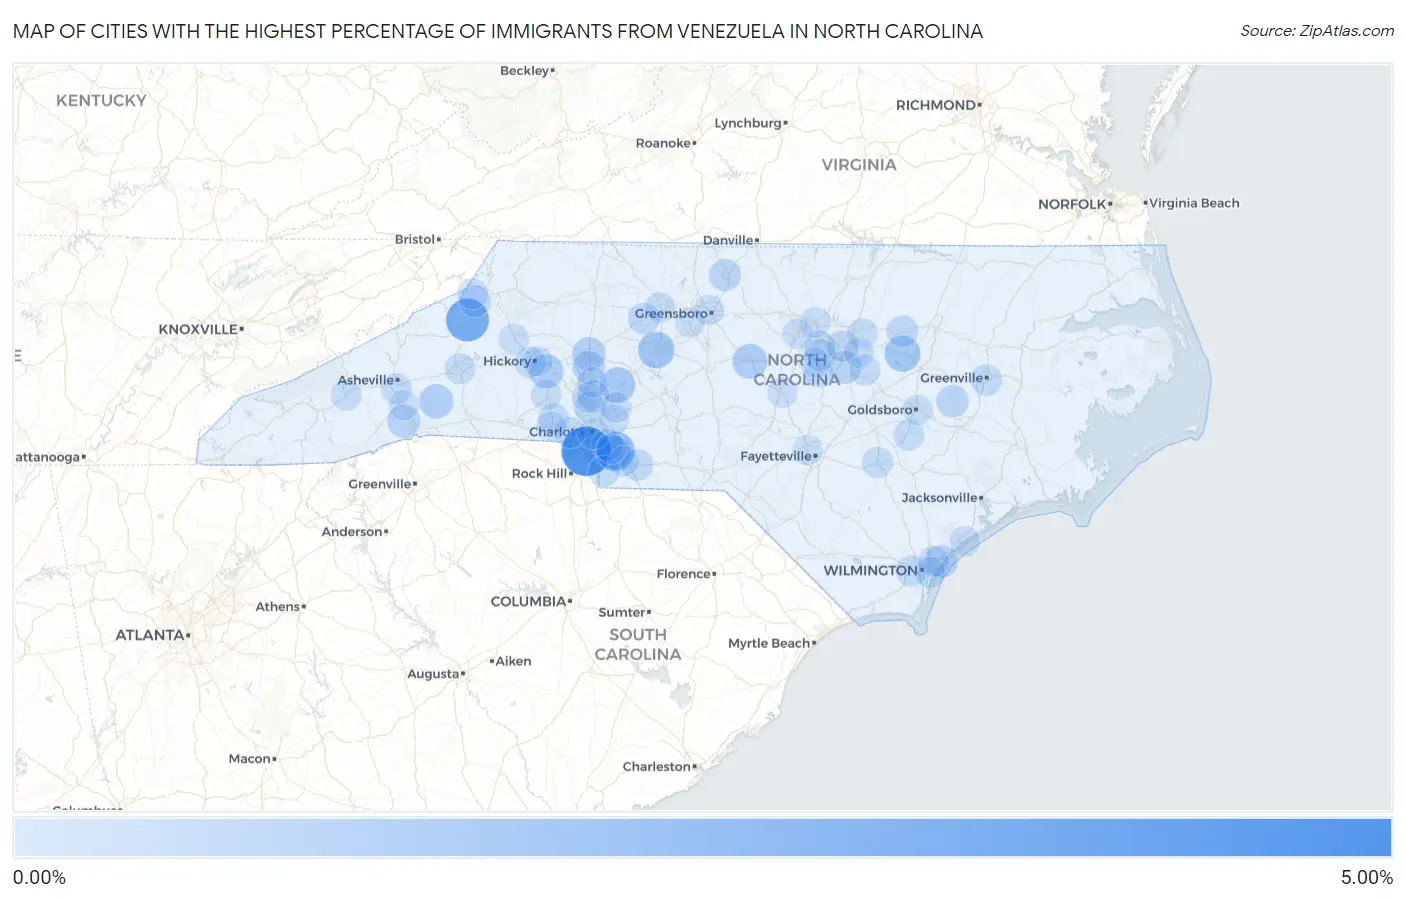
Map of Cities with the Highest Percentage of Immigrants from Venezuela in North Carolina
0.00%
5.00%
Cities with the Highest Percentage of Immigrants from Venezuela in North Carolina
| City | Venezuela | vs State | vs National | |
| 1. | Pineville | 4.43% | 0.095%(+4.34)#2 | 0.16%(+4.28)#366 |
| 2. | Crossnore | 2.88% | 0.095%(+2.78)#9 | 0.16%(+2.72)#890 |
| 3. | Lake Park | 2.06% | 0.095%(+1.97)#10 | 0.16%(+1.91)#891 |
| 4. | Lexington | 1.39% | 0.095%(+1.30)#11 | 0.16%(+1.24)#892 |
| 5. | Bailey | 1.31% | 0.095%(+1.21)#50 | 0.16%(+1.15)#2,161 |
| 6. | Landis | 1.17% | 0.095%(+1.08)#58 | 0.16%(+1.02)#2,410 |
| 7. | Siler City | 1.03% | 0.095%(+0.937)#59 | 0.16%(+0.875)#2,411 |
| 8. | Indian Trail | 0.99% | 0.095%(+0.892)#60 | 0.16%(+0.830)#2,412 |
| 9. | Newton | 0.94% | 0.095%(+0.846)#61 | 0.16%(+0.785)#2,413 |
| 10. | Lake Lure | 0.89% | 0.095%(+0.794)#62 | 0.16%(+0.732)#2,414 |
| 11. | Statesville | 0.75% | 0.095%(+0.650)#63 | 0.16%(+0.589)#2,415 |
| 12. | Troutman | 0.62% | 0.095%(+0.528)#74 | 0.16%(+0.467)#2,810 |
| 13. | Valley Hill | 0.62% | 0.095%(+0.525)#123 | 0.16%(+0.464)#3,991 |
| 14. | Porters Neck | 0.60% | 0.095%(+0.505)#124 | 0.16%(+0.443)#3,992 |
| 15. | Snow Hill | 0.53% | 0.095%(+0.430)#140 | 0.16%(+0.369)#4,367 |
| 16. | Garner | 0.52% | 0.095%(+0.429)#141 | 0.16%(+0.367)#4,368 |
| 17. | Reidsville | 0.45% | 0.095%(+0.352)#155 | 0.16%(+0.291)#4,752 |
| 18. | Banner Elk | 0.41% | 0.095%(+0.310)#167 | 0.16%(+0.248)#4,993 |
| 19. | Davidson | 0.36% | 0.095%(+0.260)#168 | 0.16%(+0.199)#4,994 |
| 20. | Clemmons | 0.35% | 0.095%(+0.257)#169 | 0.16%(+0.196)#4,995 |
| 21. | Spring Hope | 0.35% | 0.095%(+0.252)#170 | 0.16%(+0.190)#4,996 |
| 22. | Wingate | 0.34% | 0.095%(+0.249)#171 | 0.16%(+0.188)#4,997 |
| 23. | Greenville | 0.33% | 0.095%(+0.231)#172 | 0.16%(+0.170)#4,998 |
| 24. | Cary | 0.31% | 0.095%(+0.219)#173 | 0.16%(+0.158)#4,999 |
| 25. | Brandywine Bay | 0.30% | 0.095%(+0.203)#174 | 0.16%(+0.142)#5,000 |
| 26. | Long View | 0.30% | 0.095%(+0.203)#175 | 0.16%(+0.141)#5,001 |
| 27. | Raleigh | 0.28% | 0.095%(+0.183)#176 | 0.16%(+0.121)#5,002 |
| 28. | Matthews | 0.27% | 0.095%(+0.178)#177 | 0.16%(+0.117)#5,003 |
| 29. | Huntersville | 0.27% | 0.095%(+0.176)#178 | 0.16%(+0.114)#5,004 |
| 30. | Marion | 0.25% | 0.095%(+0.153)#203 | 0.16%(+0.092)#6,105 |
| 31. | Clinton | 0.24% | 0.095%(+0.144)#204 | 0.16%(+0.082)#6,106 |
| 32. | Belmont | 0.24% | 0.095%(+0.140)#205 | 0.16%(+0.079)#6,107 |
| 33. | Clayton | 0.23% | 0.095%(+0.132)#206 | 0.16%(+0.071)#6,108 |
| 34. | Leland | 0.22% | 0.095%(+0.129)#207 | 0.16%(+0.068)#6,109 |
| 35. | Charlotte | 0.22% | 0.095%(+0.127)#208 | 0.16%(+0.065)#6,110 |
| 36. | Waxhaw | 0.22% | 0.095%(+0.122)#209 | 0.16%(+0.061)#6,111 |
| 37. | Mount Olive | 0.21% | 0.095%(+0.115)#210 | 0.16%(+0.053)#6,112 |
| 38. | Asheville | 0.20% | 0.095%(+0.106)#211 | 0.16%(+0.045)#6,113 |
| 39. | Dallas | 0.19% | 0.095%(+0.091)#212 | 0.16%(+0.030)#6,114 |
| 40. | Waynesville | 0.18% | 0.095%(+0.089)#213 | 0.16%(+0.028)#6,115 |
| 41. | Rolesville | 0.17% | 0.095%(+0.070)#214 | 0.16%(+0.008)#6,116 |
| 42. | Murraysville | 0.16% | 0.095%(+0.061)#215 | 0.16%(-0.001)#6,117 |
| 43. | Harrisburg | 0.14% | 0.095%(+0.047)#216 | 0.16%(-0.014)#6,118 |
| 44. | Wilmington | 0.13% | 0.095%(+0.035)#217 | 0.16%(-0.026)#6,119 |
| 45. | Concord | 0.13% | 0.095%(+0.035)#218 | 0.16%(-0.027)#6,120 |
| 46. | Morrisville | 0.13% | 0.095%(+0.032)#219 | 0.16%(-0.029)#6,862 |
| 47. | Beech Mountain | 0.13% | 0.095%(+0.030)#220 | 0.16%(-0.031)#6,863 |
| 48. | Lincolnton | 0.12% | 0.095%(+0.020)#221 | 0.16%(-0.041)#6,864 |
| 49. | Surf City | 0.10% | 0.095%(+0.008)#225 | 0.16%(-0.054)#7,390 |
| 50. | Lenoir | 0.098% | 0.095%(+0.003)#226 | 0.16%(-0.058)#7,391 |
| 51. | Winston Salem | 0.094% | 0.095%(-0.002)#227 | 0.16%(-0.063)#7,392 |
| 52. | Monroe | 0.080% | 0.095%(-0.015)#228 | 0.16%(-0.077)#7,393 |
| 53. | Durham | 0.078% | 0.095%(-0.017)#229 | 0.16%(-0.079)#7,394 |
| 54. | Fletcher | 0.075% | 0.095%(-0.020)#230 | 0.16%(-0.082)#7,395 |
| 55. | Cornelius | 0.064% | 0.095%(-0.032)#231 | 0.16%(-0.093)#7,396 |
| 56. | Chapel Hill | 0.063% | 0.095%(-0.033)#232 | 0.16%(-0.094)#7,397 |
| 57. | Holly Springs | 0.055% | 0.095%(-0.041)#233 | 0.16%(-0.102)#7,398 |
| 58. | Fayetteville | 0.054% | 0.095%(-0.041)#234 | 0.16%(-0.103)#7,399 |
| 59. | Mooresville | 0.054% | 0.095%(-0.041)#235 | 0.16%(-0.103)#7,400 |
| 60. | Greensboro | 0.047% | 0.095%(-0.048)#236 | 0.16%(-0.109)#7,401 |
| 61. | Sanford | 0.040% | 0.095%(-0.056)#237 | 0.16%(-0.117)#7,402 |
| 62. | Goldsboro | 0.039% | 0.095%(-0.057)#238 | 0.16%(-0.118)#7,403 |
| 63. | High Point | 0.037% | 0.095%(-0.059)#239 | 0.16%(-0.120)#7,404 |
| 64. | Knightdale | 0.031% | 0.095%(-0.064)#240 | 0.16%(-0.125)#7,405 |
| 65. | Gastonia | 0.029% | 0.095%(-0.067)#241 | 0.16%(-0.128)#7,406 |
| 66. | Apex | 0.026% | 0.095%(-0.069)#242 | 0.16%(-0.131)#7,407 |
| 67. | Hickory | 0.014% | 0.095%(-0.082)#243 | 0.16%(-0.143)#7,408 |
| 68. | Stallings | 0.012% | 0.095%(-0.083)#244 | 0.16%(-0.144)#7,409 |
Common Questions
What are the Top 10 Cities with the Highest Percentage of Immigrants from Venezuela in North Carolina?
Top 10 Cities with the Highest Percentage of Immigrants from Venezuela in North Carolina are:
#1
4.43%
#2
2.88%
#3
2.06%
#4
1.39%
#5
1.31%
#6
1.17%
#7
1.03%
#8
0.99%
#9
0.94%
#10
0.89%
What city has the Highest Percentage of Immigrants from Venezuela in North Carolina?
Pineville has the Highest Percentage of Immigrants from Venezuela in North Carolina with 4.43%.
What is the Percentage of Immigrants from Venezuela in the State of North Carolina?
Percentage of Immigrants from Venezuela in North Carolina is 0.095%.
What is the Percentage of Immigrants from Venezuela in the United States?
Percentage of Immigrants from Venezuela in the United States is 0.16%.