Cities with the Highest Percentage of Immigrants from Venezuela in New York
RELATED REPORTS & OPTIONS
Venezuela
New York
Compare Cities
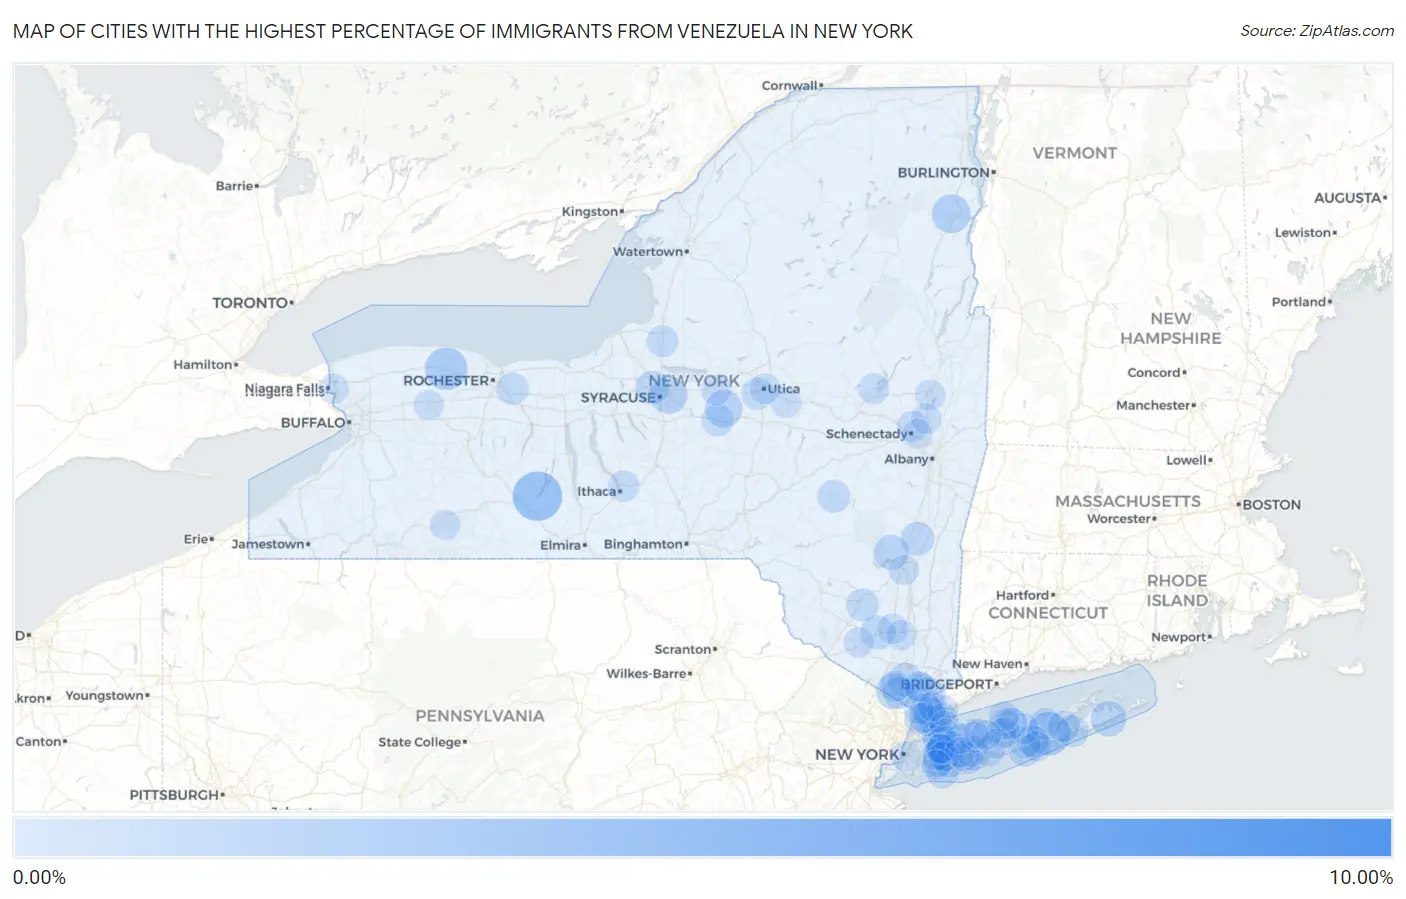
Map of Cities with the Highest Percentage of Immigrants from Venezuela in New York
0.00%
10.00%
Cities with the Highest Percentage of Immigrants from Venezuela in New York
| City | Venezuela | vs State | vs National | |
| 1. | Mountain Dale | 8.46% | 0.098%(+8.36)#26 | 0.16%(+8.30)#194 |
| 2. | Hammondsport | 3.16% | 0.098%(+3.07)#130 | 0.16%(+3.01)#790 |
| 3. | Shorehaven | 2.53% | 0.098%(+2.43)#166 | 0.16%(+2.37)#1,029 |
| 4. | Eastport | 2.20% | 0.098%(+2.10)#167 | 0.16%(+2.04)#1,030 |
| 5. | Holley | 2.02% | 0.098%(+1.92)#209 | 0.16%(+1.87)#1,375 |
| 6. | Bard College | 1.45% | 0.098%(+1.35)#220 | 0.16%(+1.29)#1,469 |
| 7. | Elizabethtown | 1.45% | 0.098%(+1.35)#274 | 0.16%(+1.29)#1,964 |
| 8. | East Syracuse | 1.27% | 0.098%(+1.17)#299 | 0.16%(+1.12)#2,216 |
| 9. | Munnsville | 1.24% | 0.098%(+1.15)#304 | 0.16%(+1.09)#2,267 |
| 10. | Hawthorne | 0.96% | 0.098%(+0.861)#305 | 0.16%(+0.802)#2,268 |
| 11. | Viola | 0.95% | 0.098%(+0.850)#359 | 0.16%(+0.791)#2,890 |
| 12. | East Hampton | 0.94% | 0.098%(+0.847)#360 | 0.16%(+0.788)#2,891 |
| 13. | Woodstock | 0.87% | 0.098%(+0.772)#361 | 0.16%(+0.713)#2,892 |
| 14. | Munsey Park | 0.75% | 0.098%(+0.654)#362 | 0.16%(+0.595)#2,893 |
| 15. | West Haverstraw | 0.75% | 0.098%(+0.653)#363 | 0.16%(+0.594)#2,894 |
| 16. | Montgomery | 0.71% | 0.098%(+0.613)#364 | 0.16%(+0.554)#2,895 |
| 17. | Searingtown | 0.68% | 0.098%(+0.583)#365 | 0.16%(+0.524)#2,896 |
| 18. | Germantown | 0.66% | 0.098%(+0.557)#421 | 0.16%(+0.499)#3,853 |
| 19. | Liverpool | 0.64% | 0.098%(+0.545)#422 | 0.16%(+0.487)#3,854 |
| 20. | Bellport | 0.60% | 0.098%(+0.498)#423 | 0.16%(+0.440)#3,870 |
| 21. | Ellenville | 0.55% | 0.098%(+0.448)#424 | 0.16%(+0.389)#3,871 |
| 22. | Hempstead | 0.53% | 0.098%(+0.429)#425 | 0.16%(+0.371)#3,872 |
| 23. | Baxter Estates | 0.52% | 0.098%(+0.424)#426 | 0.16%(+0.366)#3,873 |
| 24. | Stamford | 0.52% | 0.098%(+0.421)#452 | 0.16%(+0.363)#4,387 |
| 25. | Morrisville | 0.46% | 0.098%(+0.360)#453 | 0.16%(+0.302)#4,388 |
| 26. | Fairport | 0.44% | 0.098%(+0.343)#477 | 0.16%(+0.284)#4,785 |
| 27. | New Hartford | 0.42% | 0.098%(+0.325)#478 | 0.16%(+0.266)#4,786 |
| 28. | Spring Valley | 0.41% | 0.098%(+0.308)#479 | 0.16%(+0.250)#4,787 |
| 29. | Hampton Bays | 0.40% | 0.098%(+0.297)#480 | 0.16%(+0.239)#4,788 |
| 30. | Long Beach | 0.37% | 0.098%(+0.273)#481 | 0.16%(+0.215)#4,789 |
| 31. | Parish | 0.36% | 0.098%(+0.262)#516 | 0.16%(+0.204)#5,276 |
| 32. | Briarcliff Manor | 0.35% | 0.098%(+0.253)#517 | 0.16%(+0.195)#5,277 |
| 33. | Siena College | 0.35% | 0.098%(+0.251)#518 | 0.16%(+0.192)#5,278 |
| 34. | Mamaroneck | 0.35% | 0.098%(+0.248)#519 | 0.16%(+0.189)#5,279 |
| 35. | North Bellport | 0.34% | 0.098%(+0.244)#520 | 0.16%(+0.185)#5,280 |
| 36. | Calverton | 0.34% | 0.098%(+0.238)#521 | 0.16%(+0.179)#5,281 |
| 37. | Flanders | 0.33% | 0.098%(+0.229)#522 | 0.16%(+0.171)#5,282 |
| 38. | Hartsdale | 0.32% | 0.098%(+0.226)#523 | 0.16%(+0.168)#5,283 |
| 39. | Shirley | 0.32% | 0.098%(+0.222)#524 | 0.16%(+0.164)#5,284 |
| 40. | South Floral Park | 0.31% | 0.098%(+0.213)#525 | 0.16%(+0.154)#5,285 |
| 41. | New Rochelle | 0.30% | 0.098%(+0.205)#526 | 0.16%(+0.146)#5,286 |
| 42. | Valley Stream | 0.29% | 0.098%(+0.192)#527 | 0.16%(+0.134)#5,287 |
| 43. | Herricks | 0.28% | 0.098%(+0.186)#528 | 0.16%(+0.127)#5,288 |
| 44. | East Glenville | 0.27% | 0.098%(+0.172)#529 | 0.16%(+0.113)#5,289 |
| 45. | Northeast Ithaca | 0.27% | 0.098%(+0.168)#530 | 0.16%(+0.110)#5,290 |
| 46. | North Lindenhurst | 0.26% | 0.098%(+0.162)#531 | 0.16%(+0.103)#5,291 |
| 47. | East Farmingdale | 0.25% | 0.098%(+0.150)#532 | 0.16%(+0.091)#5,292 |
| 48. | Wesley Hills | 0.24% | 0.098%(+0.147)#533 | 0.16%(+0.088)#5,293 |
| 49. | Scarsdale | 0.23% | 0.098%(+0.134)#534 | 0.16%(+0.076)#5,294 |
| 50. | Vassar College | 0.23% | 0.098%(+0.134)#556 | 0.16%(+0.076)#6,246 |
| 51. | Yonkers | 0.23% | 0.098%(+0.132)#557 | 0.16%(+0.073)#6,247 |
| 52. | Elmont | 0.23% | 0.098%(+0.131)#558 | 0.16%(+0.073)#6,248 |
| 53. | Mayfield | 0.21% | 0.098%(+0.115)#569 | 0.16%(+0.056)#6,418 |
| 54. | Ilion | 0.21% | 0.098%(+0.109)#573 | 0.16%(+0.051)#6,466 |
| 55. | East Massapequa | 0.20% | 0.098%(+0.102)#574 | 0.16%(+0.043)#6,467 |
| 56. | Rye | 0.19% | 0.098%(+0.096)#575 | 0.16%(+0.038)#6,468 |
| 57. | Port Jefferson Station | 0.19% | 0.098%(+0.090)#576 | 0.16%(+0.031)#6,469 |
| 58. | Setauket | 0.19% | 0.098%(+0.089)#577 | 0.16%(+0.030)#6,470 |
| 59. | Utica | 0.18% | 0.098%(+0.086)#578 | 0.16%(+0.027)#6,471 |
| 60. | Bay Shore | 0.18% | 0.098%(+0.085)#579 | 0.16%(+0.027)#6,472 |
| 61. | Sea Cliff | 0.18% | 0.098%(+0.080)#580 | 0.16%(+0.021)#6,473 |
| 62. | Middle Island | 0.18% | 0.098%(+0.079)#581 | 0.16%(+0.020)#6,474 |
| 63. | South Huntington | 0.17% | 0.098%(+0.076)#582 | 0.16%(+0.018)#6,475 |
| 64. | Glen Cove | 0.17% | 0.098%(+0.076)#583 | 0.16%(+0.017)#6,476 |
| 65. | Terryville | 0.17% | 0.098%(+0.067)#584 | 0.16%(+0.009)#6,477 |
| 66. | New York | 0.16% | 0.098%(+0.065)#585 | 0.16%(+0.006)#6,478 |
| 67. | Baldwin | 0.16% | 0.098%(+0.059)#586 | 0.16%(+0.000)#6,479 |
| 68. | Mechanicstown | 0.15% | 0.098%(+0.053)#587 | 0.16%(-0.006)#6,480 |
| 69. | Port Chester | 0.15% | 0.098%(+0.052)#588 | 0.16%(-0.007)#6,481 |
| 70. | Saratoga Springs | 0.15% | 0.098%(+0.049)#589 | 0.16%(-0.009)#6,482 |
| 71. | Dobbs Ferry | 0.14% | 0.098%(+0.042)#590 | 0.16%(-0.017)#6,483 |
| 72. | Country Knolls | 0.14% | 0.098%(+0.039)#591 | 0.16%(-0.019)#6,794 |
| 73. | Westbury | 0.13% | 0.098%(+0.035)#592 | 0.16%(-0.024)#6,795 |
| 74. | Orange Lake | 0.13% | 0.098%(+0.031)#593 | 0.16%(-0.028)#6,796 |
| 75. | Garden City Park | 0.13% | 0.098%(+0.030)#594 | 0.16%(-0.028)#6,797 |
| 76. | Oneida | 0.13% | 0.098%(+0.028)#599 | 0.16%(-0.031)#7,189 |
| 77. | Stony Brook University | 0.13% | 0.098%(+0.027)#600 | 0.16%(-0.031)#7,190 |
| 78. | Huntington Station | 0.12% | 0.098%(+0.023)#601 | 0.16%(-0.035)#7,191 |
| 79. | Nesconset | 0.12% | 0.098%(+0.020)#602 | 0.16%(-0.039)#7,192 |
| 80. | Lake Grove | 0.12% | 0.098%(+0.019)#603 | 0.16%(-0.039)#7,193 |
| 81. | Belmont | 0.12% | 0.098%(+0.017)#604 | 0.16%(-0.041)#7,276 |
| 82. | West Hempstead | 0.11% | 0.098%(+0.014)#605 | 0.16%(-0.044)#7,277 |
| 83. | Kingston | 0.11% | 0.098%(+0.014)#606 | 0.16%(-0.044)#7,278 |
| 84. | Ossining | 0.11% | 0.098%(+0.013)#607 | 0.16%(-0.046)#7,279 |
| 85. | Mastic Beach | 0.11% | 0.098%(+0.007)#608 | 0.16%(-0.052)#7,280 |
| 86. | North Massapequa | 0.10% | 0.098%(+0.006)#609 | 0.16%(-0.052)#7,281 |
| 87. | Levittown | 0.10% | 0.098%(+0.006)#610 | 0.16%(-0.052)#7,282 |
| 88. | Syosset | 0.10% | 0.098%(+0.003)#611 | 0.16%(-0.056)#7,283 |
| 89. | Elwood | 0.099% | 0.098%(+0.001)#612 | 0.16%(-0.058)#7,284 |
| 90. | Old Field | 0.098% | 0.098%(-0.000)#613 | 0.16%(-0.059)#7,439 |
| 91. | Central Islip | 0.093% | 0.098%(-0.005)#614 | 0.16%(-0.064)#7,440 |
| 92. | Commack | 0.092% | 0.098%(-0.006)#615 | 0.16%(-0.065)#7,441 |
| 93. | Batavia | 0.090% | 0.098%(-0.008)#616 | 0.16%(-0.067)#7,442 |
| 94. | Tuckahoe | 0.086% | 0.098%(-0.013)#617 | 0.16%(-0.071)#7,527 |
| 95. | Newburgh | 0.080% | 0.098%(-0.018)#618 | 0.16%(-0.077)#7,528 |
| 96. | Niagara Falls | 0.074% | 0.098%(-0.024)#619 | 0.16%(-0.083)#7,529 |
| 97. | White Plains | 0.069% | 0.098%(-0.029)#620 | 0.16%(-0.088)#7,530 |
| 98. | North New Hyde Park | 0.068% | 0.098%(-0.030)#621 | 0.16%(-0.089)#7,531 |
| 99. | Woodmere | 0.068% | 0.098%(-0.030)#622 | 0.16%(-0.089)#7,532 |
| 100. | Niskayuna | 0.068% | 0.098%(-0.030)#623 | 0.16%(-0.089)#7,533 |
Common Questions
What are the Top 10 Cities with the Highest Percentage of Immigrants from Venezuela in New York?
Top 10 Cities with the Highest Percentage of Immigrants from Venezuela in New York are:
#1
3.16%
#2
2.20%
#3
2.02%
#4
1.45%
#5
1.27%
#6
1.24%
#7
0.96%
#8
0.95%
#9
0.94%
#10
0.87%
What city has the Highest Percentage of Immigrants from Venezuela in New York?
Hammondsport has the Highest Percentage of Immigrants from Venezuela in New York with 3.16%.
What is the Percentage of Immigrants from Venezuela in the State of New York?
Percentage of Immigrants from Venezuela in New York is 0.098%.
What is the Percentage of Immigrants from Venezuela in the United States?
Percentage of Immigrants from Venezuela in the United States is 0.16%.