Cities with the Highest Percentage of Immigrants from Oceania in Washington
RELATED REPORTS & OPTIONS
Oceania
Washington
Compare Cities
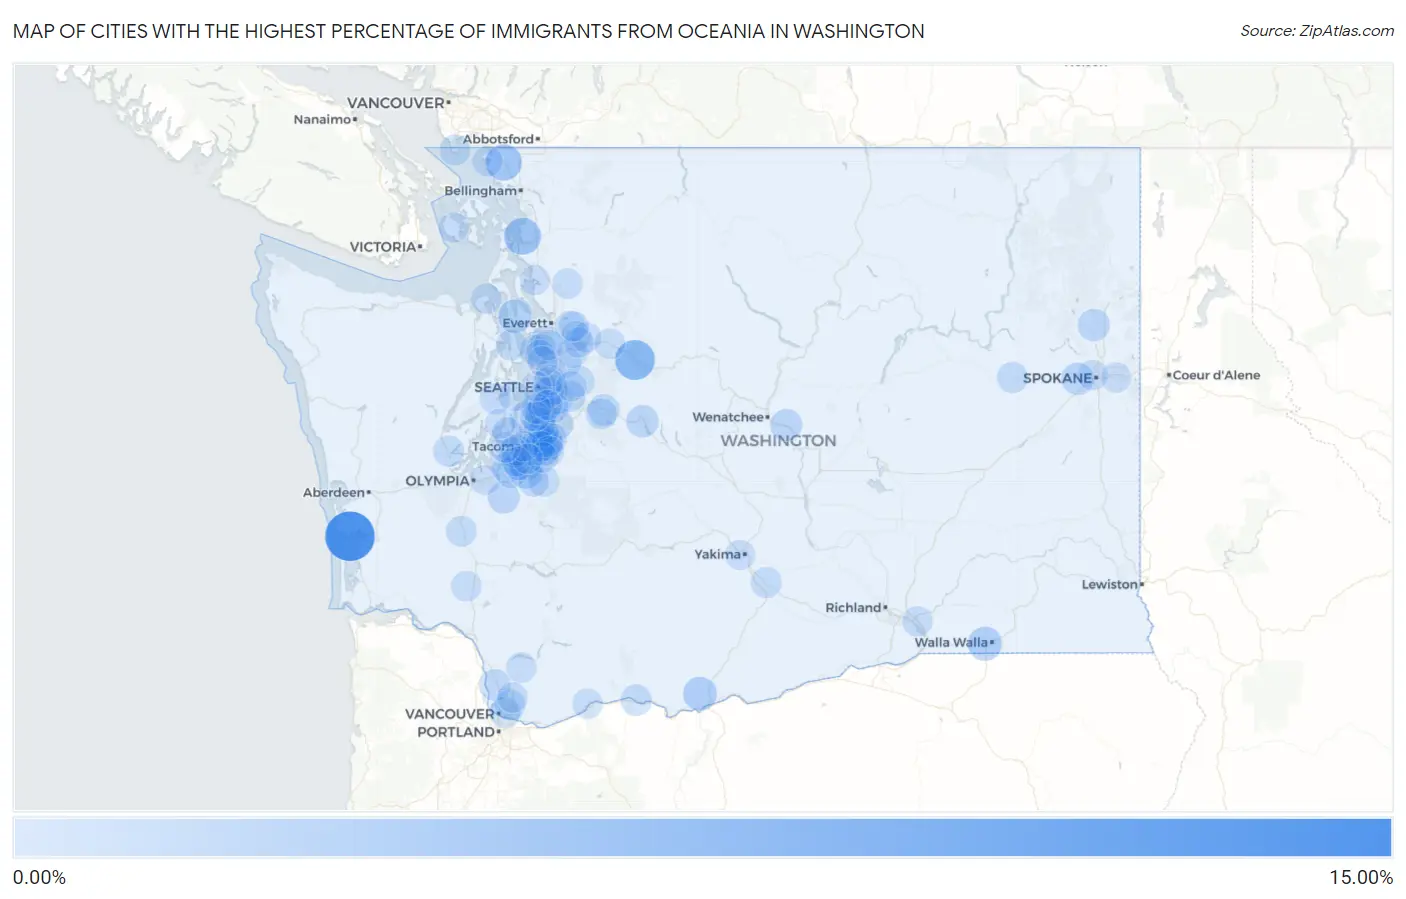
Map of Cities with the Highest Percentage of Immigrants from Oceania in Washington
0.00%
15.00%
Cities with the Highest Percentage of Immigrants from Oceania in Washington
| City | Oceania | vs State | vs National | |
| 1. | Tokeland | 13.73% | 0.31%(+13.4)#-1 | 0.089%(+13.6)#0 |
| 2. | Baring | 6.80% | 0.31%(+6.49)#0 | 0.089%(+6.71)#1 |
| 3. | Bay View | 4.72% | 0.31%(+4.41)#1 | 0.089%(+4.64)#2 |
| 4. | Custer | 4.32% | 0.31%(+4.01)#2 | 0.089%(+4.23)#3 |
| 5. | Garrett | 2.83% | 0.31%(+2.52)#3 | 0.089%(+2.74)#4 |
| 6. | Centerville | 2.65% | 0.31%(+2.34)#4 | 0.089%(+2.57)#5 |
| 7. | Fife | 2.54% | 0.31%(+2.22)#5 | 0.089%(+2.45)#6 |
| 8. | Freeland | 2.43% | 0.31%(+2.12)#6 | 0.089%(+2.34)#7 |
| 9. | Parkland | 1.95% | 0.31%(+1.64)#9 | 0.089%(+1.86)#183 |
| 10. | Airway Heights | 1.69% | 0.31%(+1.38)#10 | 0.089%(+1.60)#184 |
| 11. | Edgewood | 1.69% | 0.31%(+1.38)#11 | 0.089%(+1.60)#185 |
| 12. | Tukwila | 1.67% | 0.31%(+1.36)#12 | 0.089%(+1.59)#192 |
| 13. | Snoqualmie Pass | 1.67% | 0.31%(+1.36)#13 | 0.089%(+1.58)#193 |
| 14. | Spanaway | 1.64% | 0.31%(+1.33)#14 | 0.089%(+1.55)#211 |
| 15. | Deer Park | 1.56% | 0.31%(+1.25)#15 | 0.089%(+1.47)#212 |
| 16. | Yelm | 1.45% | 0.31%(+1.14)#16 | 0.089%(+1.36)#213 |
| 17. | Kent | 1.40% | 0.31%(+1.09)#17 | 0.089%(+1.31)#214 |
| 18. | Rock Island | 1.35% | 0.31%(+1.04)#18 | 0.089%(+1.26)#215 |
| 19. | Pacific | 1.31% | 0.31%(+1.000)#19 | 0.089%(+1.22)#216 |
| 20. | Lakeland South | 1.31% | 0.31%(+0.998)#20 | 0.089%(+1.22)#217 |
| 21. | Federal Way | 1.26% | 0.31%(+0.952)#21 | 0.089%(+1.17)#218 |
| 22. | Seatac | 1.25% | 0.31%(+0.941)#22 | 0.089%(+1.16)#219 |
| 23. | Ridgefield | 1.24% | 0.31%(+0.926)#23 | 0.089%(+1.15)#220 |
| 24. | Riverbend | 1.22% | 0.31%(+0.914)#24 | 0.089%(+1.14)#221 |
| 25. | North Fort Lewis | 1.16% | 0.31%(+0.852)#25 | 0.089%(+1.07)#222 |
| 26. | Auburn | 1.14% | 0.31%(+0.826)#26 | 0.089%(+1.05)#223 |
| 27. | Algona | 1.13% | 0.31%(+0.823)#27 | 0.089%(+1.04)#224 |
| 28. | Newcastle | 1.01% | 0.31%(+0.695)#28 | 0.089%(+0.917)#225 |
| 29. | Vancouver | 1.01% | 0.31%(+0.695)#29 | 0.089%(+0.917)#226 |
| 30. | Ames Lake | 0.99% | 0.31%(+0.682)#30 | 0.089%(+0.904)#227 |
| 31. | Des Moines | 0.98% | 0.31%(+0.666)#31 | 0.089%(+0.888)#228 |
| 32. | Bingen | 0.96% | 0.31%(+0.654)#32 | 0.089%(+0.876)#229 |
| 33. | Lake Stickney | 0.95% | 0.31%(+0.644)#33 | 0.089%(+0.866)#230 |
| 34. | Issaquah | 0.89% | 0.31%(+0.580)#34 | 0.089%(+0.802)#231 |
| 35. | Wilderness Rim | 0.85% | 0.31%(+0.544)#35 | 0.089%(+0.766)#232 |
| 36. | Shelton | 0.85% | 0.31%(+0.538)#36 | 0.089%(+0.760)#233 |
| 37. | Davenport | 0.81% | 0.31%(+0.500)#37 | 0.089%(+0.722)#234 |
| 38. | Vashon | 0.78% | 0.31%(+0.466)#38 | 0.089%(+0.688)#235 |
| 39. | Fort Lewis | 0.77% | 0.31%(+0.463)#39 | 0.089%(+0.685)#236 |
| 40. | Fords Prairie | 0.74% | 0.31%(+0.428)#40 | 0.089%(+0.650)#237 |
| 41. | Buena | 0.74% | 0.31%(+0.426)#41 | 0.089%(+0.648)#238 |
| 42. | Point Roberts | 0.72% | 0.31%(+0.410)#42 | 0.089%(+0.632)#239 |
| 43. | Port Gamble Tribal Community | 0.71% | 0.31%(+0.395)#43 | 0.089%(+0.617)#240 |
| 44. | Graham | 0.69% | 0.31%(+0.382)#44 | 0.089%(+0.604)#241 |
| 45. | Elk Plain | 0.68% | 0.31%(+0.371)#45 | 0.089%(+0.593)#242 |
| 46. | Five Corners | 0.67% | 0.31%(+0.363)#46 | 0.089%(+0.585)#243 |
| 47. | Fircrest | 0.66% | 0.31%(+0.352)#47 | 0.089%(+0.574)#244 |
| 48. | Bremerton | 0.64% | 0.31%(+0.331)#48 | 0.089%(+0.553)#245 |
| 49. | Milton | 0.63% | 0.31%(+0.321)#49 | 0.089%(+0.543)#246 |
| 50. | Everett | 0.63% | 0.31%(+0.318)#50 | 0.089%(+0.540)#247 |
| 51. | Lakeland North | 0.61% | 0.31%(+0.298)#51 | 0.089%(+0.520)#248 |
| 52. | High Bridge | 0.56% | 0.31%(+0.247)#52 | 0.089%(+0.469)#249 |
| 53. | Edmonds | 0.52% | 0.31%(+0.207)#53 | 0.089%(+0.429)#250 |
| 54. | Gold Bar | 0.51% | 0.31%(+0.203)#54 | 0.089%(+0.425)#251 |
| 55. | Amboy | 0.48% | 0.31%(+0.166)#55 | 0.089%(+0.388)#252 |
| 56. | Brush Prairie | 0.46% | 0.31%(+0.147)#56 | 0.089%(+0.369)#253 |
| 57. | Arlington Heights | 0.45% | 0.31%(+0.138)#57 | 0.089%(+0.360)#254 |
| 58. | Vader | 0.45% | 0.31%(+0.138)#58 | 0.089%(+0.360)#255 |
| 59. | Puyallup | 0.44% | 0.31%(+0.133)#59 | 0.089%(+0.355)#256 |
| 60. | Cottage Lake | 0.43% | 0.31%(+0.120)#60 | 0.089%(+0.342)#257 |
| 61. | Woods Creek | 0.43% | 0.31%(+0.115)#61 | 0.089%(+0.337)#258 |
| 62. | Mcchord Afb | 0.41% | 0.31%(+0.103)#62 | 0.089%(+0.325)#259 |
| 63. | Stevenson | 0.41% | 0.31%(+0.102)#63 | 0.089%(+0.324)#260 |
| 64. | Chain Lake | 0.41% | 0.31%(+0.099)#64 | 0.089%(+0.321)#261 |
| 65. | Sumner | 0.41% | 0.31%(+0.095)#65 | 0.089%(+0.317)#262 |
| 66. | Spokane | 0.40% | 0.31%(+0.089)#66 | 0.089%(+0.311)#263 |
| 67. | Monroe | 0.40% | 0.31%(+0.087)#67 | 0.089%(+0.309)#264 |
| 68. | Birch Bay | 0.39% | 0.31%(+0.084)#68 | 0.089%(+0.306)#265 |
| 69. | University Place | 0.39% | 0.31%(+0.084)#69 | 0.089%(+0.306)#266 |
| 70. | Port Townsend | 0.39% | 0.31%(+0.083)#70 | 0.089%(+0.305)#267 |
| 71. | Lakewood | 0.39% | 0.31%(+0.079)#71 | 0.089%(+0.301)#268 |
| 72. | Beaux Arts Village | 0.39% | 0.31%(+0.077)#72 | 0.089%(+0.299)#269 |
| 73. | Tacoma | 0.38% | 0.31%(+0.074)#73 | 0.089%(+0.296)#270 |
| 74. | Mercer Island | 0.37% | 0.31%(+0.062)#74 | 0.089%(+0.284)#271 |
| 75. | Lynnwood | 0.37% | 0.31%(+0.058)#75 | 0.089%(+0.280)#272 |
| 76. | Burbank | 0.35% | 0.31%(+0.044)#76 | 0.089%(+0.266)#273 |
| 77. | Renton | 0.34% | 0.31%(+0.031)#77 | 0.089%(+0.253)#274 |
| 78. | Boulevard Park | 0.34% | 0.31%(+0.029)#78 | 0.089%(+0.251)#275 |
| 79. | Midland | 0.33% | 0.31%(+0.020)#79 | 0.089%(+0.242)#276 |
| 80. | Fox Island | 0.33% | 0.31%(+0.019)#80 | 0.089%(+0.241)#277 |
| 81. | Mountlake Terrace | 0.31% | 0.31%(+0.003)#81 | 0.089%(+0.225)#278 |
| 82. | Normandy Park | 0.31% | 0.31%(+0.003)#82 | 0.089%(+0.225)#279 |
| 83. | Yarrow Point | 0.31% | 0.31%(+0.002)#83 | 0.089%(+0.224)#280 |
| 84. | Friday Harbor | 0.30% | 0.31%(-0.008)#84 | 0.089%(+0.214)#281 |
| 85. | Kirkland | 0.30% | 0.31%(-0.010)#85 | 0.089%(+0.212)#326 |
| 86. | Martha Lake | 0.30% | 0.31%(-0.014)#86 | 0.089%(+0.208)#327 |
| 87. | Spokane Valley | 0.28% | 0.31%(-0.026)#87 | 0.089%(+0.196)#328 |
| 88. | Burien | 0.28% | 0.31%(-0.031)#88 | 0.089%(+0.191)#329 |
| 89. | Medina | 0.27% | 0.31%(-0.037)#89 | 0.089%(+0.185)#330 |
| 90. | Seattle | 0.27% | 0.31%(-0.038)#90 | 0.089%(+0.184)#331 |
| 91. | Gig Harbor | 0.27% | 0.31%(-0.042)#91 | 0.089%(+0.180)#332 |
| 92. | Sammamish | 0.27% | 0.31%(-0.045)#92 | 0.089%(+0.177)#333 |
| 93. | Yakima | 0.26% | 0.31%(-0.049)#93 | 0.089%(+0.173)#334 |
| 94. | Lake Forest Park | 0.26% | 0.31%(-0.051)#94 | 0.089%(+0.171)#335 |
| 95. | Wauna | 0.26% | 0.31%(-0.055)#95 | 0.089%(+0.167)#336 |
| 96. | Lacey | 0.25% | 0.31%(-0.056)#96 | 0.089%(+0.166)#337 |
| 97. | Bryn Mawr Skyway | 0.25% | 0.31%(-0.061)#97 | 0.089%(+0.161)#338 |
| 98. | Manchester | 0.25% | 0.31%(-0.062)#98 | 0.089%(+0.160)#339 |
| 99. | Stanwood | 0.25% | 0.31%(-0.062)#99 | 0.089%(+0.160)#340 |
| 100. | Snohomish | 0.25% | 0.31%(-0.064)#100 | 0.089%(+0.158)#341 |
Common Questions
What are the Top 10 Cities with the Highest Percentage of Immigrants from Oceania in Washington?
Top 10 Cities with the Highest Percentage of Immigrants from Oceania in Washington are:
#1
13.73%
#2
6.80%
#3
4.72%
#4
4.32%
#5
2.83%
#6
2.65%
#7
2.54%
#8
2.43%
#9
1.95%
#10
1.69%
What city has the Highest Percentage of Immigrants from Oceania in Washington?
Tokeland has the Highest Percentage of Immigrants from Oceania in Washington with 13.73%.
What is the Percentage of Immigrants from Oceania in the State of Washington?
Percentage of Immigrants from Oceania in Washington is 0.31%.
What is the Percentage of Immigrants from Oceania in the United States?
Percentage of Immigrants from Oceania in the United States is 0.089%.