Cities with the Highest Percentage of Immigrants from Oceania in South Carolina
RELATED REPORTS & OPTIONS
Oceania
South Carolina
Compare Cities
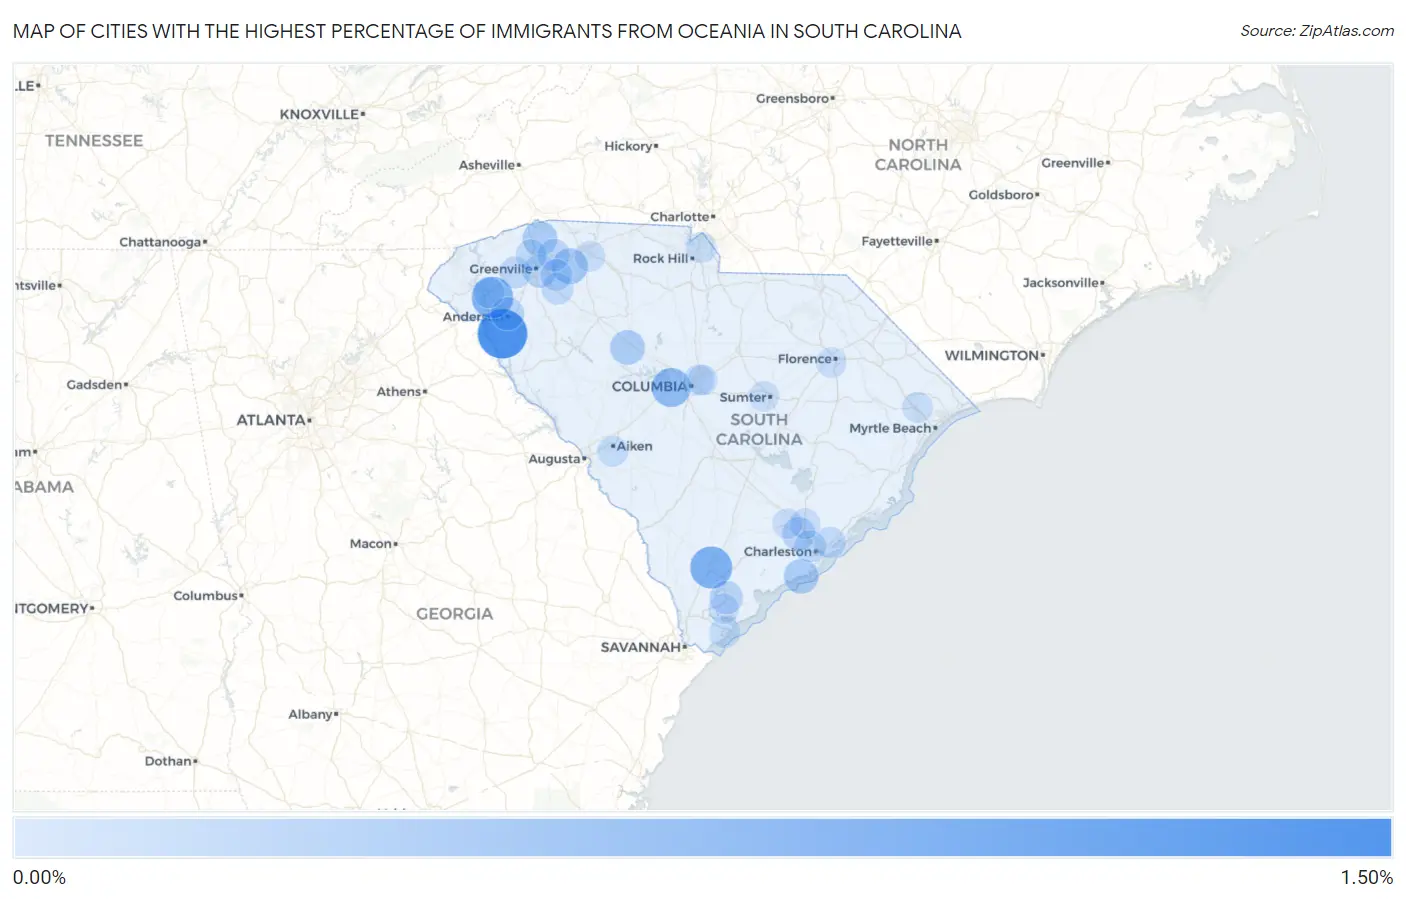
Map of Cities with the Highest Percentage of Immigrants from Oceania in South Carolina
0.00%
1.50%
Cities with the Highest Percentage of Immigrants from Oceania in South Carolina
| City | Oceania | vs State | vs National | |
| 1. | Starr | 1.03% | 0.027%(+1.00)#-1 | 0.089%(+0.942)#0 |
| 2. | Yemassee | 0.62% | 0.027%(+0.589)#0 | 0.089%(+0.527)#1 |
| 3. | Pendleton | 0.60% | 0.027%(+0.574)#1 | 0.089%(+0.512)#2 |
| 4. | Lexington | 0.46% | 0.027%(+0.434)#2 | 0.089%(+0.372)#3 |
| 5. | Baxter | 0.41% | 0.027%(+0.381)#3 | 0.089%(+0.319)#4 |
| 6. | Reidville | 0.29% | 0.027%(+0.262)#4 | 0.089%(+0.200)#5 |
| 7. | Tigerville | 0.24% | 0.027%(+0.209)#5 | 0.089%(+0.147)#6 |
| 8. | Kiawah Island | 0.23% | 0.027%(+0.208)#6 | 0.089%(+0.146)#7 |
| 9. | Newberry | 0.23% | 0.027%(+0.207)#7 | 0.089%(+0.145)#8 |
| 10. | Carolina Forest | 0.21% | 0.027%(+0.183)#8 | 0.089%(+0.121)#9 |
| 11. | Beaufort | 0.16% | 0.027%(+0.135)#9 | 0.089%(+0.073)#10 |
| 12. | North Charleston | 0.16% | 0.027%(+0.134)#10 | 0.089%(+0.072)#11 |
| 13. | Anderson | 0.16% | 0.027%(+0.133)#11 | 0.089%(+0.072)#12 |
| 14. | Greenville | 0.14% | 0.027%(+0.117)#12 | 0.089%(+0.055)#13 |
| 15. | Greer | 0.11% | 0.027%(+0.081)#13 | 0.089%(+0.019)#14 |
| 16. | Easley | 0.091% | 0.027%(+0.064)#14 | 0.089%(+0.002)#15 |
| 17. | Charleston | 0.085% | 0.027%(+0.058)#15 | 0.089%(-0.004)#16 |
| 18. | Fountain Inn | 0.084% | 0.027%(+0.058)#16 | 0.089%(-0.004)#17 |
| 19. | Five Forks | 0.081% | 0.027%(+0.054)#17 | 0.089%(-0.008)#18 |
| 20. | Mount Pleasant | 0.070% | 0.027%(+0.044)#18 | 0.089%(-0.018)#19 |
| 21. | Travelers Rest | 0.063% | 0.027%(+0.036)#19 | 0.089%(-0.026)#20 |
| 22. | Hilton Head Island | 0.056% | 0.027%(+0.029)#20 | 0.089%(-0.033)#21 |
| 23. | Aiken | 0.047% | 0.027%(+0.020)#21 | 0.089%(-0.042)#22 |
| 24. | Clemson | 0.046% | 0.027%(+0.019)#22 | 0.089%(-0.043)#23 |
| 25. | Fort Mill | 0.038% | 0.027%(+0.012)#23 | 0.089%(-0.050)#24 |
| 26. | Forest Acres | 0.038% | 0.027%(+0.011)#24 | 0.089%(-0.051)#25 |
| 27. | Conway | 0.036% | 0.027%(+0.009)#25 | 0.089%(-0.053)#26 |
| 28. | Spartanburg | 0.029% | 0.027%(+0.002)#26 | 0.089%(-0.060)#27 |
| 29. | Goose Creek | 0.024% | 0.027%(-0.003)#27 | 0.089%(-0.065)#28 |
| 30. | Sumter | 0.021% | 0.027%(-0.006)#28 | 0.089%(-0.068)#29 |
| 31. | Port Royal | 0.021% | 0.027%(-0.006)#29 | 0.089%(-0.068)#30 |
| 32. | Columbia | 0.015% | 0.027%(-0.012)#30 | 0.089%(-0.074)#31 |
| 33. | Summerville | 0.014% | 0.027%(-0.013)#31 | 0.089%(-0.075)#32 |
| 34. | Florence | 0.010% | 0.027%(-0.017)#32 | 0.089%(-0.079)#33 |
Common Questions
What are the Top 10 Cities with the Highest Percentage of Immigrants from Oceania in South Carolina?
Top 10 Cities with the Highest Percentage of Immigrants from Oceania in South Carolina are:
#1
1.03%
#2
0.62%
#3
0.60%
#4
0.46%
#5
0.29%
#6
0.24%
#7
0.23%
#8
0.23%
#9
0.16%
#10
0.16%
What city has the Highest Percentage of Immigrants from Oceania in South Carolina?
Starr has the Highest Percentage of Immigrants from Oceania in South Carolina with 1.03%.
What is the Percentage of Immigrants from Oceania in the State of South Carolina?
Percentage of Immigrants from Oceania in South Carolina is 0.027%.
What is the Percentage of Immigrants from Oceania in the United States?
Percentage of Immigrants from Oceania in the United States is 0.089%.