New Windsor, MD
New Windsor Map
New Windsor Overview
1,304
TOTAL POPULATION
625
MALE POPULATION
679
FEMALE POPULATION
92.05
MALES / 100 FEMALES
108.64
FEMALES / 100 MALES
50.2
MEDIAN AGE
2.6
AVG FAMILY SIZE
2.4
AVG HOUSEHOLD SIZE
$46,028
PER CAPITA INCOME
$103,250
AVG FAMILY INCOME
$96,667
AVG HOUSEHOLD INCOME
0.37
INEQUALITY / GINI INDEX
673
LABOR FORCE [ PEOPLE ]
59.8%
PERCENT IN LABOR FORCE
12.9%
UNEMPLOYMENT RATE
New Windsor Zip Codes
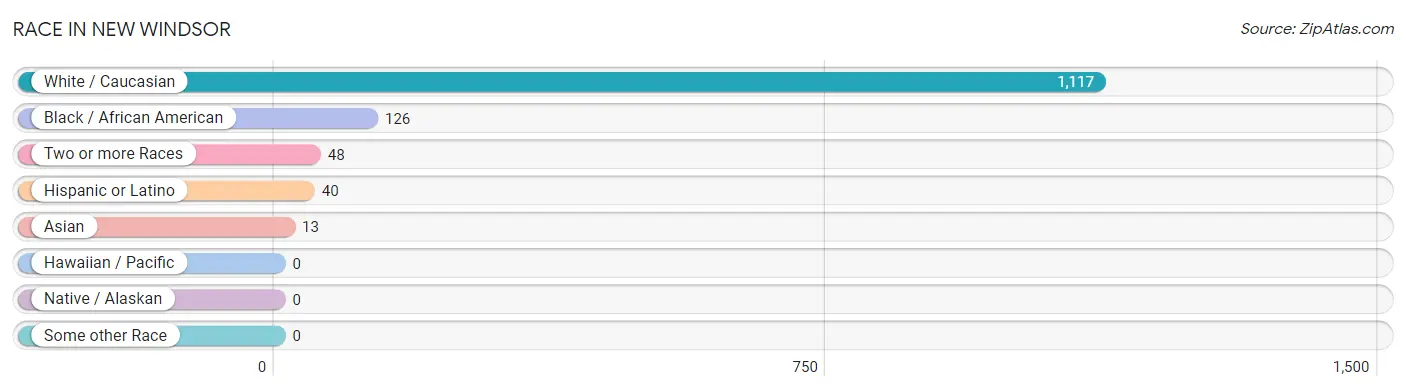
Race in New Windsor
The most populous races in New Windsor are White / Caucasian (1,117 | 85.7%), Black / African American (126 | 9.7%), and Two or more Races (48 | 3.7%).
| Race | # Population | % Population |
| Asian | 13 | 1.0% |
| Black / African American | 126 | 9.7% |
| Hawaiian / Pacific | 0 | 0.0% |
| Hispanic or Latino | 40 | 3.1% |
| Native / Alaskan | 0 | 0.0% |
| White / Caucasian | 1,117 | 85.7% |
| Two or more Races | 48 | 3.7% |
| Some other Race | 0 | 0.0% |
| Total | 1,304 | 100.0% |
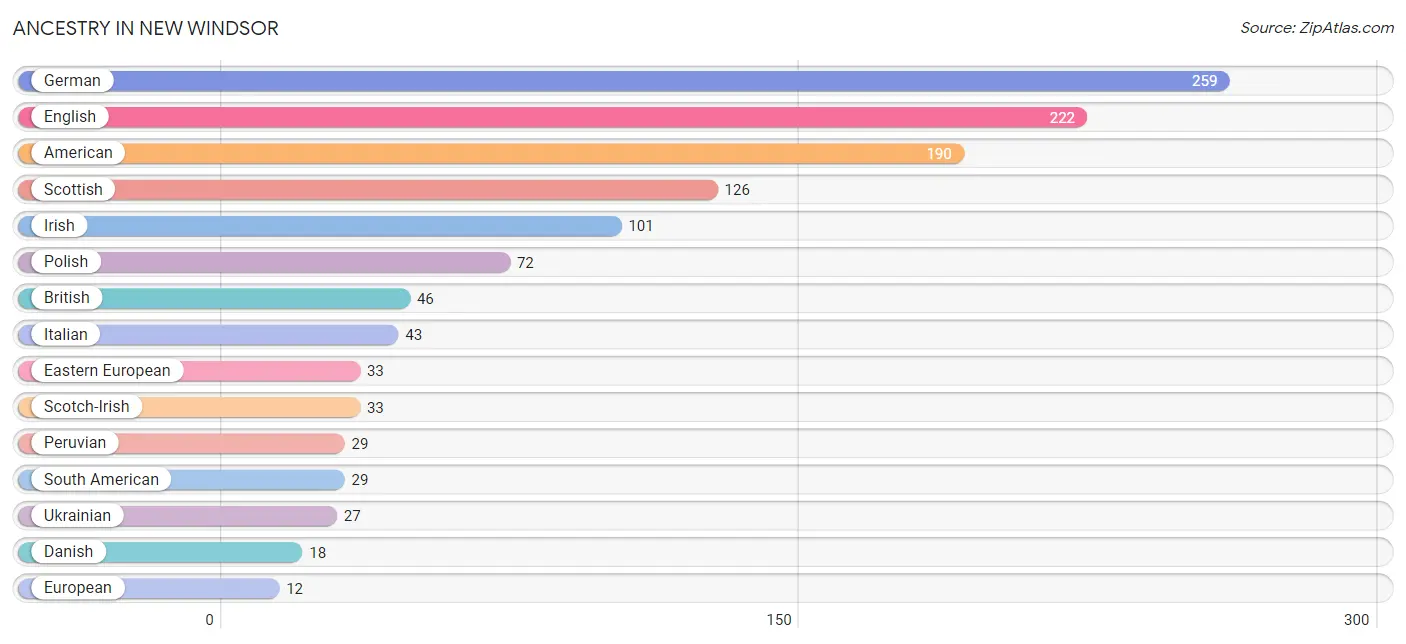
Ancestry in New Windsor
The most populous ancestries reported in New Windsor are German (259 | 19.9%), English (222 | 17.0%), American (190 | 14.6%), Scottish (126 | 9.7%), and Irish (101 | 7.7%), together accounting for 68.9% of all New Windsor residents.
| Ancestry | # Population | % Population |
| American | 190 | 14.6% |
| Bhutanese | 4 | 0.3% |
| British | 46 | 3.5% |
| Burmese | 2 | 0.2% |
| Danish | 18 | 1.4% |
| Dutch | 5 | 0.4% |
| Eastern European | 33 | 2.5% |
| English | 222 | 17.0% |
| European | 12 | 0.9% |
| Finnish | 8 | 0.6% |
| German | 259 | 19.9% |
| Haitian | 4 | 0.3% |
| Indian (Asian) | 7 | 0.5% |
| Irish | 101 | 7.7% |
| Italian | 43 | 3.3% |
| Lithuanian | 1 | 0.1% |
| Mexican | 3 | 0.2% |
| Norwegian | 4 | 0.3% |
| Peruvian | 29 | 2.2% |
| Polish | 72 | 5.5% |
| Portuguese | 3 | 0.2% |
| Puerto Rican | 8 | 0.6% |
| Scotch-Irish | 33 | 2.5% |
| Scottish | 126 | 9.7% |
| Serbian | 2 | 0.2% |
| South American | 29 | 2.2% |
| Ukrainian | 27 | 2.1% |
| Welsh | 4 | 0.3% | View All 28 Rows |
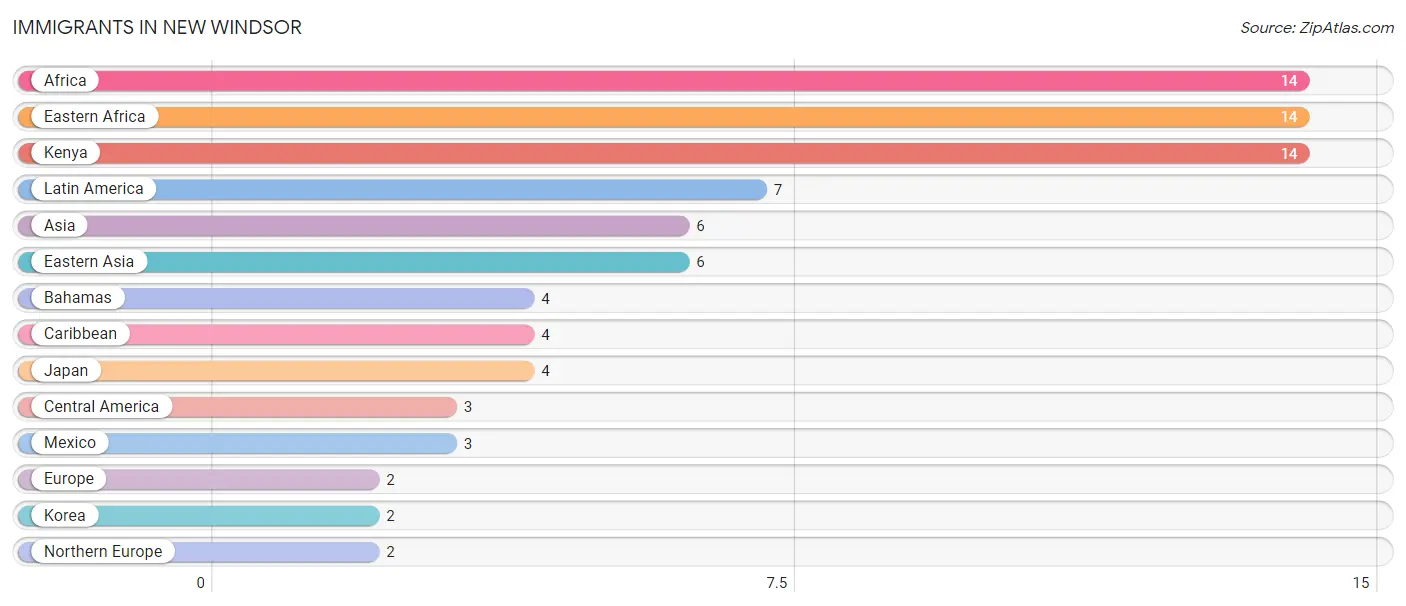
Immigrants in New Windsor
The most numerous immigrant groups reported in New Windsor came from Africa (14 | 1.1%), Eastern Africa (14 | 1.1%), Kenya (14 | 1.1%), Latin America (7 | 0.5%), and Asia (6 | 0.5%), together accounting for 4.2% of all New Windsor residents.
| Immigration Origin | # Population | % Population |
| Africa | 14 | 1.1% |
| Asia | 6 | 0.5% |
| Bahamas | 4 | 0.3% |
| Caribbean | 4 | 0.3% |
| Central America | 3 | 0.2% |
| Eastern Africa | 14 | 1.1% |
| Eastern Asia | 6 | 0.5% |
| Europe | 2 | 0.2% |
| Japan | 4 | 0.3% |
| Kenya | 14 | 1.1% |
| Korea | 2 | 0.2% |
| Latin America | 7 | 0.5% |
| Mexico | 3 | 0.2% |
| Northern Europe | 2 | 0.2% | View All 14 Rows |
Sex and Age in New Windsor
Sex and Age in New Windsor
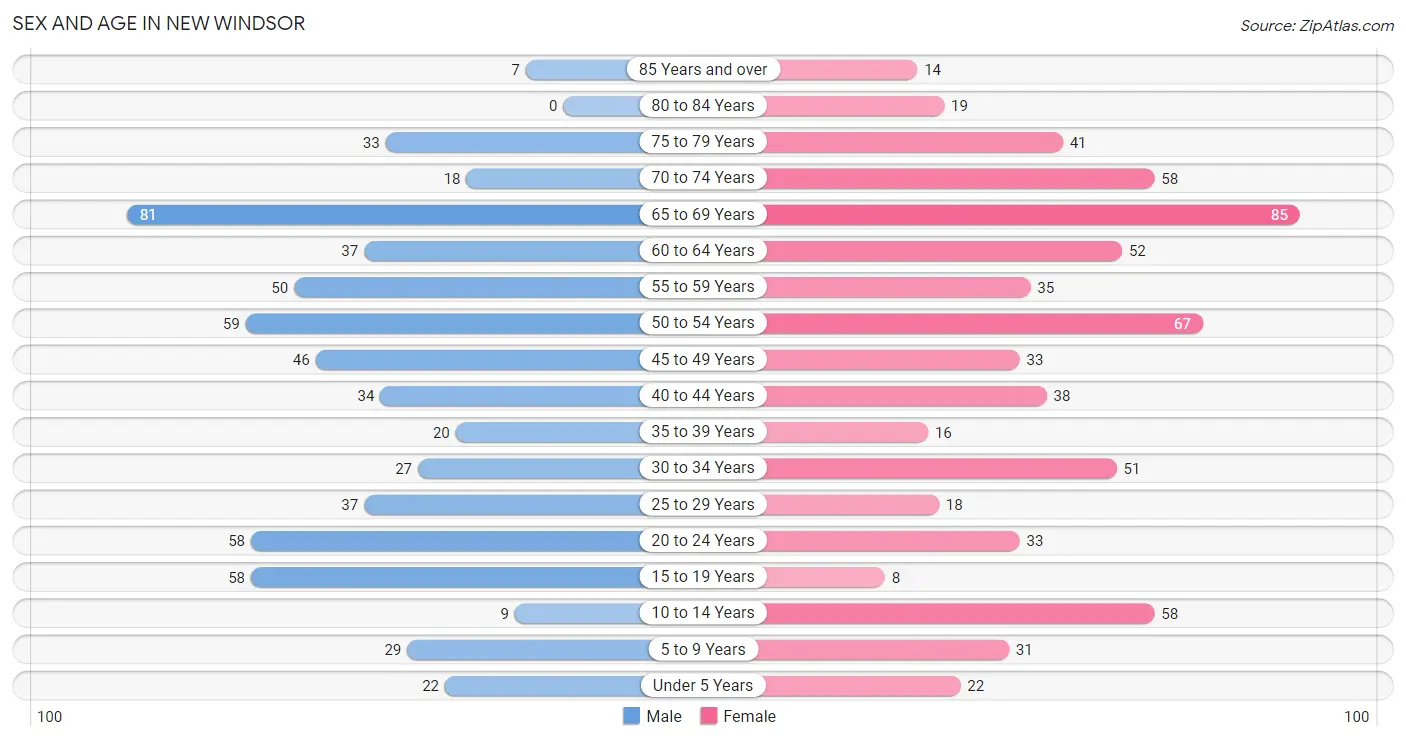
The most populous age groups in New Windsor are 65 to 69 Years (81 | 13.0%) for men and 65 to 69 Years (85 | 12.5%) for women.
| Age Bracket | Male | Female |
| Under 5 Years | 22 (3.5%) | 22 (3.2%) |
| 5 to 9 Years | 29 (4.6%) | 31 (4.6%) |
| 10 to 14 Years | 9 (1.4%) | 58 (8.5%) |
| 15 to 19 Years | 58 (9.3%) | 8 (1.2%) |
| 20 to 24 Years | 58 (9.3%) | 33 (4.9%) |
| 25 to 29 Years | 37 (5.9%) | 18 (2.6%) |
| 30 to 34 Years | 27 (4.3%) | 51 (7.5%) |
| 35 to 39 Years | 20 (3.2%) | 16 (2.4%) |
| 40 to 44 Years | 34 (5.4%) | 38 (5.6%) |
| 45 to 49 Years | 46 (7.4%) | 33 (4.9%) |
| 50 to 54 Years | 59 (9.4%) | 67 (9.9%) |
| 55 to 59 Years | 50 (8.0%) | 35 (5.1%) |
| 60 to 64 Years | 37 (5.9%) | 52 (7.7%) |
| 65 to 69 Years | 81 (13.0%) | 85 (12.5%) |
| 70 to 74 Years | 18 (2.9%) | 58 (8.5%) |
| 75 to 79 Years | 33 (5.3%) | 41 (6.0%) |
| 80 to 84 Years | 0 (0.0%) | 19 (2.8%) |
| 85 Years and over | 7 (1.1%) | 14 (2.1%) |
| Total | 625 (100.0%) | 679 (100.0%) |
Families and Households in New Windsor
Median Family Size in New Windsor
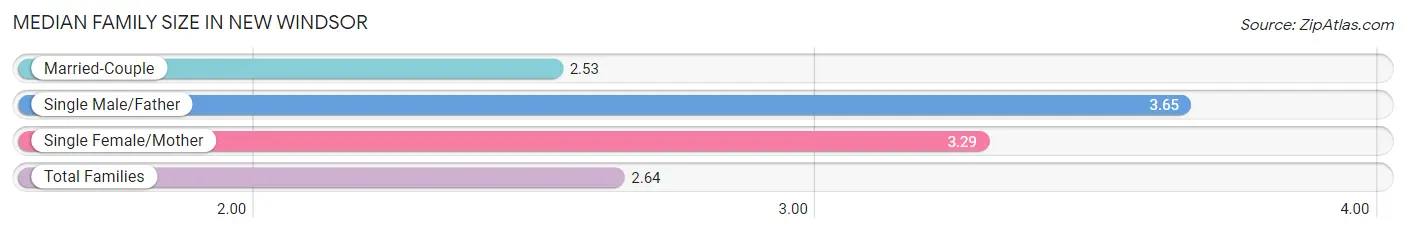
The median family size in New Windsor is 2.64 persons per family, with single male/father families (17 | 4.1%) accounting for the largest median family size of 3.65 persons per family. On the other hand, married-couple families (365 | 87.5%) represent the smallest median family size with 2.53 persons per family.
| Family Type | # Families | Family Size |
| Married-Couple | 365 (87.5%) | 2.53 |
| Single Male/Father | 17 (4.1%) | 3.65 |
| Single Female/Mother | 35 (8.4%) | 3.29 |
| Total Families | 417 (100.0%) | 2.64 |
Median Household Size in New Windsor
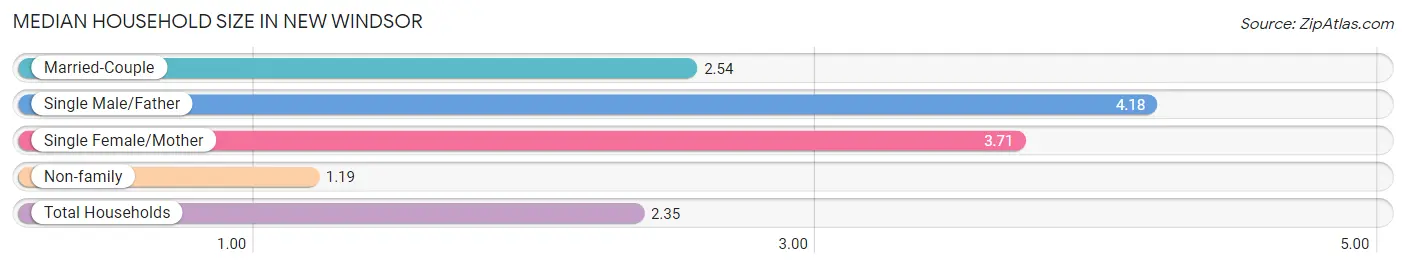
The median household size in New Windsor is 2.35 persons per household, with single male/father households (17 | 3.1%) accounting for the largest median household size of 4.18 persons per household. non-family households (125 | 23.1%) represent the smallest median household size with 1.19 persons per household.
| Household Type | # Households | Household Size |
| Married-Couple | 365 (67.3%) | 2.54 |
| Single Male/Father | 17 (3.1%) | 4.18 |
| Single Female/Mother | 35 (6.5%) | 3.71 |
| Non-family | 125 (23.1%) | 1.19 |
| Total Households | 542 (100.0%) | 2.35 |
Household Size by Marriage Status in New Windsor
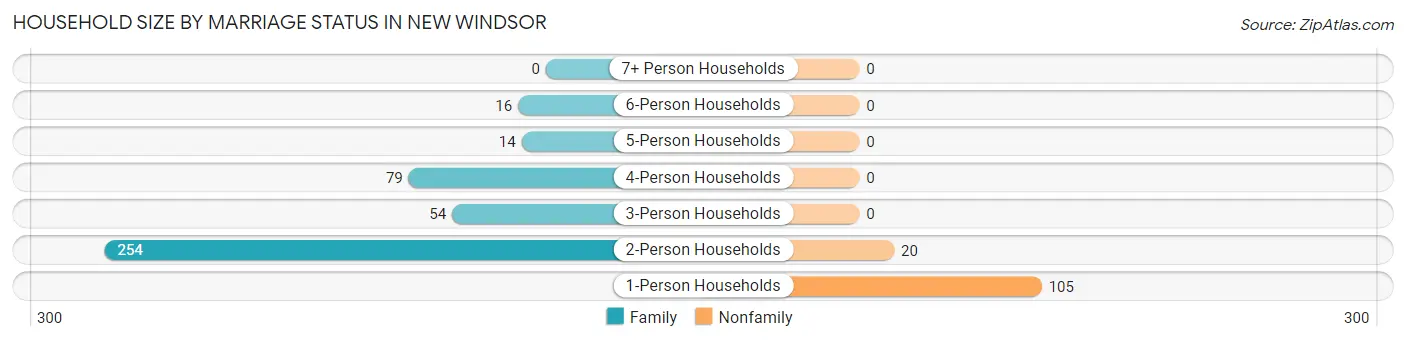
Out of a total of 542 households in New Windsor, 417 (76.9%) are family households, while 125 (23.1%) are nonfamily households. The most numerous type of family households are 2-person households, comprising 254, and the most common type of nonfamily households are 1-person households, comprising 105.
| Household Size | Family Households | Nonfamily Households |
| 1-Person Households | - | 105 (19.4%) |
| 2-Person Households | 254 (46.9%) | 20 (3.7%) |
| 3-Person Households | 54 (10.0%) | 0 (0.0%) |
| 4-Person Households | 79 (14.6%) | 0 (0.0%) |
| 5-Person Households | 14 (2.6%) | 0 (0.0%) |
| 6-Person Households | 16 (2.9%) | 0 (0.0%) |
| 7+ Person Households | 0 (0.0%) | 0 (0.0%) |
| Total | 417 (76.9%) | 125 (23.1%) |
Female Fertility in New Windsor
Fertility by Age in New Windsor
Average fertility rate in New Windsor is 95.0 births per 1,000 women. Women in the age bracket of 20 to 34 years have the highest fertility rate with 167.0 births per 1,000 women. Women in the age bracket of 20 to 34 years acount for 85.0% of all women with births.
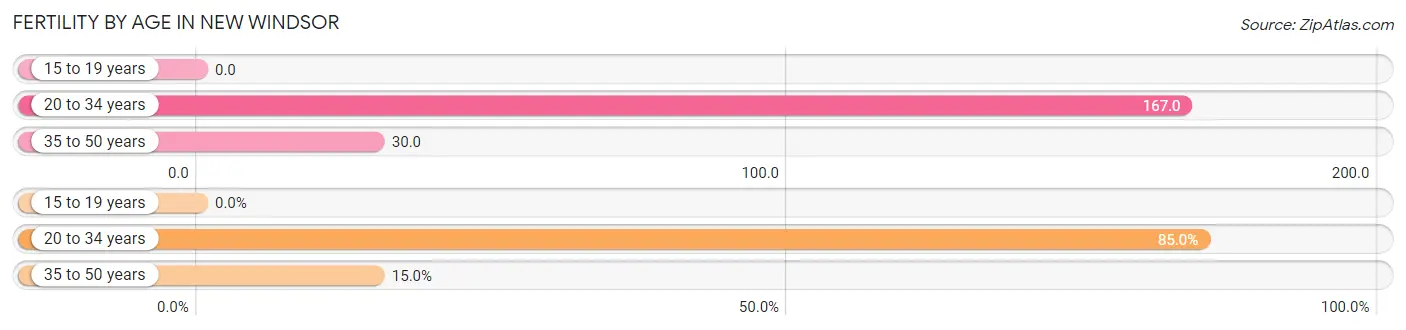
| Age Bracket | Women with Births | Births / 1,000 Women |
| 15 to 19 years | 0 (0.0%) | 0.0 |
| 20 to 34 years | 17 (85.0%) | 167.0 |
| 35 to 50 years | 3 (15.0%) | 30.0 |
| Total | 20 (100.0%) | 95.0 |
Fertility by Age by Marriage Status in New Windsor
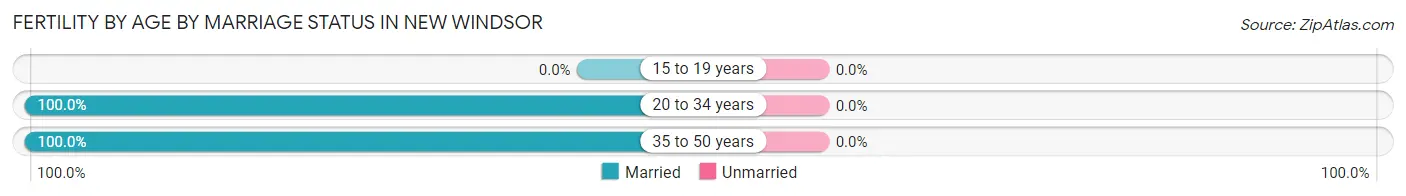
| Age Bracket | Married | Unmarried |
| 15 to 19 years | 0 (0.0%) | 0 (0.0%) |
| 20 to 34 years | 17 (100.0%) | 0 (0.0%) |
| 35 to 50 years | 3 (100.0%) | 0 (0.0%) |
| Total | 20 (100.0%) | 0 (0.0%) |
Fertility by Education in New Windsor
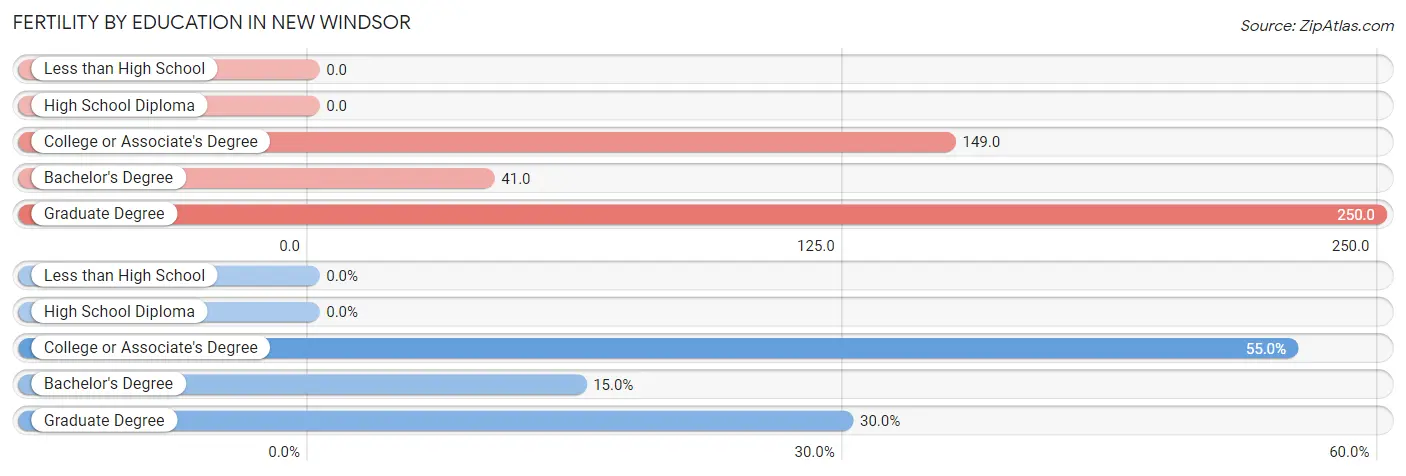
| Educational Attainment | Women with Births | Births / 1,000 Women |
| Less than High School | 0 (0.0%) | 0.0 |
| High School Diploma | 0 (0.0%) | 0.0 |
| College or Associate's Degree | 11 (55.0%) | 149.0 |
| Bachelor's Degree | 3 (15.0%) | 41.0 |
| Graduate Degree | 6 (30.0%) | 250.0 |
| Total | 20 (100.0%) | 95.0 |
Fertility by Education by Marriage Status in New Windsor
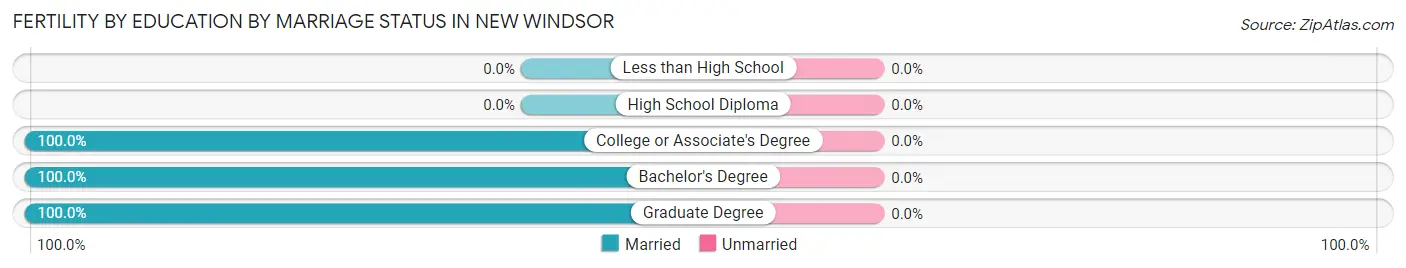
| Educational Attainment | Married | Unmarried |
| Less than High School | 0 (0.0%) | 0 (0.0%) |
| High School Diploma | 0 (0.0%) | 0 (0.0%) |
| College or Associate's Degree | 11 (100.0%) | 0 (0.0%) |
| Bachelor's Degree | 3 (100.0%) | 0 (0.0%) |
| Graduate Degree | 6 (100.0%) | 0 (0.0%) |
| Total | 20 (100.0%) | 0 (0.0%) |
Income in New Windsor
Income Overview in New Windsor
Per Capita Income in New Windsor is $46,028, while median incomes of families and households are $103,250 and $96,667 respectively.
| Characteristic | Number | Measure |
| Per Capita Income | 1,304 | $46,028 |
| Median Family Income | 417 | $103,250 |
| Mean Family Income | 417 | $124,193 |
| Median Household Income | 542 | $96,667 |
| Mean Household Income | 542 | $111,196 |
| Income Deficit | 417 | $0 |
| Wage / Income Gap (%) | 1,304 | 0.00% |
| Wage / Income Gap ($) | 1,304 | 100.00¢ per $1 |
| Gini / Inequality Index | 1,304 | 0.37 |
Earnings by Sex in New Windsor
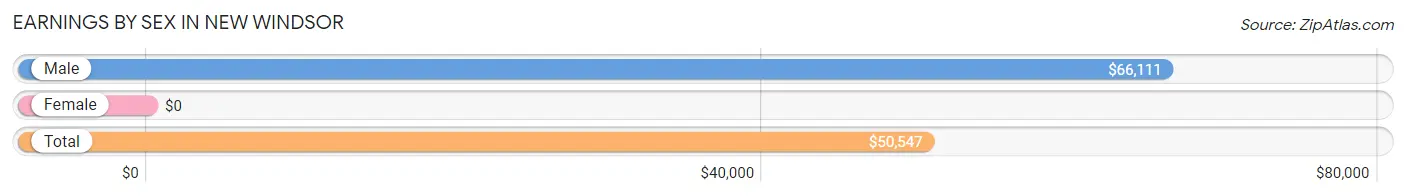
| Sex | Number | Average Earnings |
| Male | 376 (51.0%) | $66,111 |
| Female | 361 (49.0%) | $0 |
| Total | 737 (100.0%) | $50,547 |
Earnings by Sex by Income Bracket in New Windsor
The most common earnings brackets in New Windsor are $100,000+ for men (101 | 26.9%) and $17,500 to $19,999 for women (66 | 18.3%).
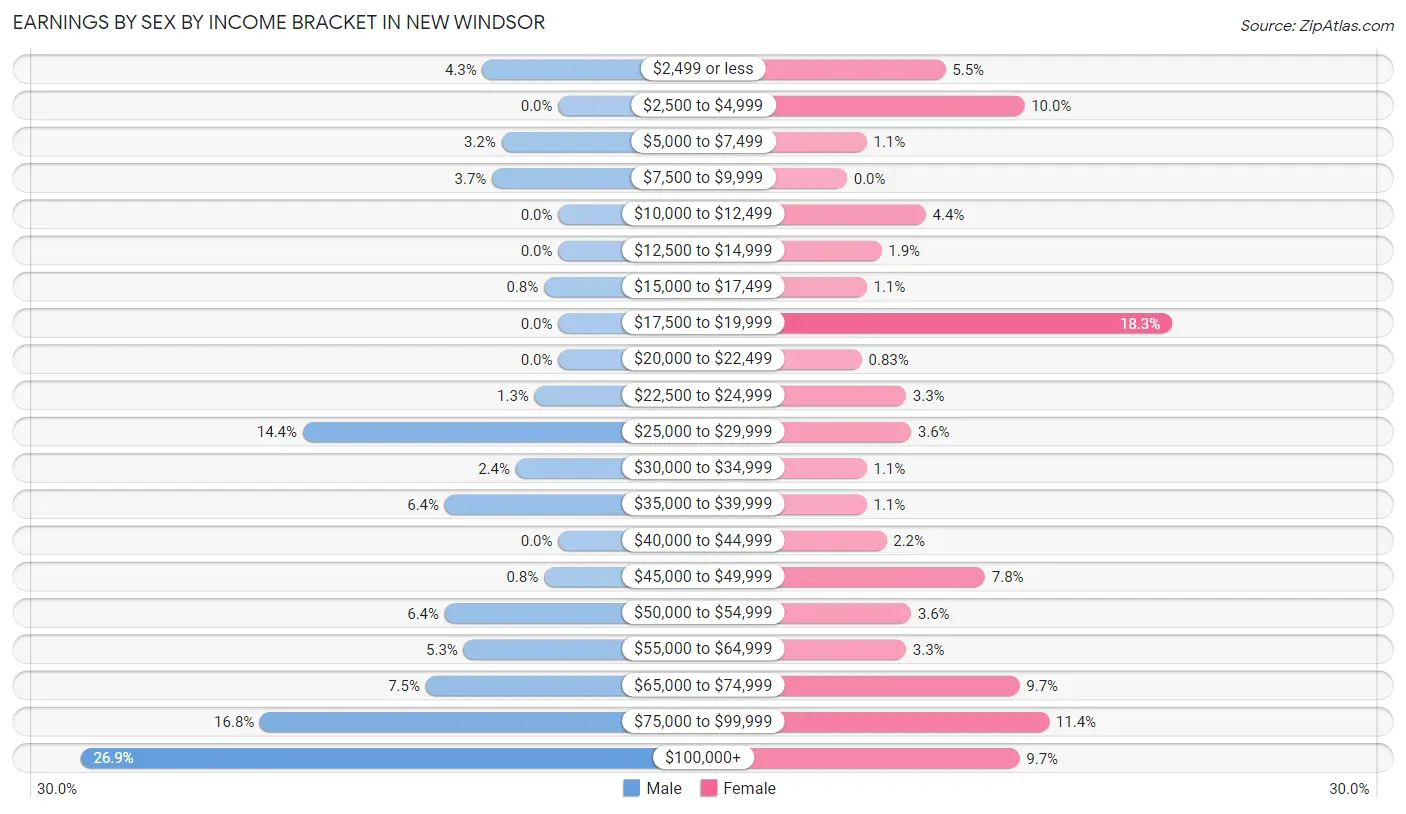
| Income | Male | Female |
| $2,499 or less | 16 (4.3%) | 20 (5.5%) |
| $2,500 to $4,999 | 0 (0.0%) | 36 (10.0%) |
| $5,000 to $7,499 | 12 (3.2%) | 4 (1.1%) |
| $7,500 to $9,999 | 14 (3.7%) | 0 (0.0%) |
| $10,000 to $12,499 | 0 (0.0%) | 16 (4.4%) |
| $12,500 to $14,999 | 0 (0.0%) | 7 (1.9%) |
| $15,000 to $17,499 | 3 (0.8%) | 4 (1.1%) |
| $17,500 to $19,999 | 0 (0.0%) | 66 (18.3%) |
| $20,000 to $22,499 | 0 (0.0%) | 3 (0.8%) |
| $22,500 to $24,999 | 5 (1.3%) | 12 (3.3%) |
| $25,000 to $29,999 | 54 (14.4%) | 13 (3.6%) |
| $30,000 to $34,999 | 9 (2.4%) | 4 (1.1%) |
| $35,000 to $39,999 | 24 (6.4%) | 4 (1.1%) |
| $40,000 to $44,999 | 0 (0.0%) | 8 (2.2%) |
| $45,000 to $49,999 | 3 (0.8%) | 28 (7.8%) |
| $50,000 to $54,999 | 24 (6.4%) | 13 (3.6%) |
| $55,000 to $64,999 | 20 (5.3%) | 12 (3.3%) |
| $65,000 to $74,999 | 28 (7.4%) | 35 (9.7%) |
| $75,000 to $99,999 | 63 (16.8%) | 41 (11.4%) |
| $100,000+ | 101 (26.9%) | 35 (9.7%) |
| Total | 376 (100.0%) | 361 (100.0%) |
Earnings by Sex by Educational Attainment in New Windsor
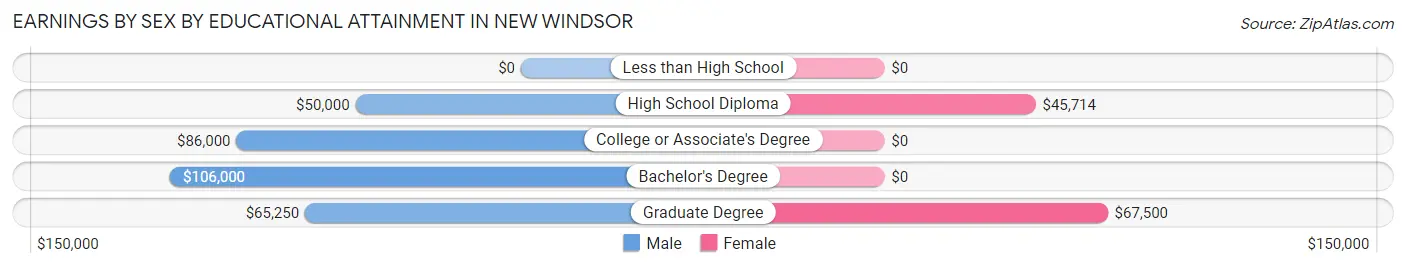
| Educational Attainment | Male Income | Female Income |
| Less than High School | - | - |
| High School Diploma | $50,000 | $45,714 |
| College or Associate's Degree | $86,000 | $0 |
| Bachelor's Degree | $106,000 | $0 |
| Graduate Degree | $65,250 | $67,500 |
| Total | $70,703 | $0 |
Family Income in New Windsor
Family Income Brackets in New Windsor
According to the New Windsor family income data, there are 119 families falling into the $75,000 to $99,999 income range, which is the most common income bracket and makes up 28.5% of all families.
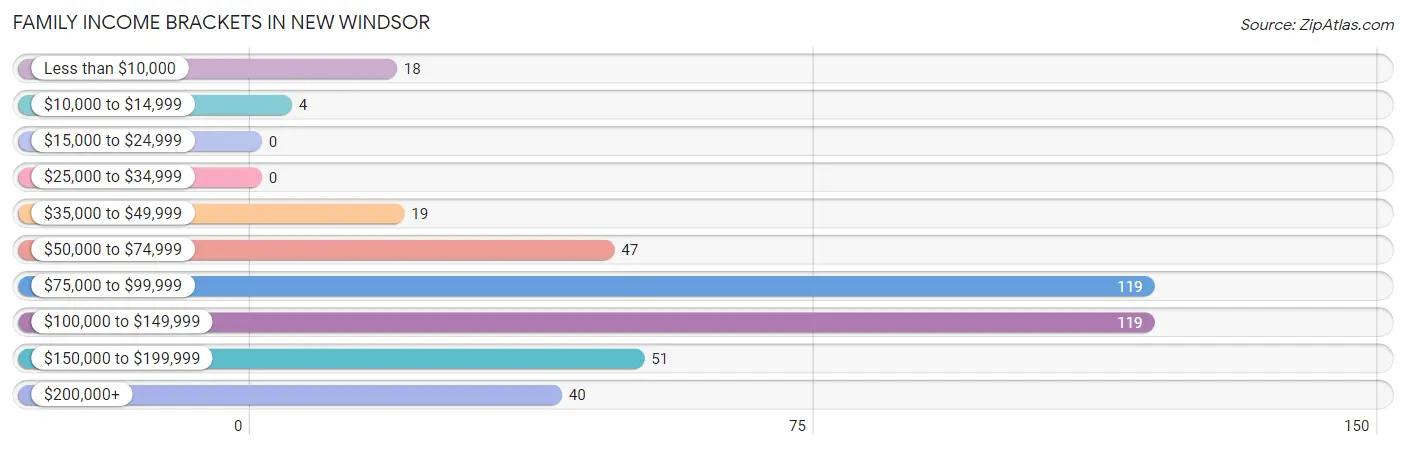
| Income Bracket | # Families | % Families |
| Less than $10,000 | 18 | 4.3% |
| $10,000 to $14,999 | 4 | 1.0% |
| $15,000 to $24,999 | 0 | 0.0% |
| $25,000 to $34,999 | 0 | 0.0% |
| $35,000 to $49,999 | 19 | 4.6% |
| $50,000 to $74,999 | 47 | 11.3% |
| $75,000 to $99,999 | 119 | 28.5% |
| $100,000 to $149,999 | 119 | 28.5% |
| $150,000 to $199,999 | 51 | 12.2% |
| $200,000+ | 40 | 9.6% |
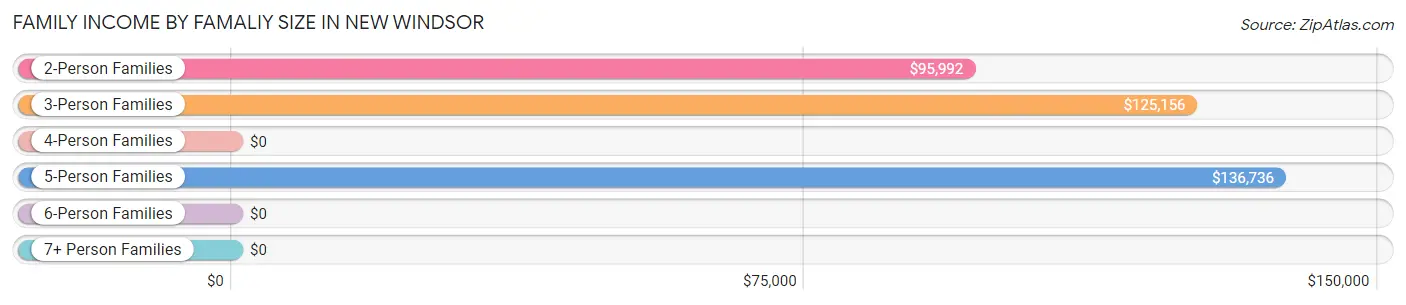
Family Income by Famaliy Size in New Windsor
5-person families (25 | 6.0%) account for the highest median family income in New Windsor with $136,736 per family, while 2-person families (256 | 61.4%) have the highest median income of $47,996 per family member.
| Income Bracket | # Families | Median Income |
| 2-Person Families | 256 (61.4%) | $95,992 |
| 3-Person Families | 65 (15.6%) | $125,156 |
| 4-Person Families | 66 (15.8%) | $0 |
| 5-Person Families | 25 (6.0%) | $136,736 |
| 6-Person Families | 5 (1.2%) | $0 |
| 7+ Person Families | 0 (0.0%) | $0 |
| Total | 417 (100.0%) | $103,250 |
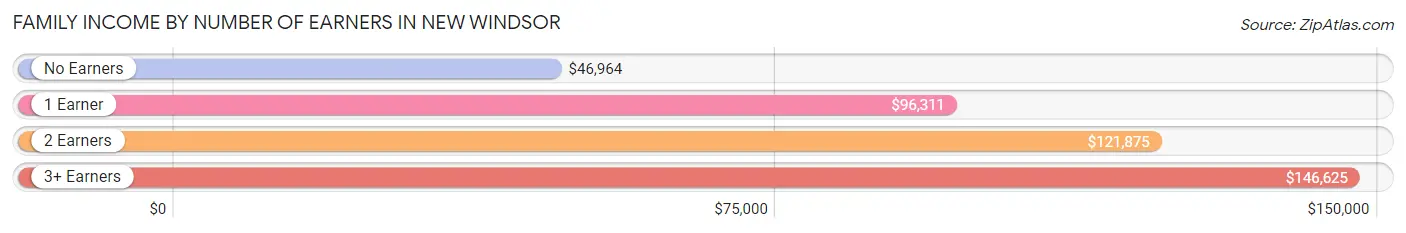
Family Income by Number of Earners in New Windsor
The median family income in New Windsor is $103,250, with families comprising 3+ earners (37) having the highest median family income of $146,625, while families with no earners (47) have the lowest median family income of $46,964, accounting for 8.9% and 11.3% of families, respectively.
| Number of Earners | # Families | Median Income |
| No Earners | 47 (11.3%) | $46,964 |
| 1 Earner | 174 (41.7%) | $96,311 |
| 2 Earners | 159 (38.1%) | $121,875 |
| 3+ Earners | 37 (8.9%) | $146,625 |
| Total | 417 (100.0%) | $103,250 |
Household Income in New Windsor
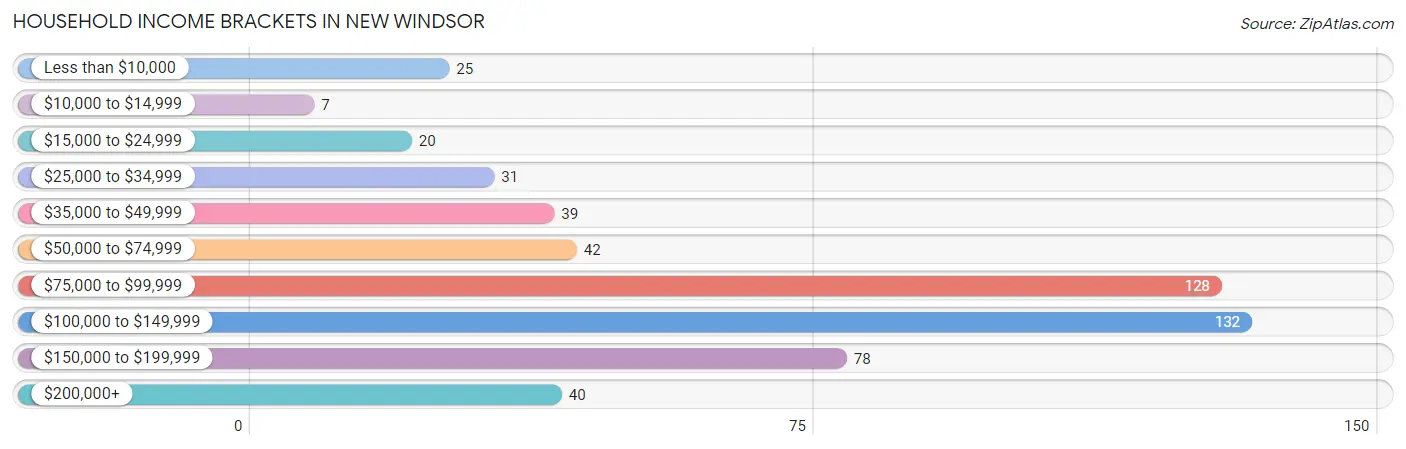
Household Income Brackets in New Windsor
With 132 households falling in the category, the $100,000 to $149,999 income range is the most frequent in New Windsor, accounting for 24.3% of all households. In contrast, only 7 households (1.3%) fall into the $10,000 to $14,999 income bracket, making it the least populous group.
| Income Bracket | # Households | % Households |
| Less than $10,000 | 25 | 4.6% |
| $10,000 to $14,999 | 7 | 1.3% |
| $15,000 to $24,999 | 20 | 3.7% |
| $25,000 to $34,999 | 31 | 5.7% |
| $35,000 to $49,999 | 39 | 7.2% |
| $50,000 to $74,999 | 42 | 7.7% |
| $75,000 to $99,999 | 128 | 23.6% |
| $100,000 to $149,999 | 132 | 24.4% |
| $150,000 to $199,999 | 78 | 14.4% |
| $200,000+ | 40 | 7.4% |
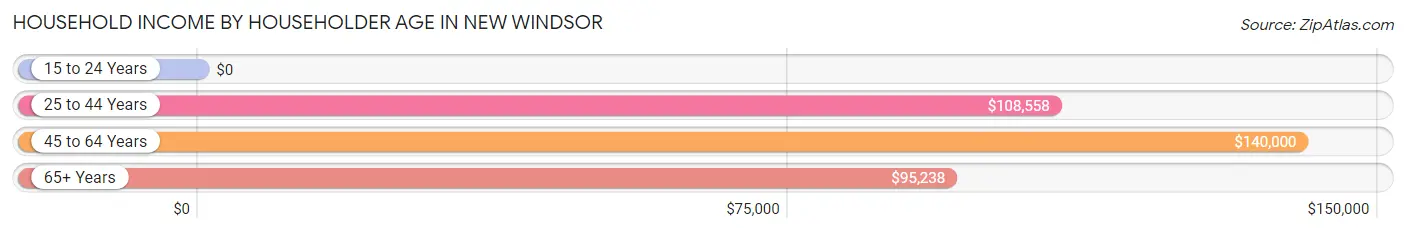
Household Income by Householder Age in New Windsor
The median household income in New Windsor is $96,667, with the highest median household income of $140,000 found in the 45 to 64 years age bracket for the primary householder. A total of 204 households (37.6%) fall into this category. Meanwhile, the 15 to 24 years age bracket for the primary householder has the lowest median household income of $0, with 11 households (2.0%) in this group.
| Income Bracket | # Households | Median Income |
| 15 to 24 Years | 11 (2.0%) | $0 |
| 25 to 44 Years | 121 (22.3%) | $108,558 |
| 45 to 64 Years | 204 (37.6%) | $140,000 |
| 65+ Years | 206 (38.0%) | $95,238 |
| Total | 542 (100.0%) | $96,667 |
Poverty in New Windsor
Income Below Poverty by Sex and Age in New Windsor
With 5.6% poverty level for males and 14.1% for females among the residents of New Windsor, 75 year old and over males and 12 to 14 year old females are the most vulnerable to poverty, with 14 males (35.0%) and 20 females (60.6%) in their respective age groups living below the poverty level.
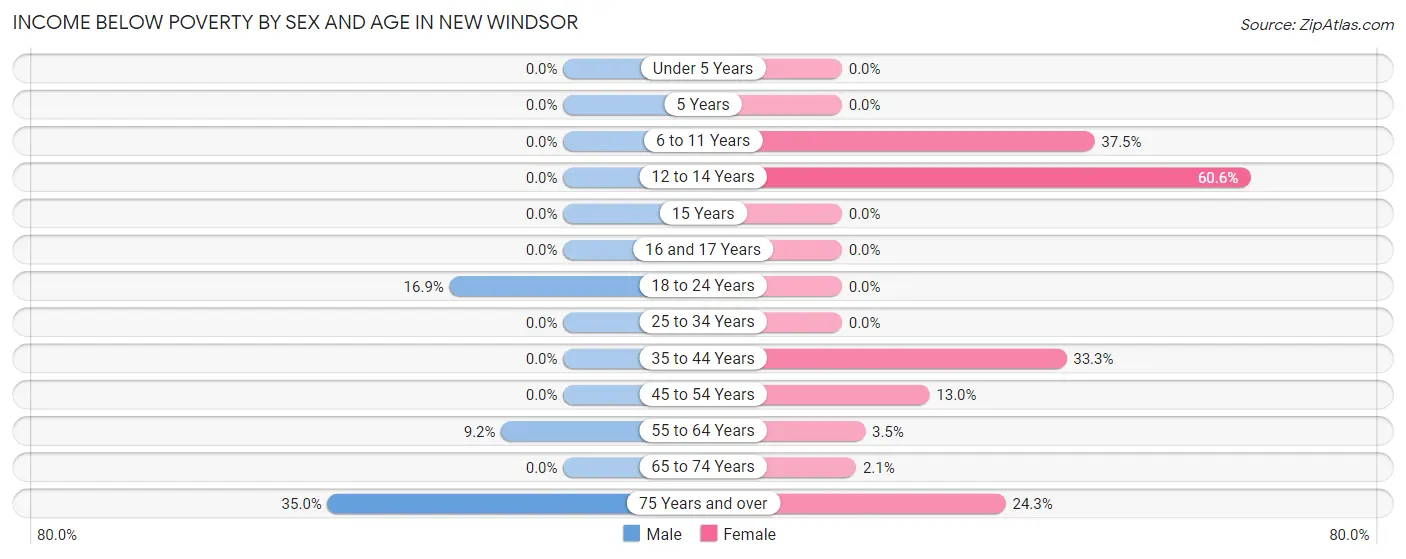
| Age Bracket | Male | Female |
| Under 5 Years | 0 (0.0%) | 0 (0.0%) |
| 5 Years | 0 (0.0%) | 0 (0.0%) |
| 6 to 11 Years | 0 (0.0%) | 21 (37.5%) |
| 12 to 14 Years | 0 (0.0%) | 20 (60.6%) |
| 15 Years | 0 (0.0%) | 0 (0.0%) |
| 16 and 17 Years | 0 (0.0%) | 0 (0.0%) |
| 18 to 24 Years | 13 (16.9%) | 0 (0.0%) |
| 25 to 34 Years | 0 (0.0%) | 0 (0.0%) |
| 35 to 44 Years | 0 (0.0%) | 18 (33.3%) |
| 45 to 54 Years | 0 (0.0%) | 13 (13.0%) |
| 55 to 64 Years | 8 (9.2%) | 3 (3.5%) |
| 65 to 74 Years | 0 (0.0%) | 3 (2.1%) |
| 75 Years and over | 14 (35.0%) | 18 (24.3%) |
| Total | 35 (5.6%) | 96 (14.1%) |
Income Above Poverty by Sex and Age in New Windsor
According to the poverty statistics in New Windsor, males aged under 5 years and females aged under 5 years are the age groups that are most secure financially, with 100.0% of males and 100.0% of females in these age groups living above the poverty line.
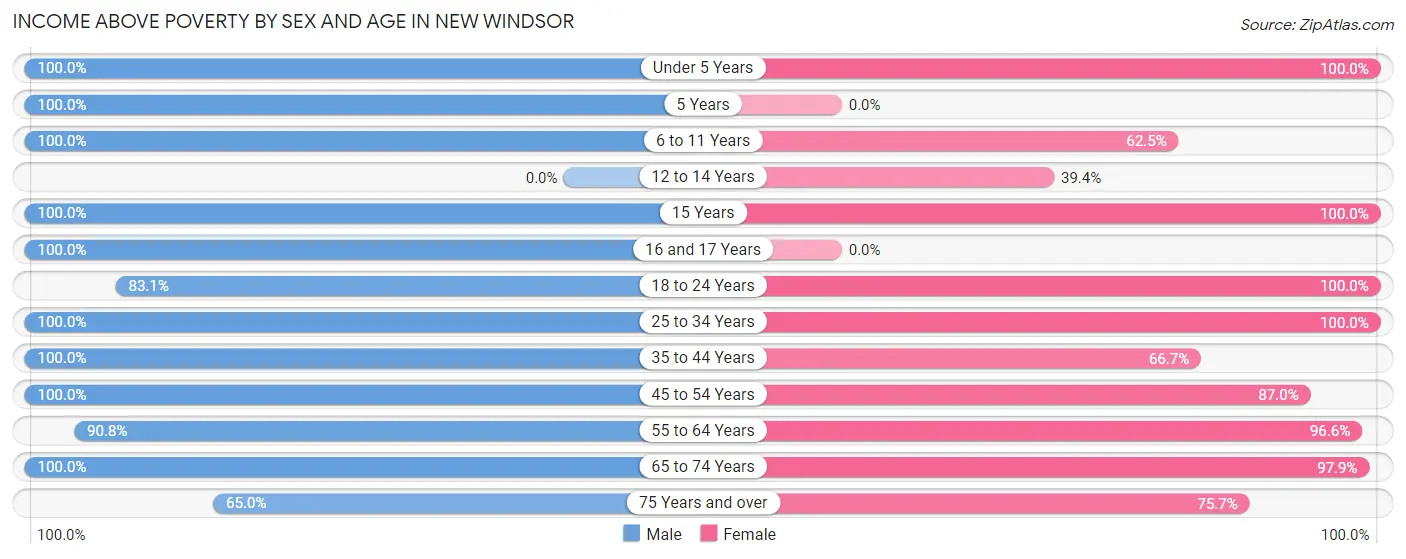
| Age Bracket | Male | Female |
| Under 5 Years | 22 (100.0%) | 22 (100.0%) |
| 5 Years | 9 (100.0%) | 0 (0.0%) |
| 6 to 11 Years | 29 (100.0%) | 35 (62.5%) |
| 12 to 14 Years | 0 (0.0%) | 13 (39.4%) |
| 15 Years | 5 (100.0%) | 2 (100.0%) |
| 16 and 17 Years | 34 (100.0%) | 0 (0.0%) |
| 18 to 24 Years | 64 (83.1%) | 39 (100.0%) |
| 25 to 34 Years | 64 (100.0%) | 69 (100.0%) |
| 35 to 44 Years | 54 (100.0%) | 36 (66.7%) |
| 45 to 54 Years | 105 (100.0%) | 87 (87.0%) |
| 55 to 64 Years | 79 (90.8%) | 84 (96.6%) |
| 65 to 74 Years | 99 (100.0%) | 140 (97.9%) |
| 75 Years and over | 26 (65.0%) | 56 (75.7%) |
| Total | 590 (94.4%) | 583 (85.9%) |
Income Below Poverty Among Married-Couple Families in New Windsor
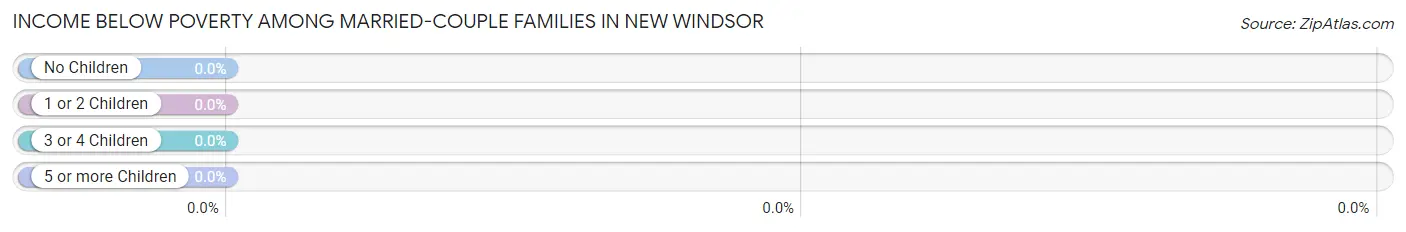
| Children | Above Poverty | Below Poverty |
| No Children | 276 (100.0%) | 0 (0.0%) |
| 1 or 2 Children | 82 (100.0%) | 0 (0.0%) |
| 3 or 4 Children | 7 (100.0%) | 0 (0.0%) |
| 5 or more Children | 0 (0.0%) | 0 (0.0%) |
| Total | 365 (100.0%) | 0 (0.0%) |
Income Below Poverty Among Single-Parent Households in New Windsor
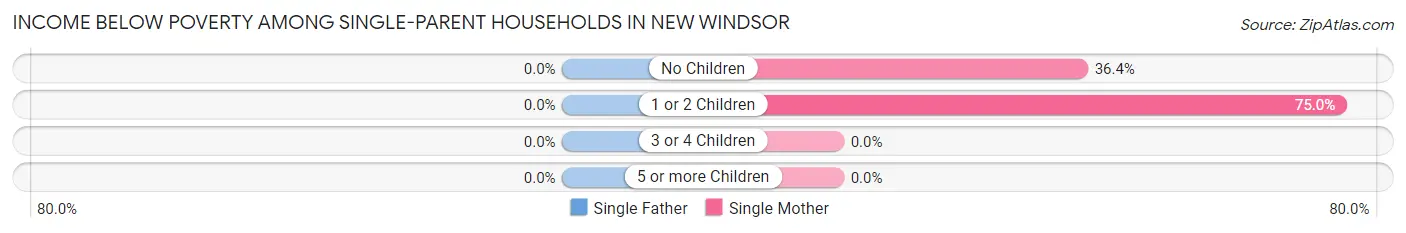
| Children | Single Father | Single Mother |
| No Children | 0 (0.0%) | 4 (36.4%) |
| 1 or 2 Children | 0 (0.0%) | 18 (75.0%) |
| 3 or 4 Children | 0 (0.0%) | 0 (0.0%) |
| 5 or more Children | 0 (0.0%) | 0 (0.0%) |
| Total | 0 (0.0%) | 22 (62.9%) |
Income Below Poverty Among Married-Couple vs Single-Parent Households in New Windsor
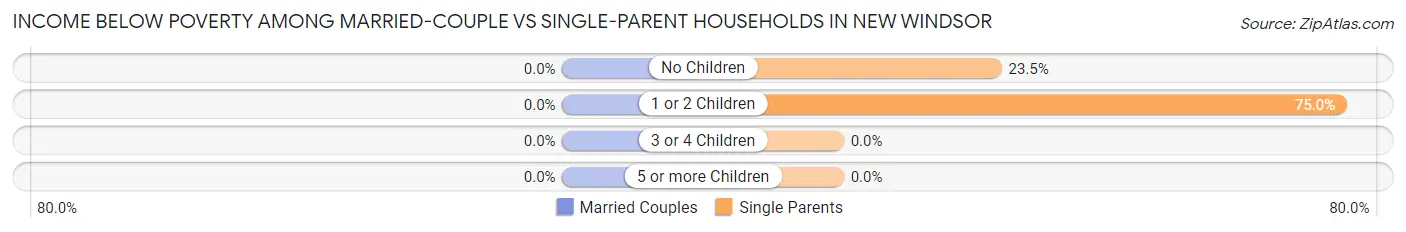
| Children | Married-Couple Families | Single-Parent Households |
| No Children | 0 (0.0%) | 4 (23.5%) |
| 1 or 2 Children | 0 (0.0%) | 18 (75.0%) |
| 3 or 4 Children | 0 (0.0%) | 0 (0.0%) |
| 5 or more Children | 0 (0.0%) | 0 (0.0%) |
| Total | 0 (0.0%) | 22 (42.3%) |
Employment Characteristics in New Windsor
Employment by Class of Employer in New Windsor
Among the 586 employed individuals in New Windsor, private company employees (338 | 57.7%), local government employees (73 | 12.5%), and not-for-profit organizations (62 | 10.6%) make up the most common classes of employment.
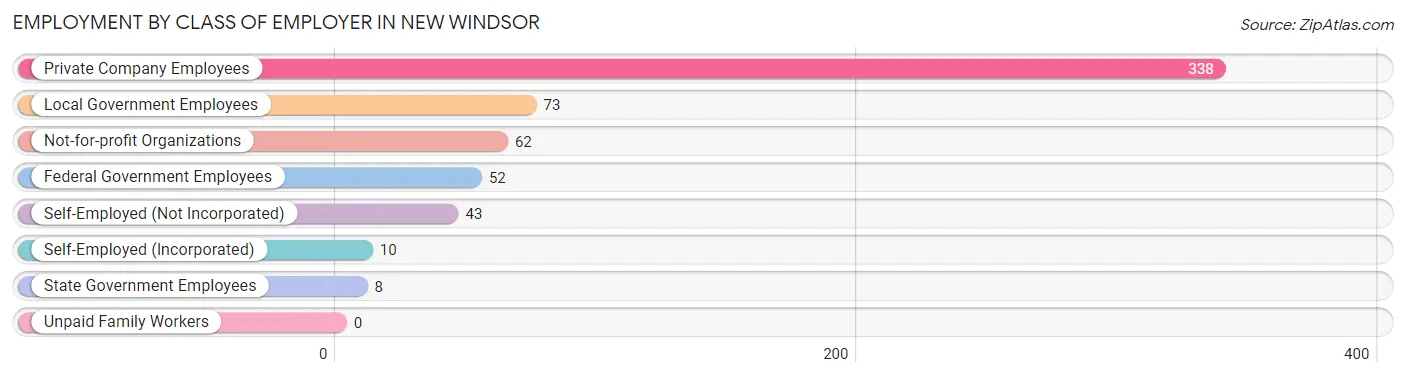
| Employer Class | # Employees | % Employees |
| Private Company Employees | 338 | 57.7% |
| Self-Employed (Incorporated) | 10 | 1.7% |
| Self-Employed (Not Incorporated) | 43 | 7.3% |
| Not-for-profit Organizations | 62 | 10.6% |
| Local Government Employees | 73 | 12.5% |
| State Government Employees | 8 | 1.4% |
| Federal Government Employees | 52 | 8.9% |
| Unpaid Family Workers | 0 | 0.0% |
| Total | 586 | 100.0% |
Employment Status by Age in New Windsor
According to the labor force statistics for New Windsor, out of the total population over 16 years of age (1,126), 59.8% or 673 individuals are in the labor force, with 12.9% or 87 of them unemployed. The age group with the highest labor force participation rate is 30 to 34 years, with 100.0% or 78 individuals in the labor force. Within the labor force, the 65 to 74 years age range has the highest percentage of unemployed individuals, with 52.6% or 61 of them being unemployed.
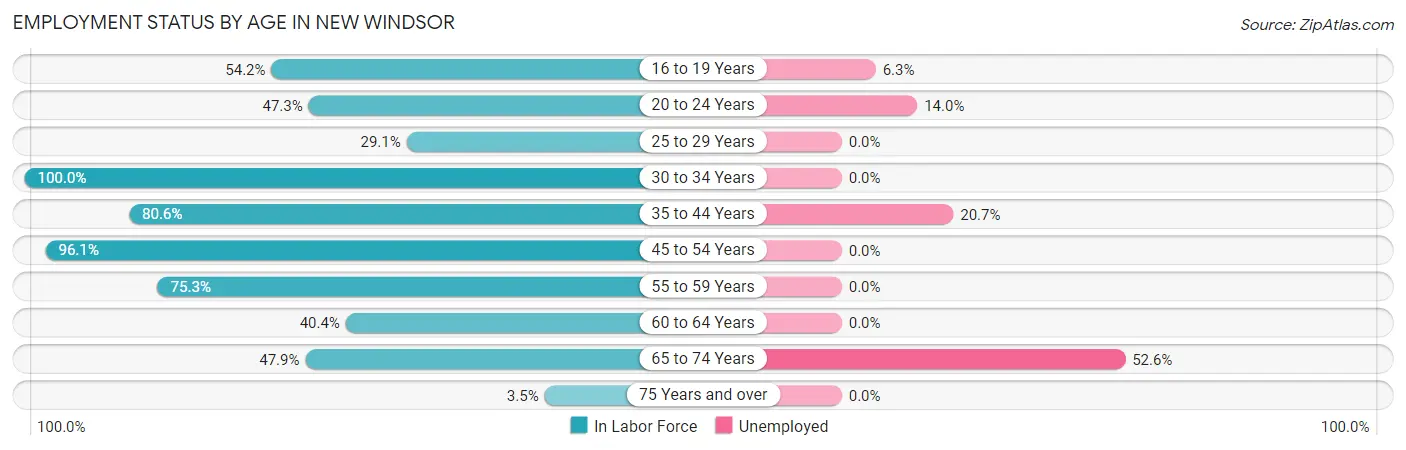
| Age Bracket | In Labor Force | Unemployed |
| 16 to 19 Years | 32 (54.2%) | 2 (6.3%) |
| 20 to 24 Years | 43 (47.3%) | 6 (14.0%) |
| 25 to 29 Years | 16 (29.1%) | 0 (0.0%) |
| 30 to 34 Years | 78 (100.0%) | 0 (0.0%) |
| 35 to 44 Years | 87 (80.6%) | 18 (20.7%) |
| 45 to 54 Years | 197 (96.1%) | 0 (0.0%) |
| 55 to 59 Years | 64 (75.3%) | 0 (0.0%) |
| 60 to 64 Years | 36 (40.4%) | 0 (0.0%) |
| 65 to 74 Years | 116 (47.9%) | 61 (52.6%) |
| 75 Years and over | 4 (3.5%) | 0 (0.0%) |
| Total | 673 (59.8%) | 87 (12.9%) |
Employment Status by Educational Attainment in New Windsor
According to labor force statistics for New Windsor, 77.1% of individuals (478) out of the total population between 25 and 64 years of age (620) are in the labor force, with 3.8% or 18 of them being unemployed. The group with the highest labor force participation rate are those with the educational attainment of high school diploma, with 87.8% or 137 individuals in the labor force. Within the labor force, individuals with high school diploma education have the highest percentage of unemployment, with 13.1% or 18 of them being unemployed.
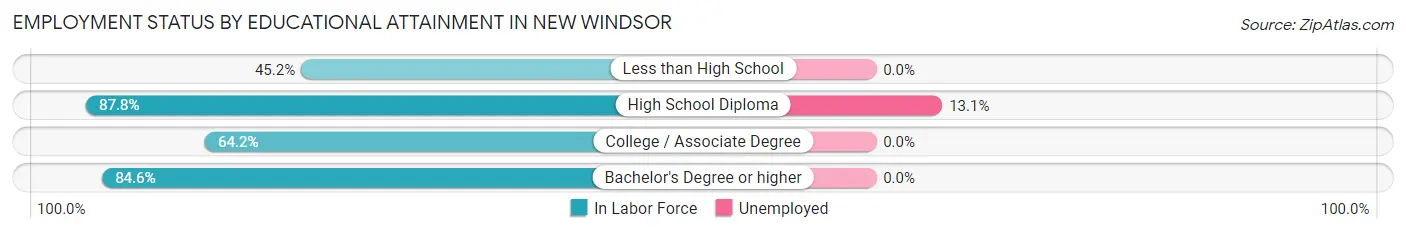
| Educational Attainment | In Labor Force | Unemployed |
| Less than High School | 14 (45.2%) | 0 (0.0%) |
| High School Diploma | 137 (87.8%) | 20 (13.1%) |
| College / Associate Degree | 124 (64.2%) | 0 (0.0%) |
| Bachelor's Degree or higher | 203 (84.6%) | 0 (0.0%) |
| Total | 478 (77.1%) | 24 (3.8%) |
Employment Occupations by Sex in New Windsor
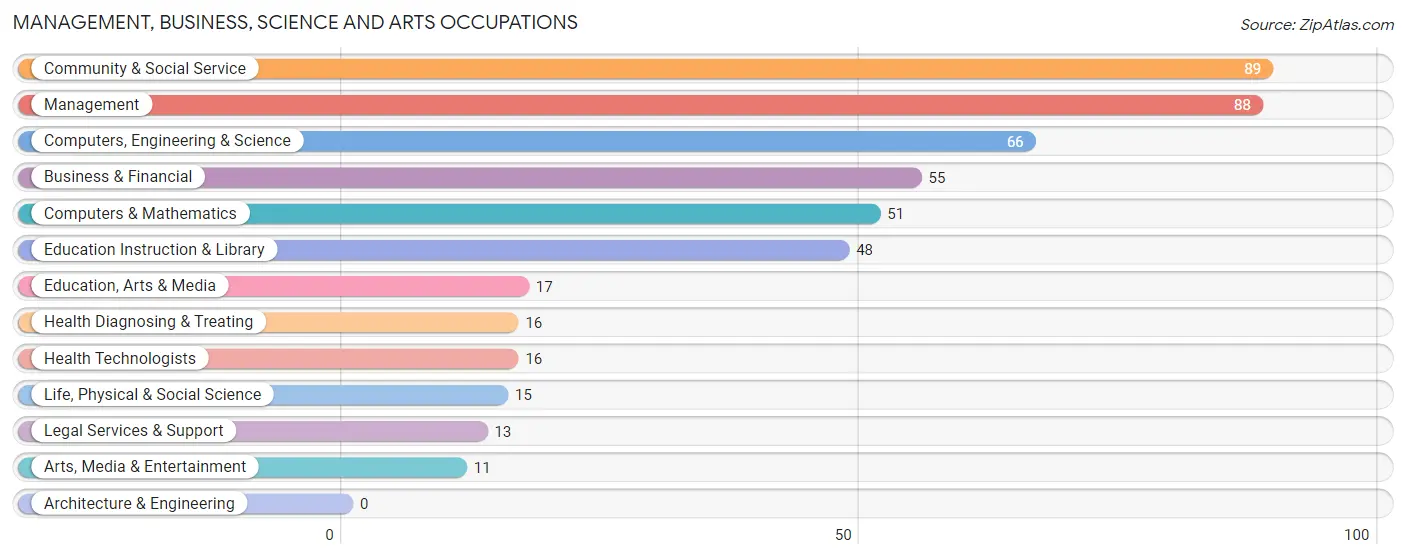
Management, Business, Science and Arts Occupations
The most common Management, Business, Science and Arts occupations in New Windsor are Community & Social Service (89 | 15.2%), Management (88 | 15.0%), Computers, Engineering & Science (66 | 11.3%), Business & Financial (55 | 9.4%), and Computers & Mathematics (51 | 8.7%).
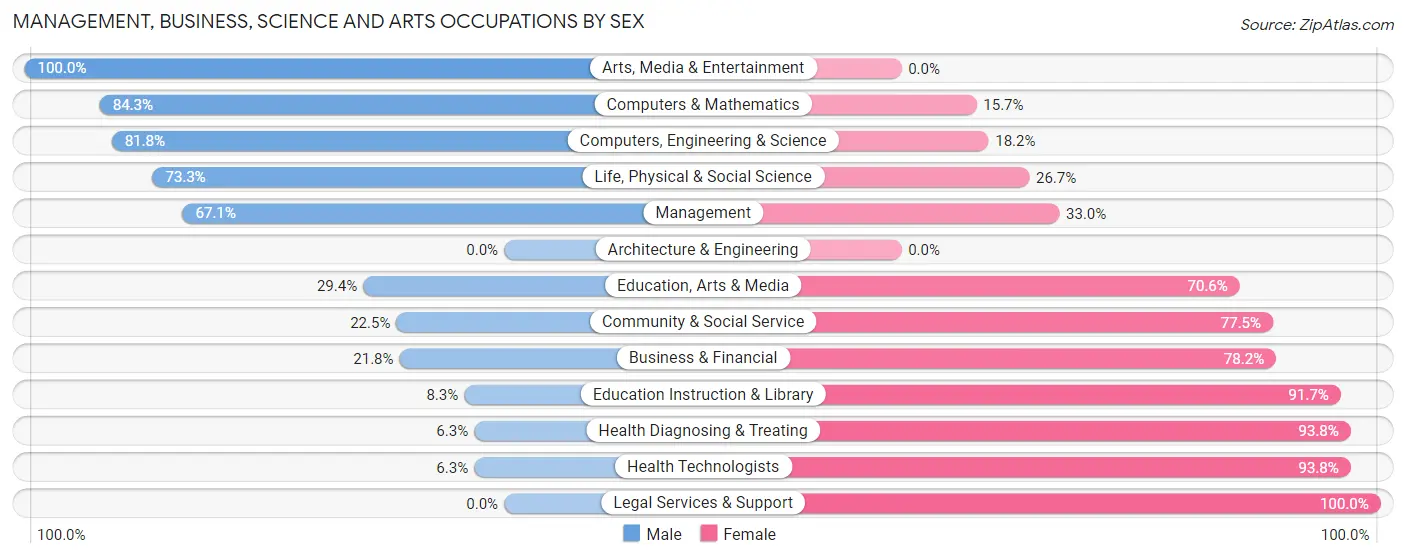
Management, Business, Science and Arts Occupations by Sex
Within the Management, Business, Science and Arts occupations in New Windsor, the most male-oriented occupations are Arts, Media & Entertainment (100.0%), Computers & Mathematics (84.3%), and Computers, Engineering & Science (81.8%), while the most female-oriented occupations are Legal Services & Support (100.0%), Health Diagnosing & Treating (93.8%), and Health Technologists (93.8%).
| Occupation | Male | Female |
| Management | 59 (67.0%) | 29 (33.0%) |
| Business & Financial | 12 (21.8%) | 43 (78.2%) |
| Computers, Engineering & Science | 54 (81.8%) | 12 (18.2%) |
| Computers & Mathematics | 43 (84.3%) | 8 (15.7%) |
| Architecture & Engineering | 0 (0.0%) | 0 (0.0%) |
| Life, Physical & Social Science | 11 (73.3%) | 4 (26.7%) |
| Community & Social Service | 20 (22.5%) | 69 (77.5%) |
| Education, Arts & Media | 5 (29.4%) | 12 (70.6%) |
| Legal Services & Support | 0 (0.0%) | 13 (100.0%) |
| Education Instruction & Library | 4 (8.3%) | 44 (91.7%) |
| Arts, Media & Entertainment | 11 (100.0%) | 0 (0.0%) |
| Health Diagnosing & Treating | 1 (6.2%) | 15 (93.8%) |
| Health Technologists | 1 (6.2%) | 15 (93.8%) |
| Total (Category) | 146 (46.5%) | 168 (53.5%) |
| Total (Overall) | 331 (56.5%) | 255 (43.5%) |
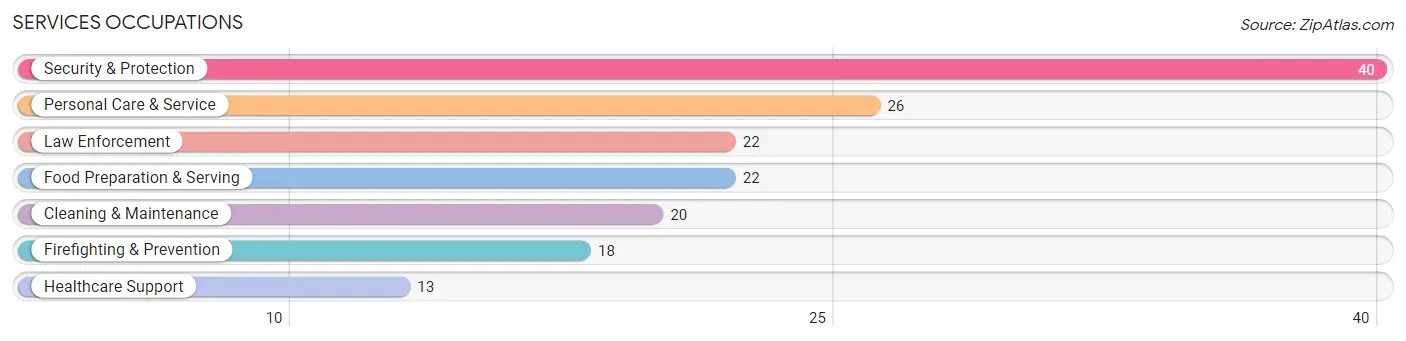
Services Occupations
The most common Services occupations in New Windsor are Security & Protection (40 | 6.8%), Personal Care & Service (26 | 4.4%), Law Enforcement (22 | 3.7%), Food Preparation & Serving (22 | 3.7%), and Cleaning & Maintenance (20 | 3.4%).
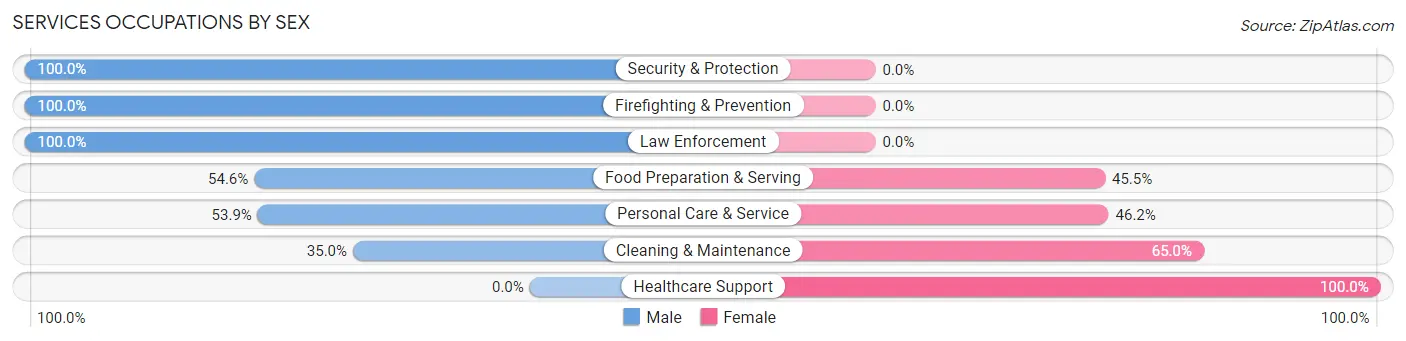
Services Occupations by Sex
Within the Services occupations in New Windsor, the most male-oriented occupations are Security & Protection (100.0%), Firefighting & Prevention (100.0%), and Law Enforcement (100.0%), while the most female-oriented occupations are Healthcare Support (100.0%), Cleaning & Maintenance (65.0%), and Personal Care & Service (46.2%).
| Occupation | Male | Female |
| Healthcare Support | 0 (0.0%) | 13 (100.0%) |
| Security & Protection | 40 (100.0%) | 0 (0.0%) |
| Firefighting & Prevention | 18 (100.0%) | 0 (0.0%) |
| Law Enforcement | 22 (100.0%) | 0 (0.0%) |
| Food Preparation & Serving | 12 (54.5%) | 10 (45.5%) |
| Cleaning & Maintenance | 7 (35.0%) | 13 (65.0%) |
| Personal Care & Service | 14 (53.8%) | 12 (46.2%) |
| Total (Category) | 73 (60.3%) | 48 (39.7%) |
| Total (Overall) | 331 (56.5%) | 255 (43.5%) |
Sales and Office Occupations
The most common Sales and Office occupations in New Windsor are Sales & Related (52 | 8.9%), and Office & Administration (27 | 4.6%).
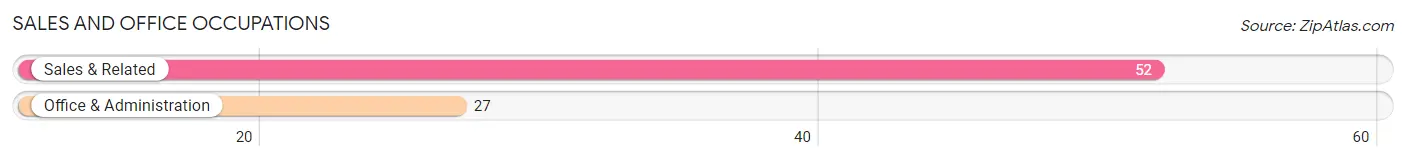
Sales and Office Occupations by Sex

| Occupation | Male | Female |
| Sales & Related | 48 (92.3%) | 4 (7.7%) |
| Office & Administration | 5 (18.5%) | 22 (81.5%) |
| Total (Category) | 53 (67.1%) | 26 (32.9%) |
| Total (Overall) | 331 (56.5%) | 255 (43.5%) |
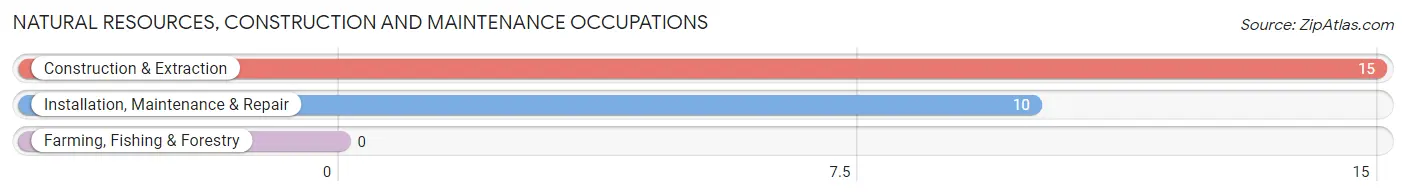
Natural Resources, Construction and Maintenance Occupations
The most common Natural Resources, Construction and Maintenance occupations in New Windsor are Construction & Extraction (15 | 2.6%), and Installation, Maintenance & Repair (10 | 1.7%).
Natural Resources, Construction and Maintenance Occupations by Sex
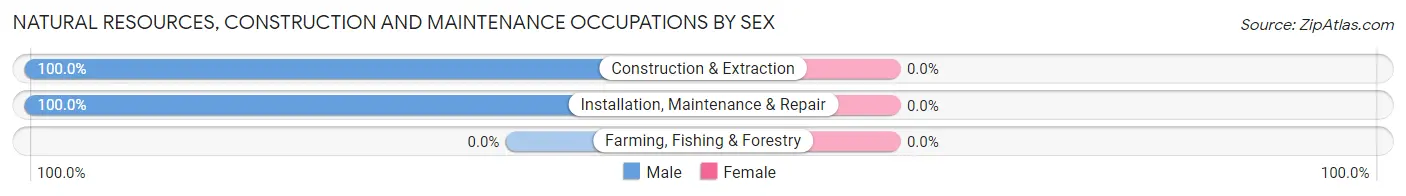
| Occupation | Male | Female |
| Farming, Fishing & Forestry | 0 (0.0%) | 0 (0.0%) |
| Construction & Extraction | 15 (100.0%) | 0 (0.0%) |
| Installation, Maintenance & Repair | 10 (100.0%) | 0 (0.0%) |
| Total (Category) | 25 (100.0%) | 0 (0.0%) |
| Total (Overall) | 331 (56.5%) | 255 (43.5%) |
Production, Transportation and Moving Occupations
The most common Production, Transportation and Moving occupations in New Windsor are Production (35 | 6.0%), Transportation (9 | 1.5%), and Material Moving (3 | 0.5%).
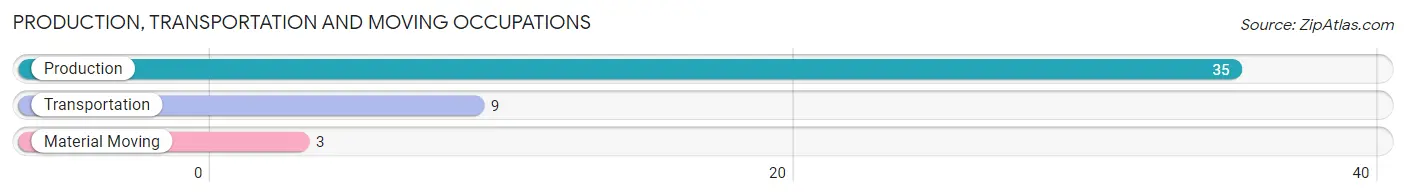
Production, Transportation and Moving Occupations by Sex
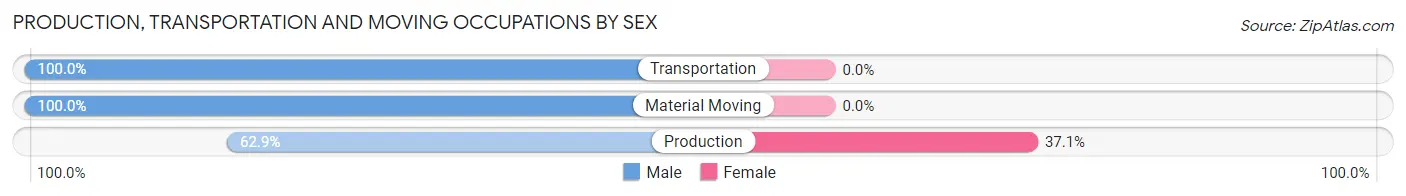
| Occupation | Male | Female |
| Production | 22 (62.9%) | 13 (37.1%) |
| Transportation | 9 (100.0%) | 0 (0.0%) |
| Material Moving | 3 (100.0%) | 0 (0.0%) |
| Total (Category) | 34 (72.3%) | 13 (27.7%) |
| Total (Overall) | 331 (56.5%) | 255 (43.5%) |
Employment Industries by Sex in New Windsor
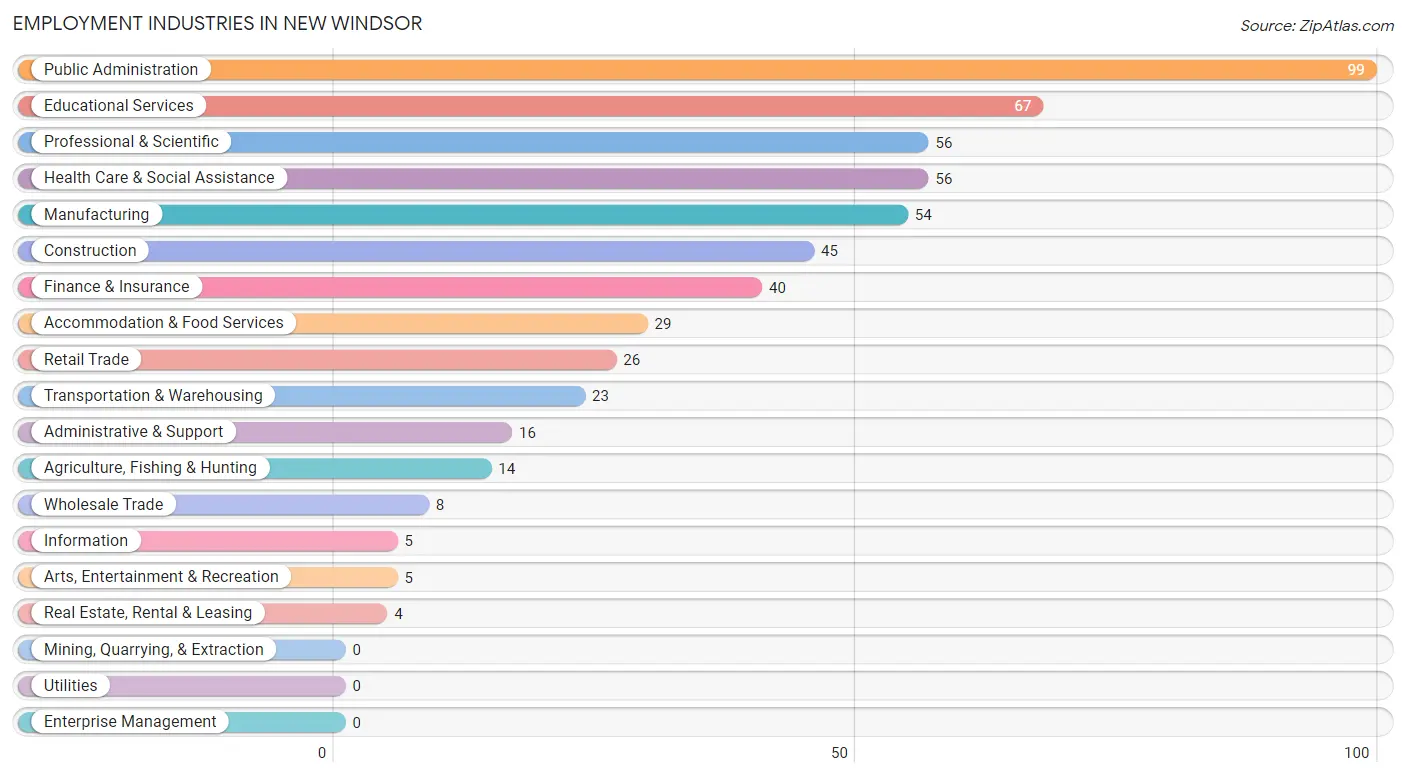
Employment Industries in New Windsor
The major employment industries in New Windsor include Public Administration (99 | 16.9%), Educational Services (67 | 11.4%), Professional & Scientific (56 | 9.6%), Health Care & Social Assistance (56 | 9.6%), and Manufacturing (54 | 9.2%).
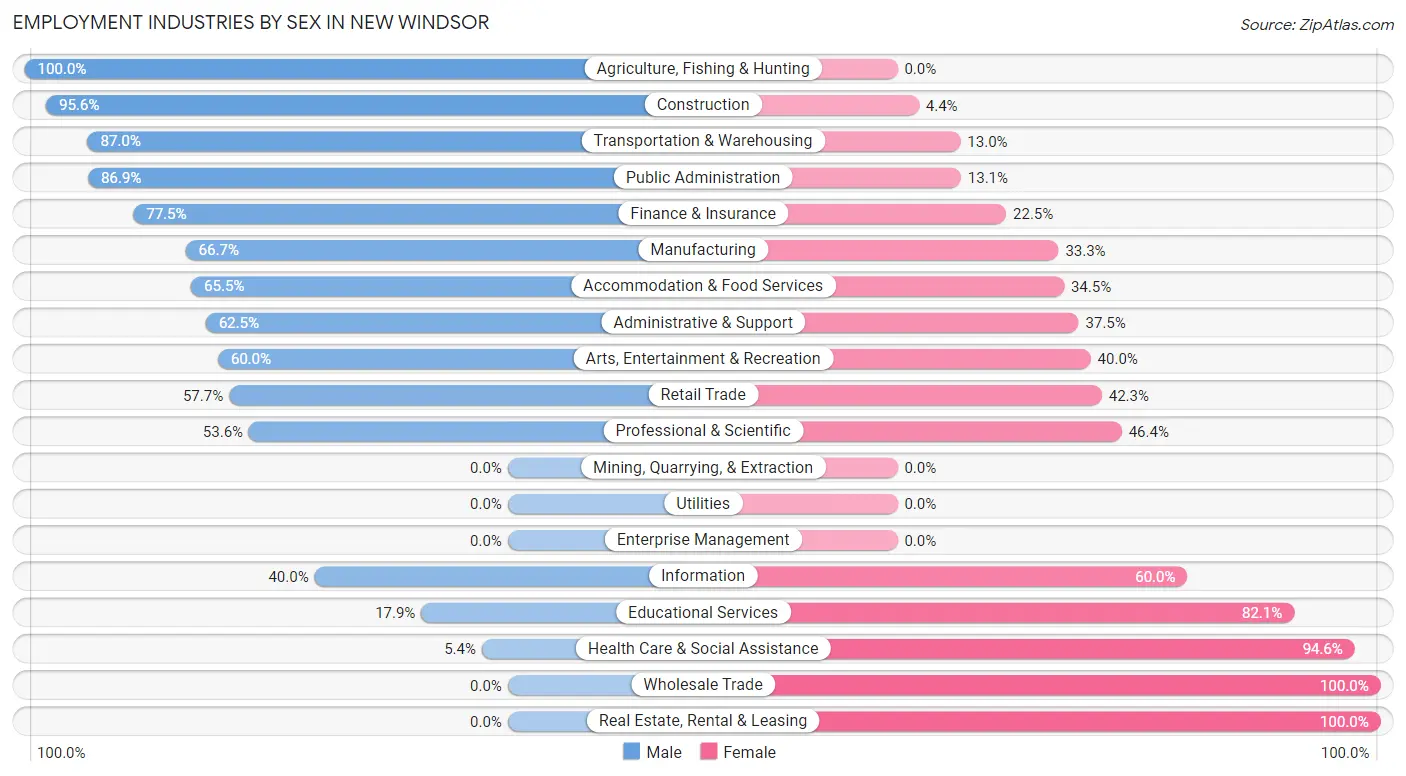
Employment Industries by Sex in New Windsor
The New Windsor industries that see more men than women are Agriculture, Fishing & Hunting (100.0%), Construction (95.6%), and Transportation & Warehousing (87.0%), whereas the industries that tend to have a higher number of women are Wholesale Trade (100.0%), Real Estate, Rental & Leasing (100.0%), and Health Care & Social Assistance (94.6%).
| Industry | Male | Female |
| Agriculture, Fishing & Hunting | 14 (100.0%) | 0 (0.0%) |
| Mining, Quarrying, & Extraction | 0 (0.0%) | 0 (0.0%) |
| Construction | 43 (95.6%) | 2 (4.4%) |
| Manufacturing | 36 (66.7%) | 18 (33.3%) |
| Wholesale Trade | 0 (0.0%) | 8 (100.0%) |
| Retail Trade | 15 (57.7%) | 11 (42.3%) |
| Transportation & Warehousing | 20 (87.0%) | 3 (13.0%) |
| Utilities | 0 (0.0%) | 0 (0.0%) |
| Information | 2 (40.0%) | 3 (60.0%) |
| Finance & Insurance | 31 (77.5%) | 9 (22.5%) |
| Real Estate, Rental & Leasing | 0 (0.0%) | 4 (100.0%) |
| Professional & Scientific | 30 (53.6%) | 26 (46.4%) |
| Enterprise Management | 0 (0.0%) | 0 (0.0%) |
| Administrative & Support | 10 (62.5%) | 6 (37.5%) |
| Educational Services | 12 (17.9%) | 55 (82.1%) |
| Health Care & Social Assistance | 3 (5.4%) | 53 (94.6%) |
| Arts, Entertainment & Recreation | 3 (60.0%) | 2 (40.0%) |
| Accommodation & Food Services | 19 (65.5%) | 10 (34.5%) |
| Public Administration | 86 (86.9%) | 13 (13.1%) |
| Total | 331 (56.5%) | 255 (43.5%) |
Education in New Windsor
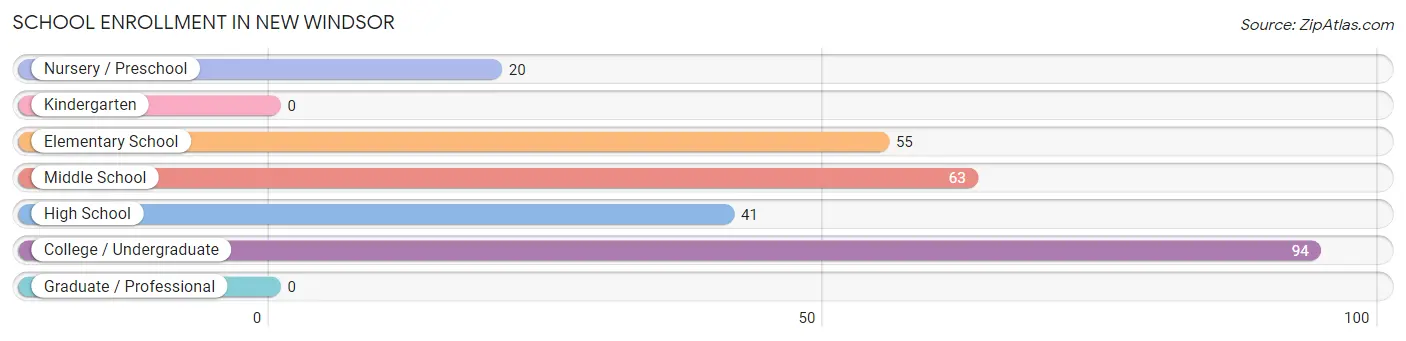
School Enrollment in New Windsor
The most common levels of schooling among the 273 students in New Windsor are college / undergraduate (94 | 34.4%), middle school (63 | 23.1%), and elementary school (55 | 20.2%).
| School Level | # Students | % Students |
| Nursery / Preschool | 20 | 7.3% |
| Kindergarten | 0 | 0.0% |
| Elementary School | 55 | 20.2% |
| Middle School | 63 | 23.1% |
| High School | 41 | 15.0% |
| College / Undergraduate | 94 | 34.4% |
| Graduate / Professional | 0 | 0.0% |
| Total | 273 | 100.0% |
School Enrollment by Age by Funding Source in New Windsor
Out of a total of 273 students who are enrolled in schools in New Windsor, 130 (47.6%) attend a private institution, while the remaining 143 (52.4%) are enrolled in public schools. The age group of 3 to 4 year olds has the highest likelihood of being enrolled in private schools, with 11 (100.0% in the age bracket) enrolled. Conversely, the age group of 35 years and over has the lowest likelihood of being enrolled in a private school, with 19 (100.0% in the age bracket) attending a public institution.
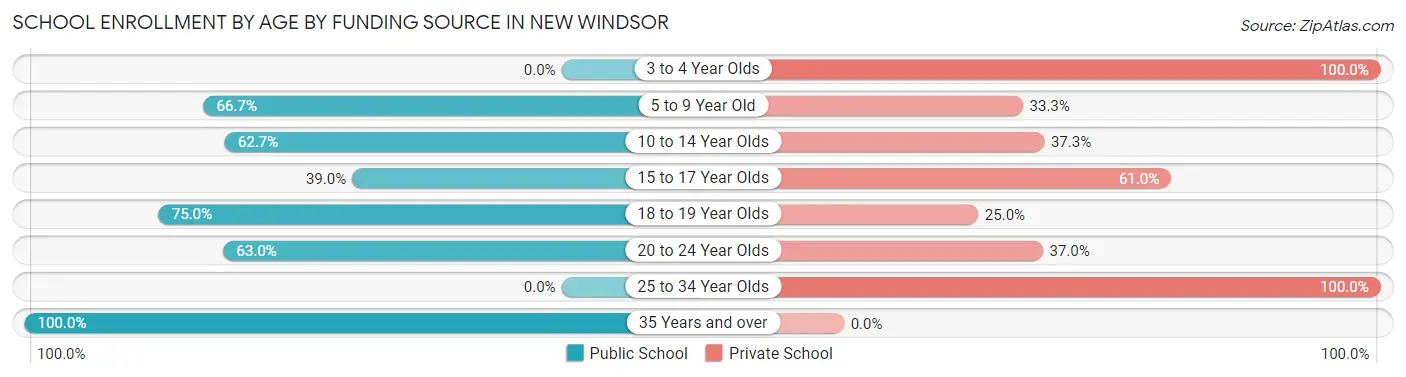
| Age Bracket | Public School | Private School |
| 3 to 4 Year Olds | 0 (0.0%) | 11 (100.0%) |
| 5 to 9 Year Old | 40 (66.7%) | 20 (33.3%) |
| 10 to 14 Year Olds | 42 (62.7%) | 25 (37.3%) |
| 15 to 17 Year Olds | 16 (39.0%) | 25 (61.0%) |
| 18 to 19 Year Olds | 9 (75.0%) | 3 (25.0%) |
| 20 to 24 Year Olds | 17 (63.0%) | 10 (37.0%) |
| 25 to 34 Year Olds | 0 (0.0%) | 36 (100.0%) |
| 35 Years and over | 19 (100.0%) | 0 (0.0%) |
| Total | 143 (52.4%) | 130 (47.6%) |
Educational Attainment by Field of Study in New Windsor
Business (122 | 27.2%), social sciences (76 | 16.9%), education (65 | 14.5%), physical & health sciences (33 | 7.3%), and psychology (32 | 7.1%) are the most common fields of study among 449 individuals in New Windsor who have obtained a bachelor's degree or higher.
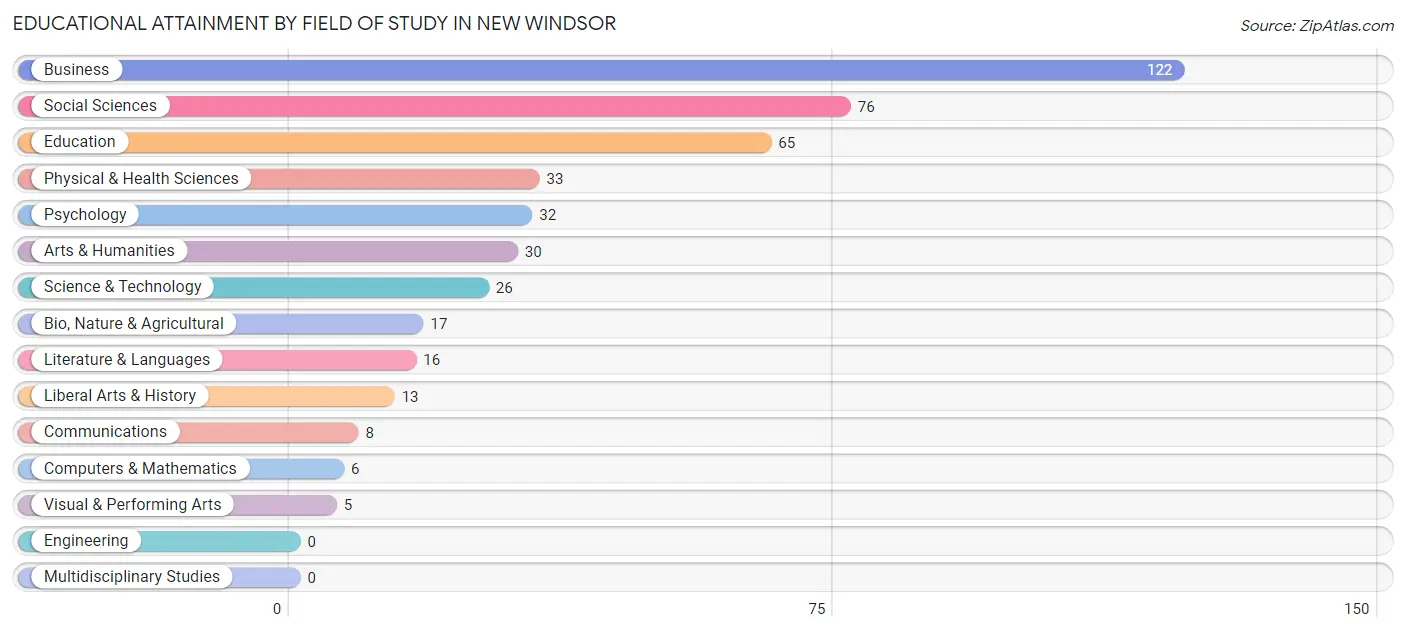
| Field of Study | # Graduates | % Graduates |
| Computers & Mathematics | 6 | 1.3% |
| Bio, Nature & Agricultural | 17 | 3.8% |
| Physical & Health Sciences | 33 | 7.3% |
| Psychology | 32 | 7.1% |
| Social Sciences | 76 | 16.9% |
| Engineering | 0 | 0.0% |
| Multidisciplinary Studies | 0 | 0.0% |
| Science & Technology | 26 | 5.8% |
| Business | 122 | 27.2% |
| Education | 65 | 14.5% |
| Literature & Languages | 16 | 3.6% |
| Liberal Arts & History | 13 | 2.9% |
| Visual & Performing Arts | 5 | 1.1% |
| Communications | 8 | 1.8% |
| Arts & Humanities | 30 | 6.7% |
| Total | 449 | 100.0% |
Transportation & Commute in New Windsor
Vehicle Availability by Sex in New Windsor
The most prevalent vehicle ownership categories in New Windsor are males with 2 vehicles (195, accounting for 58.9%) and females with 2 vehicles (121, making up 76.5%).
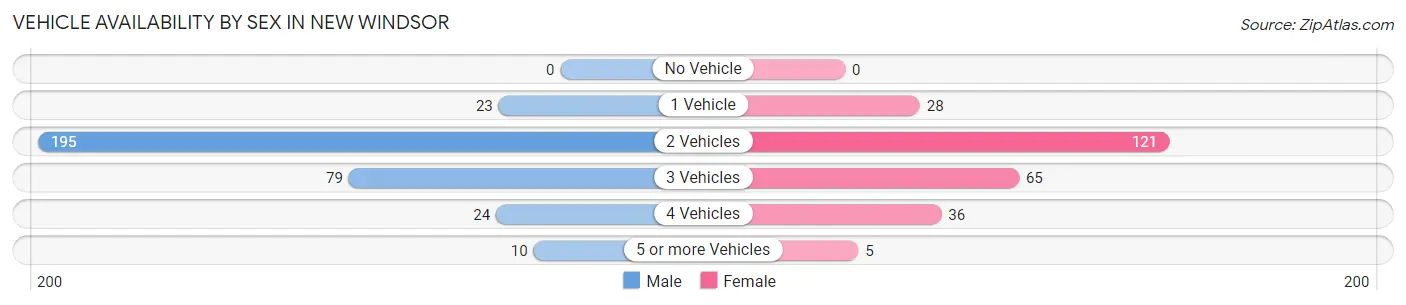
| Vehicles Available | Male | Female |
| No Vehicle | 0 (0.0%) | 0 (0.0%) |
| 1 Vehicle | 23 (7.0%) | 28 (11.0%) |
| 2 Vehicles | 195 (58.9%) | 121 (47.4%) |
| 3 Vehicles | 79 (23.9%) | 65 (25.5%) |
| 4 Vehicles | 24 (7.2%) | 36 (14.1%) |
| 5 or more Vehicles | 10 (3.0%) | 5 (2.0%) |
| Total | 331 (100.0%) | 255 (100.0%) |
Commute Time in New Windsor
The most frequently occuring commute durations in New Windsor are 60 to 89 minutes (165 commuters, 33.1%), 5 to 9 minutes (59 commuters, 11.8%), and 45 to 59 minutes (56 commuters, 11.2%).
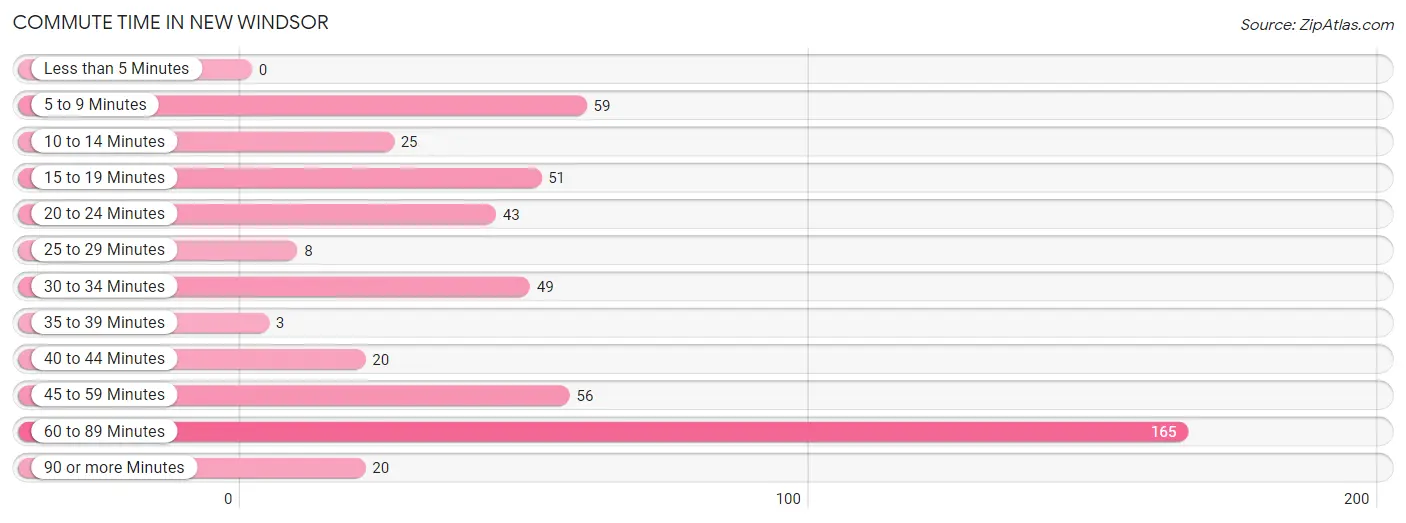
| Commute Time | # Commuters | % Commuters |
| Less than 5 Minutes | 0 | 0.0% |
| 5 to 9 Minutes | 59 | 11.8% |
| 10 to 14 Minutes | 25 | 5.0% |
| 15 to 19 Minutes | 51 | 10.2% |
| 20 to 24 Minutes | 43 | 8.6% |
| 25 to 29 Minutes | 8 | 1.6% |
| 30 to 34 Minutes | 49 | 9.8% |
| 35 to 39 Minutes | 3 | 0.6% |
| 40 to 44 Minutes | 20 | 4.0% |
| 45 to 59 Minutes | 56 | 11.2% |
| 60 to 89 Minutes | 165 | 33.1% |
| 90 or more Minutes | 20 | 4.0% |
Commute Time by Sex in New Windsor
The most common commute times in New Windsor are 60 to 89 minutes (111 commuters, 37.9%) for males and 60 to 89 minutes (54 commuters, 26.2%) for females.
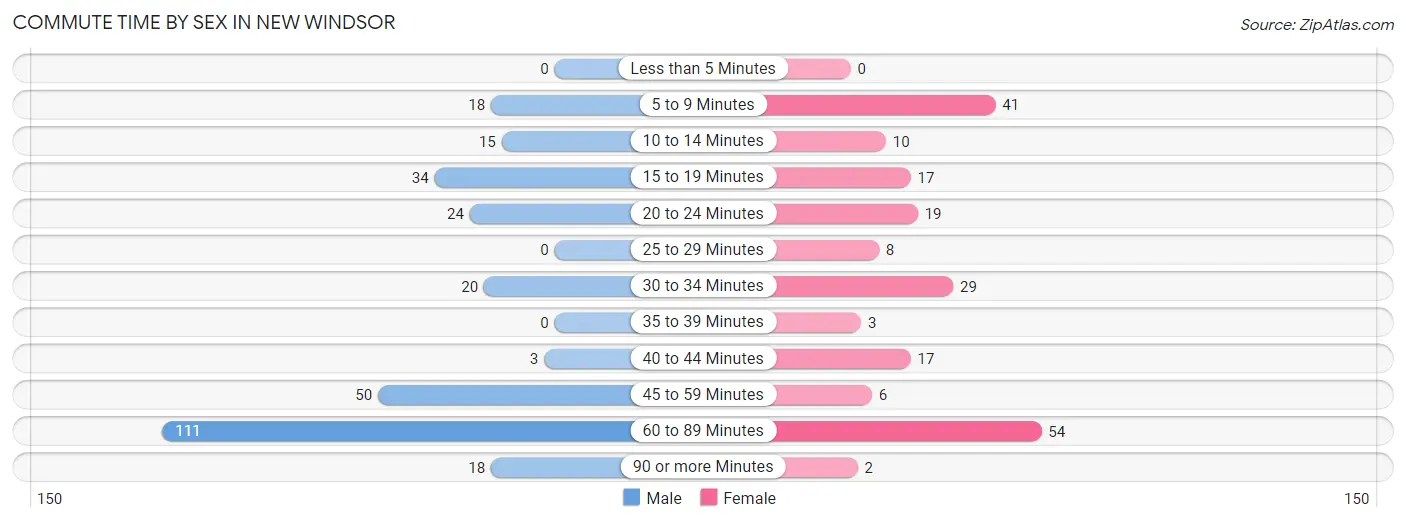
| Commute Time | Male | Female |
| Less than 5 Minutes | 0 (0.0%) | 0 (0.0%) |
| 5 to 9 Minutes | 18 (6.1%) | 41 (19.9%) |
| 10 to 14 Minutes | 15 (5.1%) | 10 (4.9%) |
| 15 to 19 Minutes | 34 (11.6%) | 17 (8.3%) |
| 20 to 24 Minutes | 24 (8.2%) | 19 (9.2%) |
| 25 to 29 Minutes | 0 (0.0%) | 8 (3.9%) |
| 30 to 34 Minutes | 20 (6.8%) | 29 (14.1%) |
| 35 to 39 Minutes | 0 (0.0%) | 3 (1.5%) |
| 40 to 44 Minutes | 3 (1.0%) | 17 (8.3%) |
| 45 to 59 Minutes | 50 (17.1%) | 6 (2.9%) |
| 60 to 89 Minutes | 111 (37.9%) | 54 (26.2%) |
| 90 or more Minutes | 18 (6.1%) | 2 (1.0%) |
Time of Departure to Work by Sex in New Windsor
The most frequent times of departure to work in New Windsor are 5:00 AM to 5:29 AM (52, 17.7%) for males and 7:00 AM to 7:29 AM (40, 19.4%) for females.
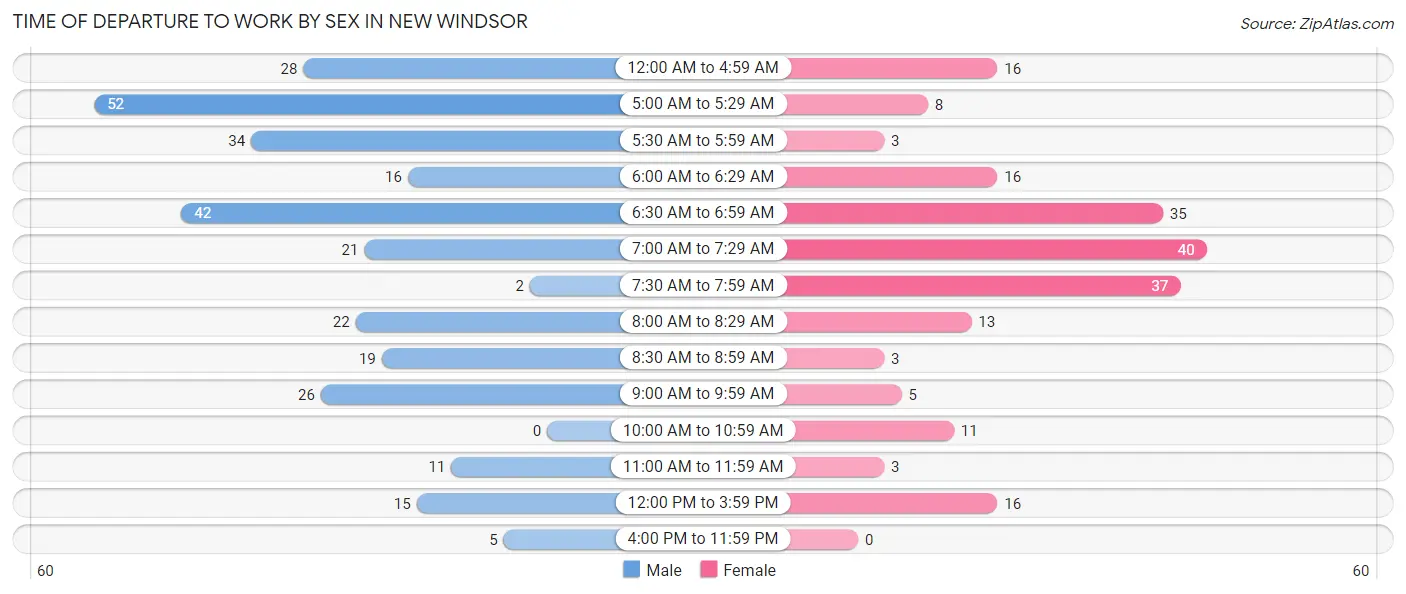
| Time of Departure | Male | Female |
| 12:00 AM to 4:59 AM | 28 (9.6%) | 16 (7.8%) |
| 5:00 AM to 5:29 AM | 52 (17.7%) | 8 (3.9%) |
| 5:30 AM to 5:59 AM | 34 (11.6%) | 3 (1.5%) |
| 6:00 AM to 6:29 AM | 16 (5.5%) | 16 (7.8%) |
| 6:30 AM to 6:59 AM | 42 (14.3%) | 35 (17.0%) |
| 7:00 AM to 7:29 AM | 21 (7.2%) | 40 (19.4%) |
| 7:30 AM to 7:59 AM | 2 (0.7%) | 37 (18.0%) |
| 8:00 AM to 8:29 AM | 22 (7.5%) | 13 (6.3%) |
| 8:30 AM to 8:59 AM | 19 (6.5%) | 3 (1.5%) |
| 9:00 AM to 9:59 AM | 26 (8.9%) | 5 (2.4%) |
| 10:00 AM to 10:59 AM | 0 (0.0%) | 11 (5.3%) |
| 11:00 AM to 11:59 AM | 11 (3.7%) | 3 (1.5%) |
| 12:00 PM to 3:59 PM | 15 (5.1%) | 16 (7.8%) |
| 4:00 PM to 11:59 PM | 5 (1.7%) | 0 (0.0%) |
| Total | 293 (100.0%) | 206 (100.0%) |
Housing Occupancy in New Windsor
Occupancy by Ownership in New Windsor
Of the total 542 dwellings in New Windsor, owner-occupied units account for 482 (88.9%), while renter-occupied units make up 60 (11.1%).
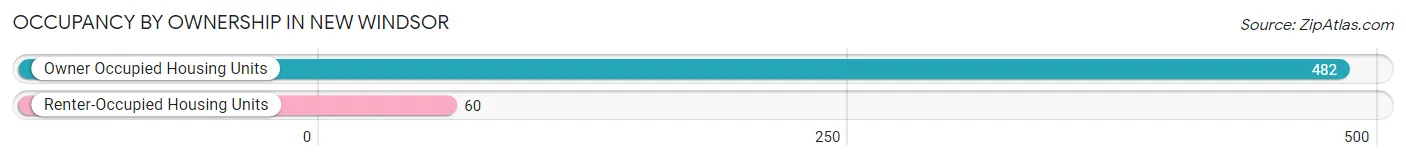
| Occupancy | # Housing Units | % Housing Units |
| Owner Occupied Housing Units | 482 | 88.9% |
| Renter-Occupied Housing Units | 60 | 11.1% |
| Total Occupied Housing Units | 542 | 100.0% |
Occupancy by Household Size in New Windsor
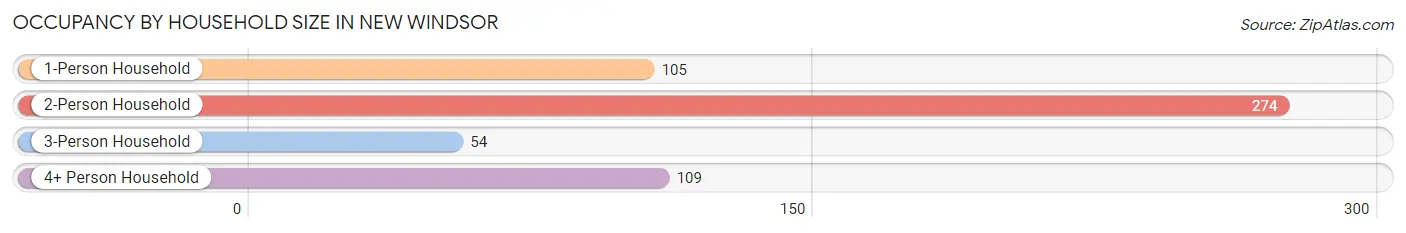
| Household Size | # Housing Units | % Housing Units |
| 1-Person Household | 105 | 19.4% |
| 2-Person Household | 274 | 50.5% |
| 3-Person Household | 54 | 10.0% |
| 4+ Person Household | 109 | 20.1% |
| Total Housing Units | 542 | 100.0% |
Occupancy by Ownership by Household Size in New Windsor
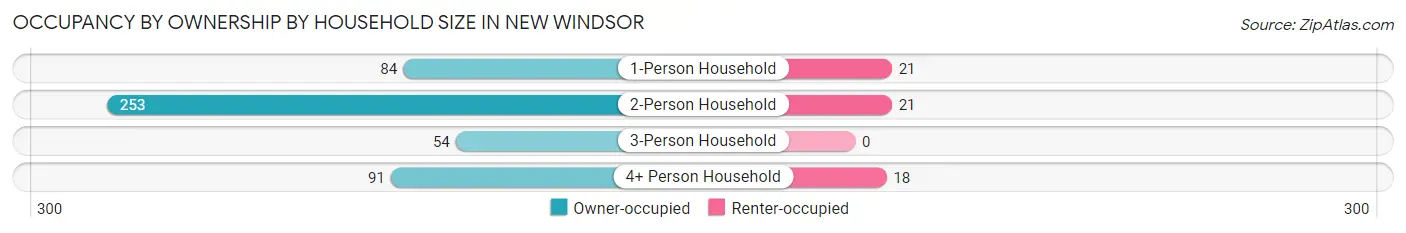
| Household Size | Owner-occupied | Renter-occupied |
| 1-Person Household | 84 (80.0%) | 21 (20.0%) |
| 2-Person Household | 253 (92.3%) | 21 (7.7%) |
| 3-Person Household | 54 (100.0%) | 0 (0.0%) |
| 4+ Person Household | 91 (83.5%) | 18 (16.5%) |
| Total Housing Units | 482 (88.9%) | 60 (11.1%) |
Occupancy by Educational Attainment in New Windsor
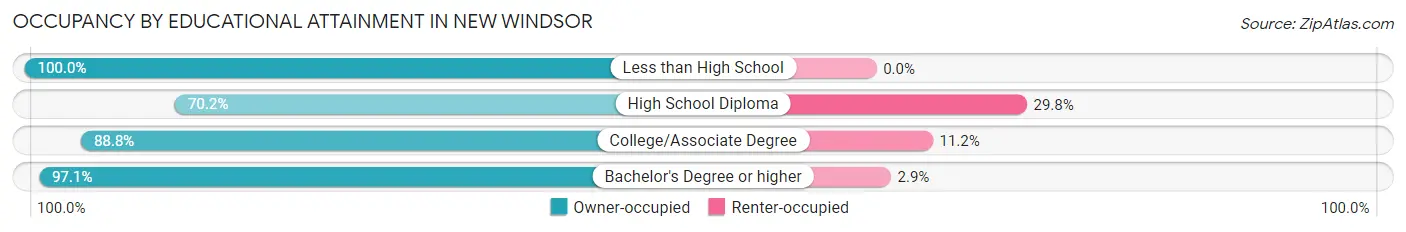
| Household Size | Owner-occupied | Renter-occupied |
| Less than High School | 13 (100.0%) | 0 (0.0%) |
| High School Diploma | 80 (70.2%) | 34 (29.8%) |
| College/Associate Degree | 151 (88.8%) | 19 (11.2%) |
| Bachelor's Degree or higher | 238 (97.1%) | 7 (2.9%) |
Occupancy by Age of Householder in New Windsor
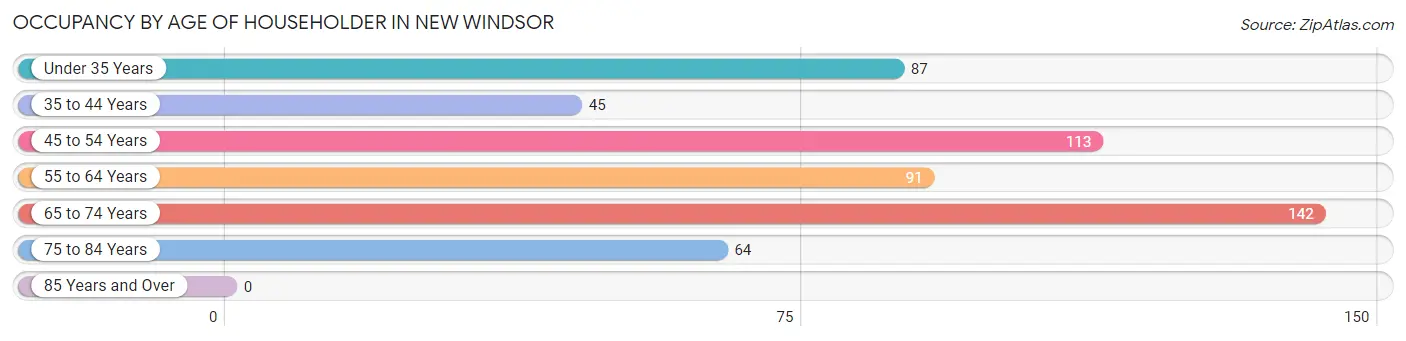
| Age Bracket | # Households | % Households |
| Under 35 Years | 87 | 16.1% |
| 35 to 44 Years | 45 | 8.3% |
| 45 to 54 Years | 113 | 20.8% |
| 55 to 64 Years | 91 | 16.8% |
| 65 to 74 Years | 142 | 26.2% |
| 75 to 84 Years | 64 | 11.8% |
| 85 Years and Over | 0 | 0.0% |
| Total | 542 | 100.0% |
Housing Finances in New Windsor
Median Income by Occupancy in New Windsor
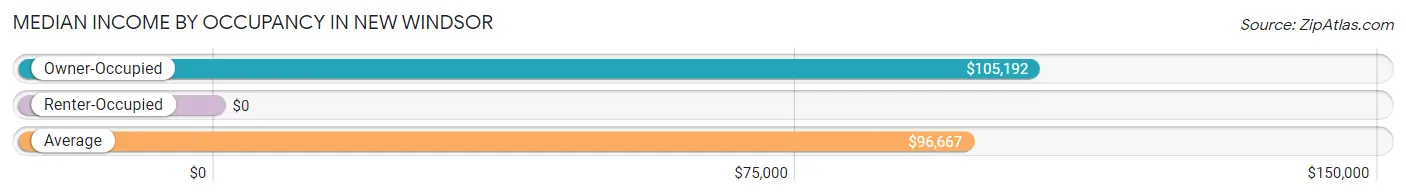
| Occupancy Type | # Households | Median Income |
| Owner-Occupied | 482 (88.9%) | $105,192 |
| Renter-Occupied | 60 (11.1%) | $0 |
| Average | 542 (100.0%) | $96,667 |
Occupancy by Householder Income Bracket in New Windsor
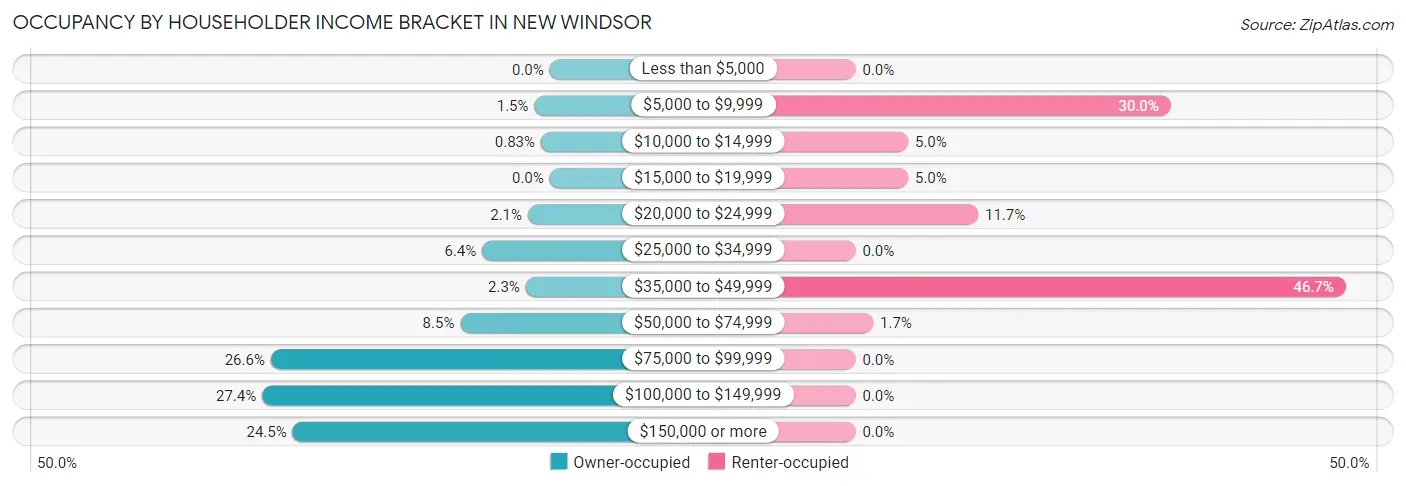
| Income Bracket | Owner-occupied | Renter-occupied |
| Less than $5,000 | 0 (0.0%) | 0 (0.0%) |
| $5,000 to $9,999 | 7 (1.5%) | 18 (30.0%) |
| $10,000 to $14,999 | 4 (0.8%) | 3 (5.0%) |
| $15,000 to $19,999 | 0 (0.0%) | 3 (5.0%) |
| $20,000 to $24,999 | 10 (2.1%) | 7 (11.7%) |
| $25,000 to $34,999 | 31 (6.4%) | 0 (0.0%) |
| $35,000 to $49,999 | 11 (2.3%) | 28 (46.7%) |
| $50,000 to $74,999 | 41 (8.5%) | 1 (1.7%) |
| $75,000 to $99,999 | 128 (26.6%) | 0 (0.0%) |
| $100,000 to $149,999 | 132 (27.4%) | 0 (0.0%) |
| $150,000 or more | 118 (24.5%) | 0 (0.0%) |
| Total | 482 (100.0%) | 60 (100.0%) |
Monthly Housing Cost Tiers in New Windsor
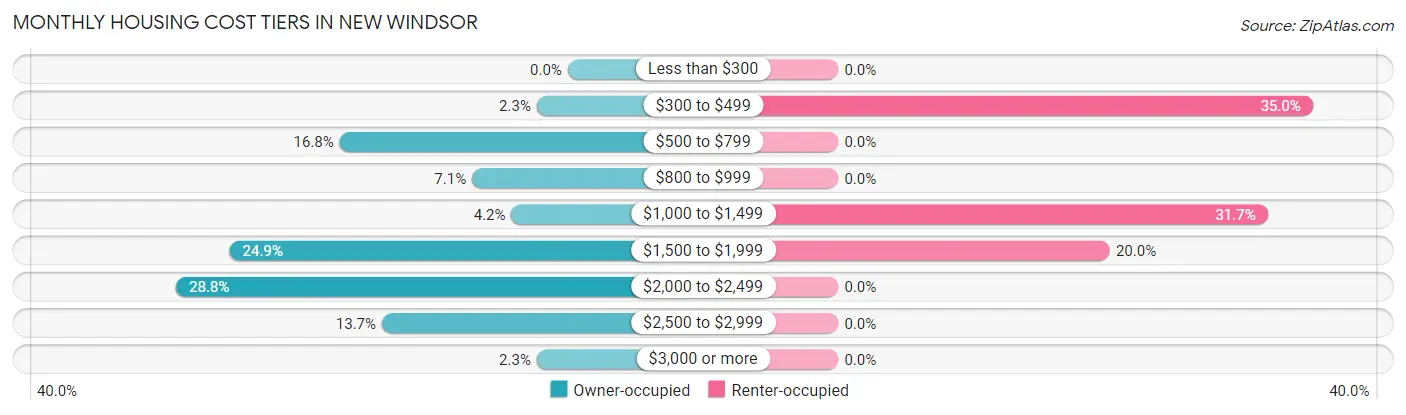
| Monthly Cost | Owner-occupied | Renter-occupied |
| Less than $300 | 0 (0.0%) | 0 (0.0%) |
| $300 to $499 | 11 (2.3%) | 21 (35.0%) |
| $500 to $799 | 81 (16.8%) | 0 (0.0%) |
| $800 to $999 | 34 (7.0%) | 0 (0.0%) |
| $1,000 to $1,499 | 20 (4.2%) | 19 (31.7%) |
| $1,500 to $1,999 | 120 (24.9%) | 12 (20.0%) |
| $2,000 to $2,499 | 139 (28.8%) | 0 (0.0%) |
| $2,500 to $2,999 | 66 (13.7%) | 0 (0.0%) |
| $3,000 or more | 11 (2.3%) | 0 (0.0%) |
| Total | 482 (100.0%) | 60 (100.0%) |
Physical Housing Characteristics in New Windsor
Housing Structures in New Windsor
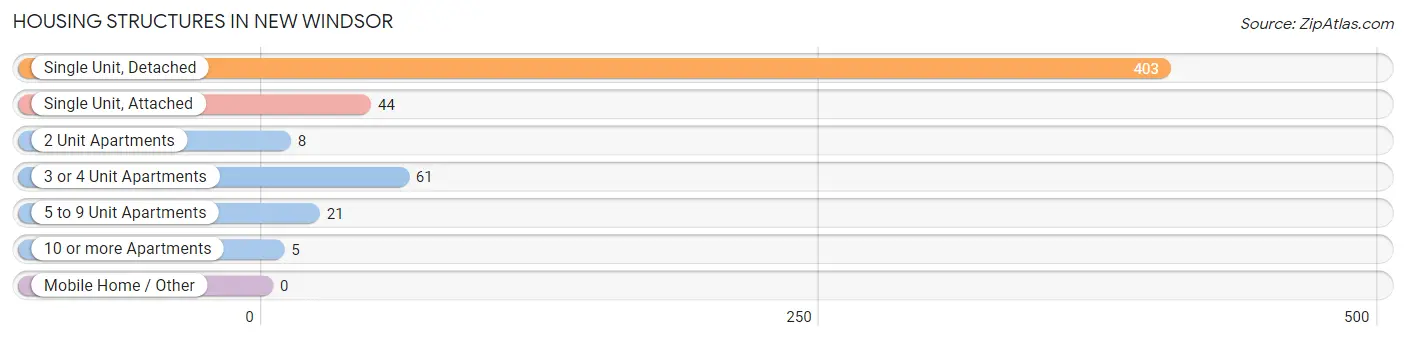
| Structure Type | # Housing Units | % Housing Units |
| Single Unit, Detached | 403 | 74.4% |
| Single Unit, Attached | 44 | 8.1% |
| 2 Unit Apartments | 8 | 1.5% |
| 3 or 4 Unit Apartments | 61 | 11.3% |
| 5 to 9 Unit Apartments | 21 | 3.9% |
| 10 or more Apartments | 5 | 0.9% |
| Mobile Home / Other | 0 | 0.0% |
| Total | 542 | 100.0% |
Housing Structures by Occupancy in New Windsor
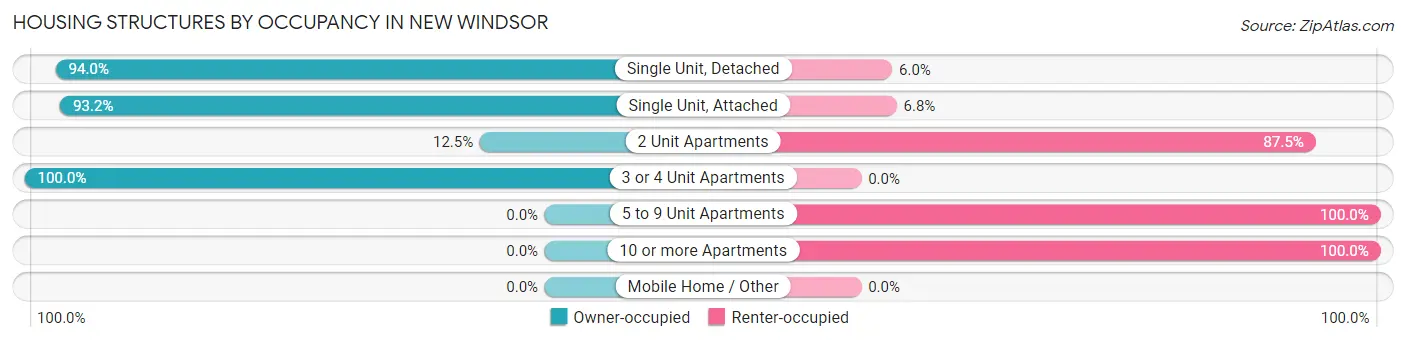
| Structure Type | Owner-occupied | Renter-occupied |
| Single Unit, Detached | 379 (94.0%) | 24 (6.0%) |
| Single Unit, Attached | 41 (93.2%) | 3 (6.8%) |
| 2 Unit Apartments | 1 (12.5%) | 7 (87.5%) |
| 3 or 4 Unit Apartments | 61 (100.0%) | 0 (0.0%) |
| 5 to 9 Unit Apartments | 0 (0.0%) | 21 (100.0%) |
| 10 or more Apartments | 0 (0.0%) | 5 (100.0%) |
| Mobile Home / Other | 0 (0.0%) | 0 (0.0%) |
| Total | 482 (88.9%) | 60 (11.1%) |
Housing Structures by Number of Rooms in New Windsor
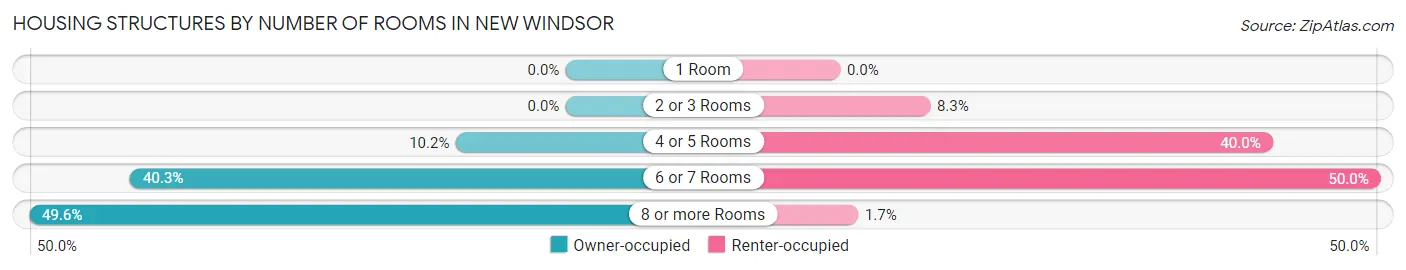
| Number of Rooms | Owner-occupied | Renter-occupied |
| 1 Room | 0 (0.0%) | 0 (0.0%) |
| 2 or 3 Rooms | 0 (0.0%) | 5 (8.3%) |
| 4 or 5 Rooms | 49 (10.2%) | 24 (40.0%) |
| 6 or 7 Rooms | 194 (40.3%) | 30 (50.0%) |
| 8 or more Rooms | 239 (49.6%) | 1 (1.7%) |
| Total | 482 (100.0%) | 60 (100.0%) |
Housing Structure by Heating Type in New Windsor
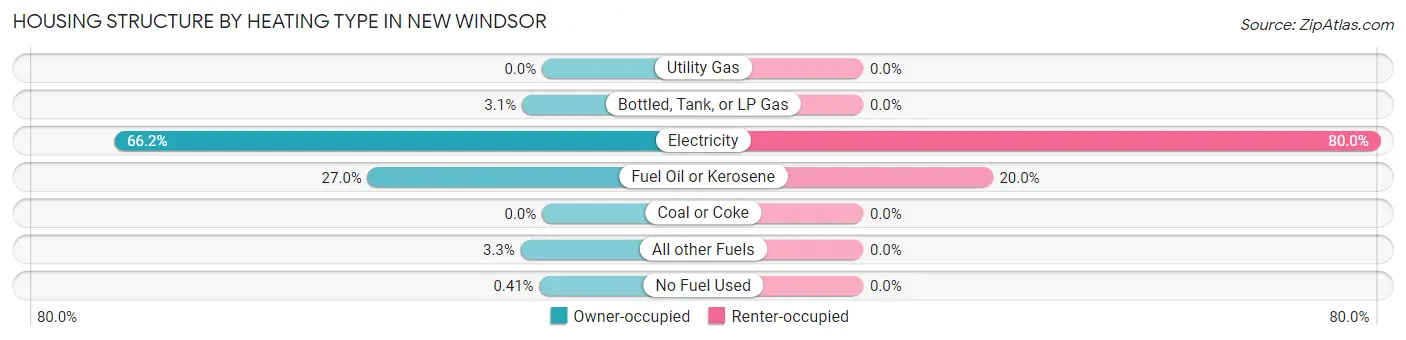
| Heating Type | Owner-occupied | Renter-occupied |
| Utility Gas | 0 (0.0%) | 0 (0.0%) |
| Bottled, Tank, or LP Gas | 15 (3.1%) | 0 (0.0%) |
| Electricity | 319 (66.2%) | 48 (80.0%) |
| Fuel Oil or Kerosene | 130 (27.0%) | 12 (20.0%) |
| Coal or Coke | 0 (0.0%) | 0 (0.0%) |
| All other Fuels | 16 (3.3%) | 0 (0.0%) |
| No Fuel Used | 2 (0.4%) | 0 (0.0%) |
| Total | 482 (100.0%) | 60 (100.0%) |
Household Vehicle Usage in New Windsor
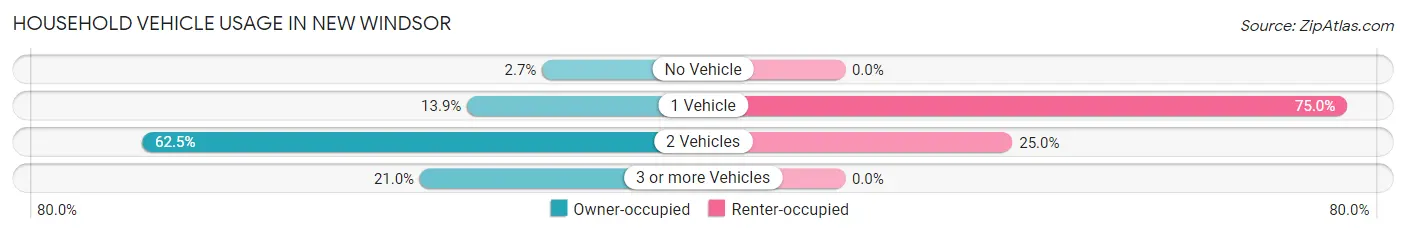
| Vehicles per Household | Owner-occupied | Renter-occupied |
| No Vehicle | 13 (2.7%) | 0 (0.0%) |
| 1 Vehicle | 67 (13.9%) | 45 (75.0%) |
| 2 Vehicles | 301 (62.5%) | 15 (25.0%) |
| 3 or more Vehicles | 101 (20.9%) | 0 (0.0%) |
| Total | 482 (100.0%) | 60 (100.0%) |
Real Estate & Mortgages in New Windsor
Real Estate and Mortgage Overview in New Windsor
| Characteristic | Without Mortgage | With Mortgage |
| Housing Units | 139 | 343 |
| Median Property Value | $323,300 | $358,300 |
| Median Household Income | $77,917 | $86 |
| Monthly Housing Costs | $681 | $11 |
| Real Estate Taxes | $3,525 | $3 |
Property Value by Mortgage Status in New Windsor
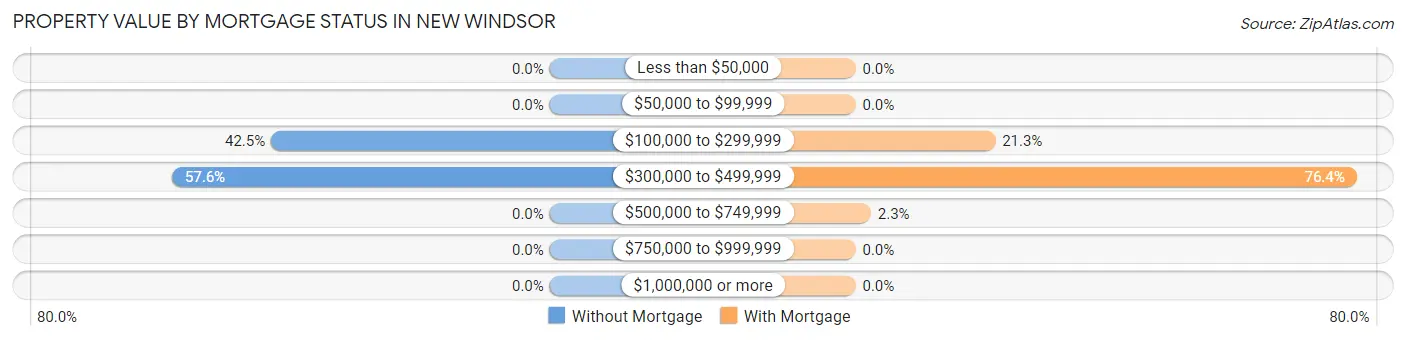
| Property Value | Without Mortgage | With Mortgage |
| Less than $50,000 | 0 (0.0%) | 0 (0.0%) |
| $50,000 to $99,999 | 0 (0.0%) | 0 (0.0%) |
| $100,000 to $299,999 | 59 (42.4%) | 73 (21.3%) |
| $300,000 to $499,999 | 80 (57.6%) | 262 (76.4%) |
| $500,000 to $749,999 | 0 (0.0%) | 8 (2.3%) |
| $750,000 to $999,999 | 0 (0.0%) | 0 (0.0%) |
| $1,000,000 or more | 0 (0.0%) | 0 (0.0%) |
| Total | 139 (100.0%) | 343 (100.0%) |
Household Income by Mortgage Status in New Windsor
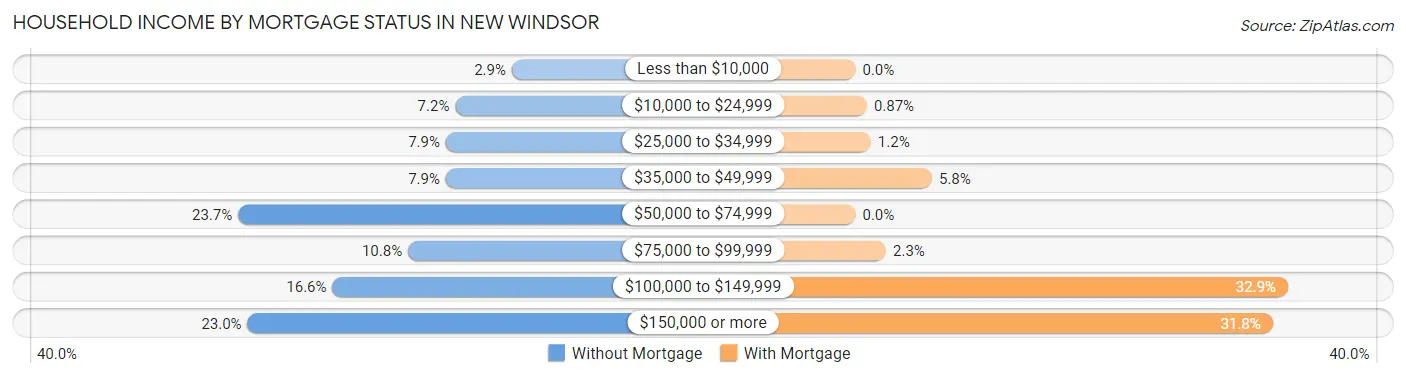
| Household Income | Without Mortgage | With Mortgage |
| Less than $10,000 | 4 (2.9%) | 0 (0.0%) |
| $10,000 to $24,999 | 10 (7.2%) | 3 (0.9%) |
| $25,000 to $34,999 | 11 (7.9%) | 4 (1.2%) |
| $35,000 to $49,999 | 11 (7.9%) | 20 (5.8%) |
| $50,000 to $74,999 | 33 (23.7%) | 0 (0.0%) |
| $75,000 to $99,999 | 15 (10.8%) | 8 (2.3%) |
| $100,000 to $149,999 | 23 (16.6%) | 113 (32.9%) |
| $150,000 or more | 32 (23.0%) | 109 (31.8%) |
| Total | 139 (100.0%) | 343 (100.0%) |
Property Value to Household Income Ratio in New Windsor
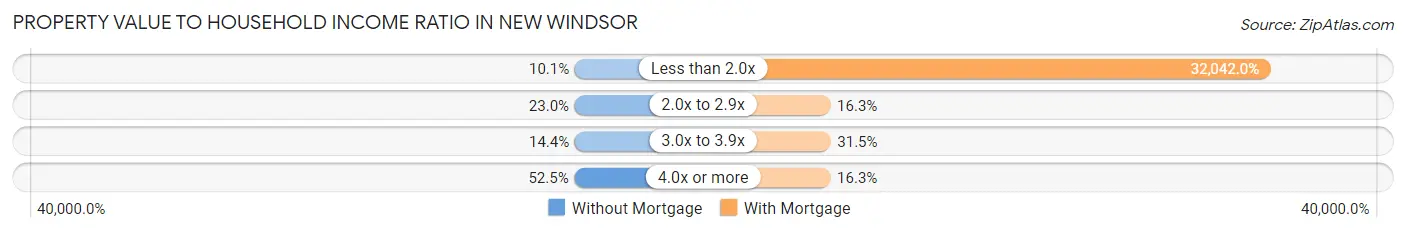
| Value-to-Income Ratio | Without Mortgage | With Mortgage |
| Less than 2.0x | 14 (10.1%) | 109,904 (32,042.0%) |
| 2.0x to 2.9x | 32 (23.0%) | 56 (16.3%) |
| 3.0x to 3.9x | 20 (14.4%) | 108 (31.5%) |
| 4.0x or more | 73 (52.5%) | 56 (16.3%) |
| Total | 139 (100.0%) | 343 (100.0%) |
Real Estate Taxes by Mortgage Status in New Windsor
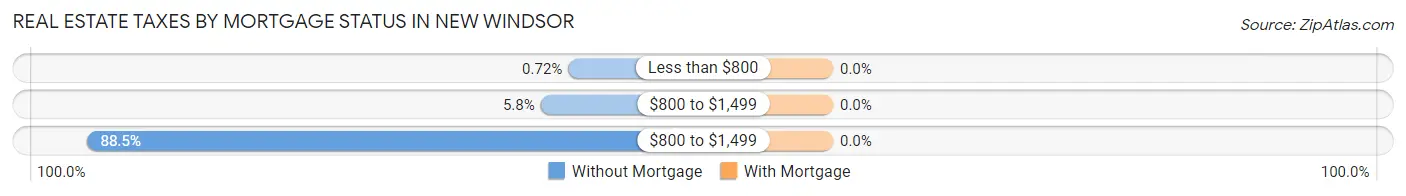
| Property Taxes | Without Mortgage | With Mortgage |
| Less than $800 | 1 (0.7%) | 0 (0.0%) |
| $800 to $1,499 | 8 (5.8%) | 0 (0.0%) |
| $800 to $1,499 | 123 (88.5%) | 0 (0.0%) |
| Total | 139 (100.0%) | 343 (100.0%) |
Health & Disability in New Windsor
Health Insurance Coverage by Age in New Windsor
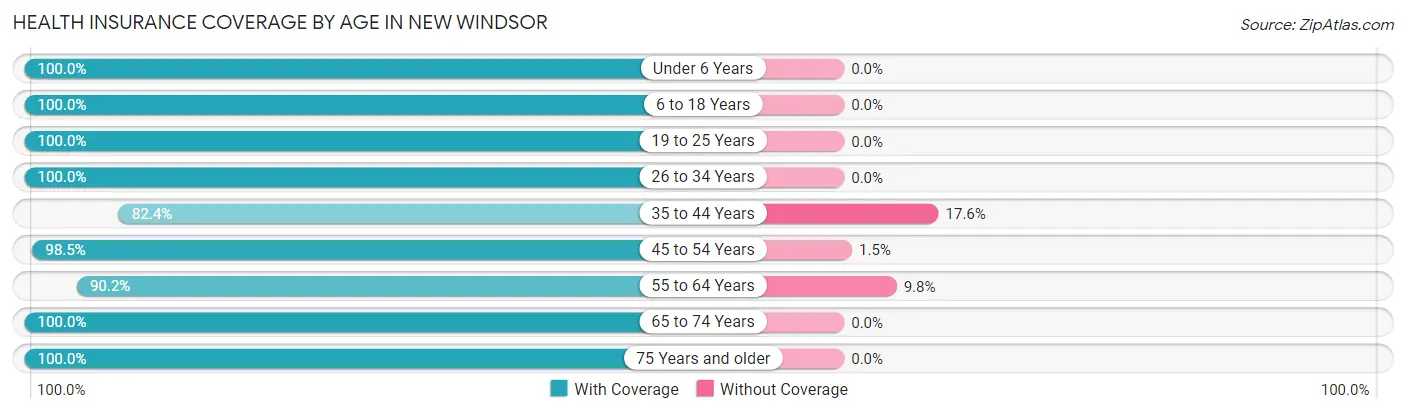
| Age Bracket | With Coverage | Without Coverage |
| Under 6 Years | 53 (100.0%) | 0 (0.0%) |
| 6 to 18 Years | 162 (100.0%) | 0 (0.0%) |
| 19 to 25 Years | 117 (100.0%) | 0 (0.0%) |
| 26 to 34 Years | 129 (100.0%) | 0 (0.0%) |
| 35 to 44 Years | 89 (82.4%) | 19 (17.6%) |
| 45 to 54 Years | 202 (98.5%) | 3 (1.5%) |
| 55 to 64 Years | 157 (90.2%) | 17 (9.8%) |
| 65 to 74 Years | 242 (100.0%) | 0 (0.0%) |
| 75 Years and older | 114 (100.0%) | 0 (0.0%) |
| Total | 1,265 (97.0%) | 39 (3.0%) |
Health Insurance Coverage by Citizenship Status in New Windsor
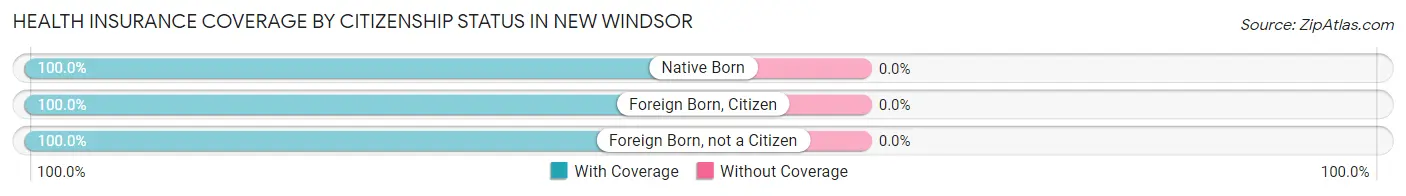
| Citizenship Status | With Coverage | Without Coverage |
| Native Born | 53 (100.0%) | 0 (0.0%) |
| Foreign Born, Citizen | 162 (100.0%) | 0 (0.0%) |
| Foreign Born, not a Citizen | 117 (100.0%) | 0 (0.0%) |
Health Insurance Coverage by Household Income in New Windsor
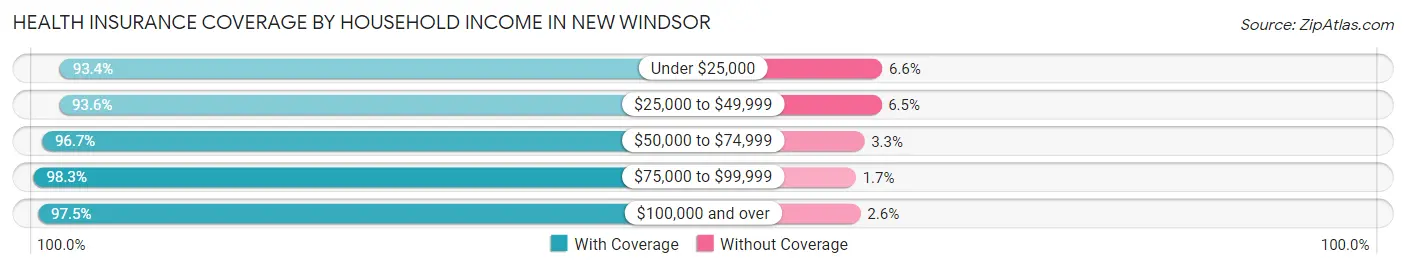
| Household Income | With Coverage | Without Coverage |
| Under $25,000 | 99 (93.4%) | 7 (6.6%) |
| $25,000 to $49,999 | 87 (93.5%) | 6 (6.5%) |
| $50,000 to $74,999 | 89 (96.7%) | 3 (3.3%) |
| $75,000 to $99,999 | 236 (98.3%) | 4 (1.7%) |
| $100,000 and over | 726 (97.5%) | 19 (2.5%) |
Public vs Private Health Insurance Coverage by Age in New Windsor
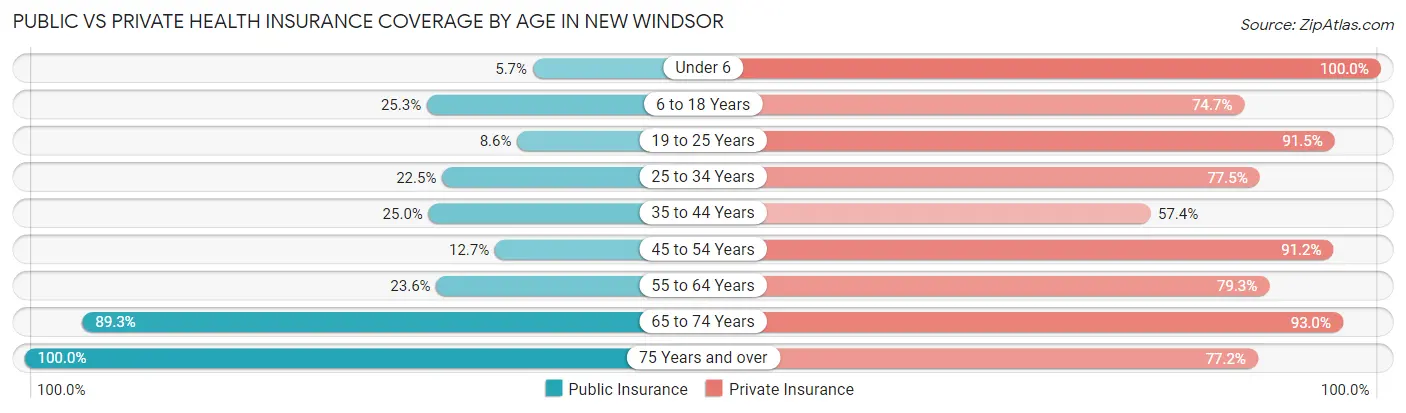
| Age Bracket | Public Insurance | Private Insurance |
| Under 6 | 3 (5.7%) | 53 (100.0%) |
| 6 to 18 Years | 41 (25.3%) | 121 (74.7%) |
| 19 to 25 Years | 10 (8.6%) | 107 (91.4%) |
| 25 to 34 Years | 29 (22.5%) | 100 (77.5%) |
| 35 to 44 Years | 27 (25.0%) | 62 (57.4%) |
| 45 to 54 Years | 26 (12.7%) | 187 (91.2%) |
| 55 to 64 Years | 41 (23.6%) | 138 (79.3%) |
| 65 to 74 Years | 216 (89.3%) | 225 (93.0%) |
| 75 Years and over | 114 (100.0%) | 88 (77.2%) |
| Total | 507 (38.9%) | 1,081 (82.9%) |
Disability Status by Sex by Age in New Windsor
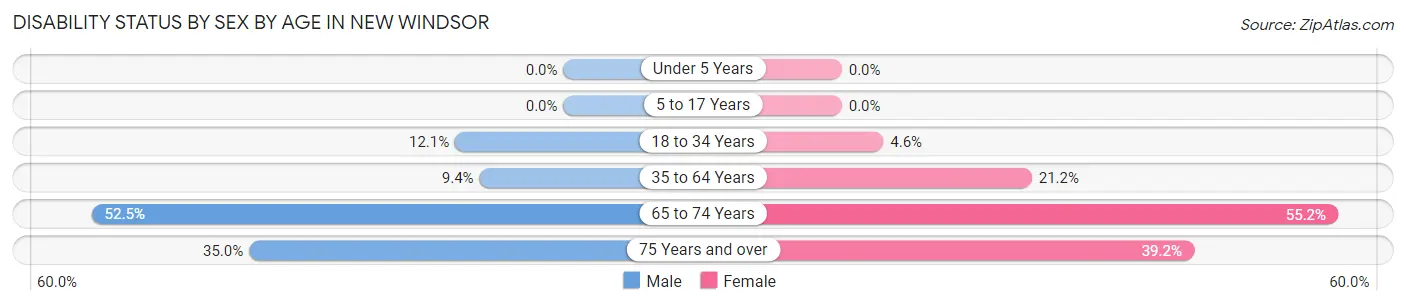
| Age Bracket | Male | Female |
| Under 5 Years | 0 (0.0%) | 0 (0.0%) |
| 5 to 17 Years | 0 (0.0%) | 0 (0.0%) |
| 18 to 34 Years | 17 (12.1%) | 5 (4.6%) |
| 35 to 64 Years | 23 (9.3%) | 51 (21.2%) |
| 65 to 74 Years | 52 (52.5%) | 79 (55.2%) |
| 75 Years and over | 14 (35.0%) | 29 (39.2%) |
Disability Class by Sex by Age in New Windsor
Disability Class: Hearing Difficulty
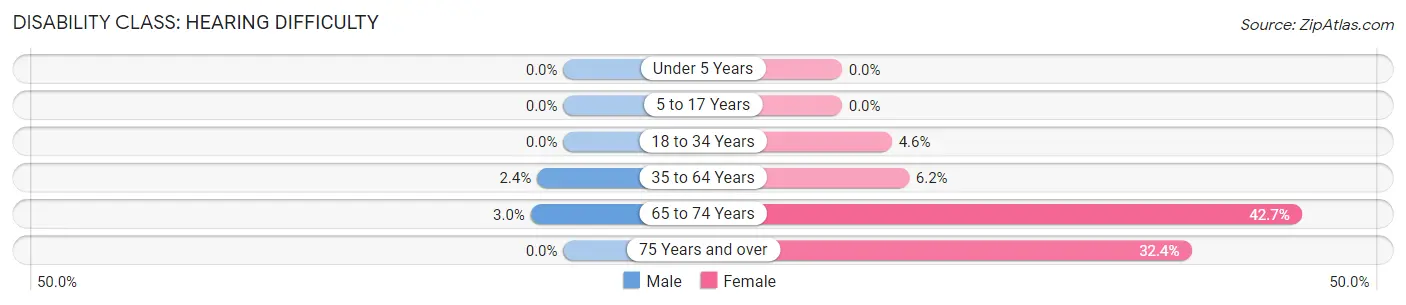
| Age Bracket | Male | Female |
| Under 5 Years | 0 (0.0%) | 0 (0.0%) |
| 5 to 17 Years | 0 (0.0%) | 0 (0.0%) |
| 18 to 34 Years | 0 (0.0%) | 5 (4.6%) |
| 35 to 64 Years | 6 (2.4%) | 15 (6.2%) |
| 65 to 74 Years | 3 (3.0%) | 61 (42.7%) |
| 75 Years and over | 0 (0.0%) | 24 (32.4%) |
Disability Class: Vision Difficulty
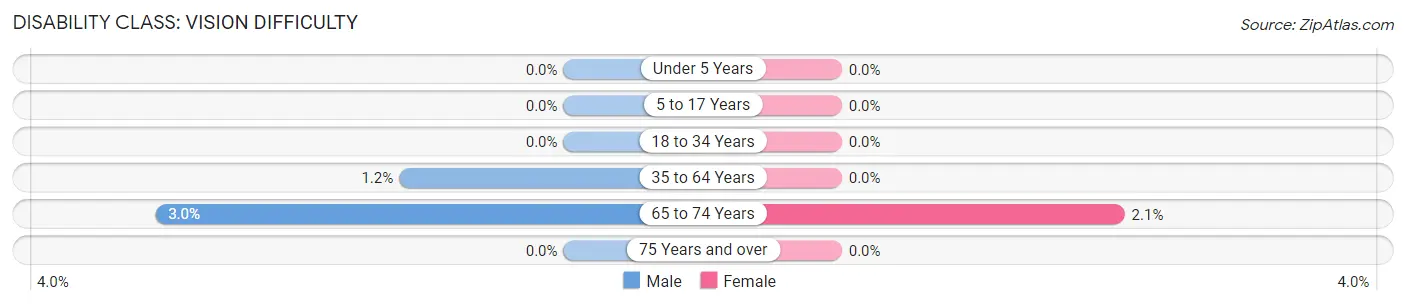
| Age Bracket | Male | Female |
| Under 5 Years | 0 (0.0%) | 0 (0.0%) |
| 5 to 17 Years | 0 (0.0%) | 0 (0.0%) |
| 18 to 34 Years | 0 (0.0%) | 0 (0.0%) |
| 35 to 64 Years | 3 (1.2%) | 0 (0.0%) |
| 65 to 74 Years | 3 (3.0%) | 3 (2.1%) |
| 75 Years and over | 0 (0.0%) | 0 (0.0%) |
Disability Class: Cognitive Difficulty
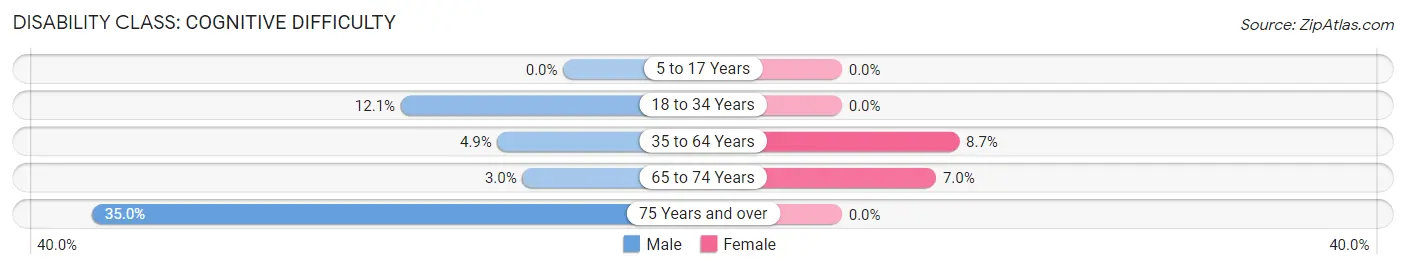
| Age Bracket | Male | Female |
| 5 to 17 Years | 0 (0.0%) | 0 (0.0%) |
| 18 to 34 Years | 17 (12.1%) | 0 (0.0%) |
| 35 to 64 Years | 12 (4.9%) | 21 (8.7%) |
| 65 to 74 Years | 3 (3.0%) | 10 (7.0%) |
| 75 Years and over | 14 (35.0%) | 0 (0.0%) |
Disability Class: Ambulatory Difficulty
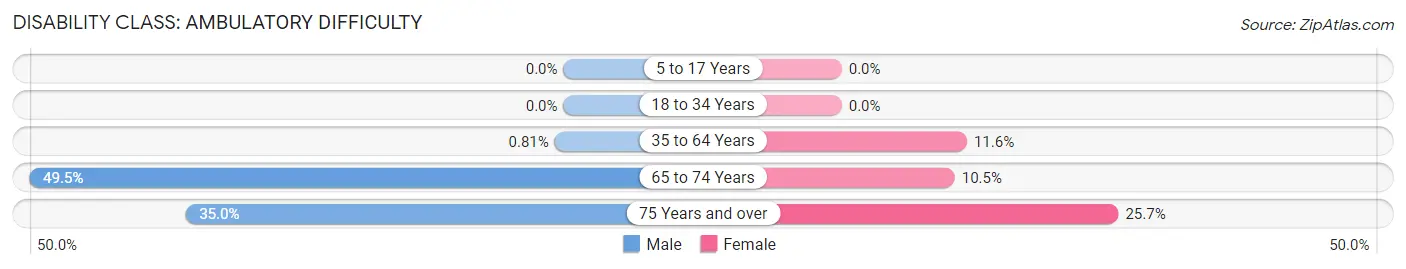
| Age Bracket | Male | Female |
| 5 to 17 Years | 0 (0.0%) | 0 (0.0%) |
| 18 to 34 Years | 0 (0.0%) | 0 (0.0%) |
| 35 to 64 Years | 2 (0.8%) | 28 (11.6%) |
| 65 to 74 Years | 49 (49.5%) | 15 (10.5%) |
| 75 Years and over | 14 (35.0%) | 19 (25.7%) |
Disability Class: Self-Care Difficulty
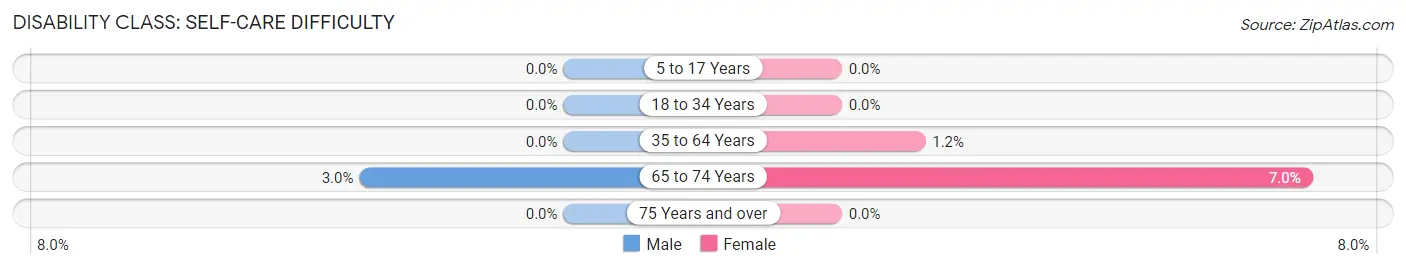
| Age Bracket | Male | Female |
| 5 to 17 Years | 0 (0.0%) | 0 (0.0%) |
| 18 to 34 Years | 0 (0.0%) | 0 (0.0%) |
| 35 to 64 Years | 0 (0.0%) | 3 (1.2%) |
| 65 to 74 Years | 3 (3.0%) | 10 (7.0%) |
| 75 Years and over | 0 (0.0%) | 0 (0.0%) |
Technology Access in New Windsor
Computing Device Access in New Windsor
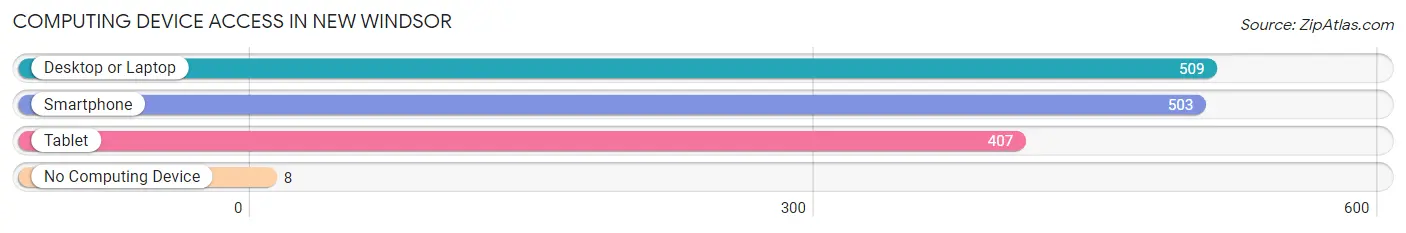
| Device Type | # Households | % Households |
| Desktop or Laptop | 509 | 93.9% |
| Smartphone | 503 | 92.8% |
| Tablet | 407 | 75.1% |
| No Computing Device | 8 | 1.5% |
| Total | 542 | 100.0% |
Internet Access in New Windsor
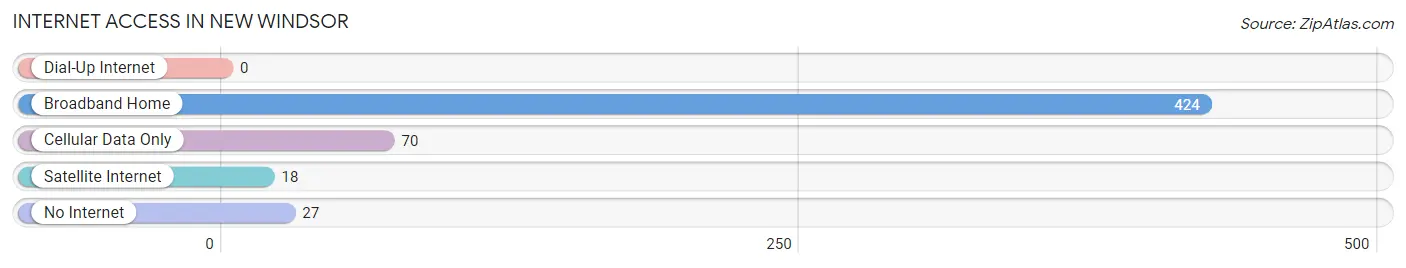
| Internet Type | # Households | % Households |
| Dial-Up Internet | 0 | 0.0% |
| Broadband Home | 424 | 78.2% |
| Cellular Data Only | 70 | 12.9% |
| Satellite Internet | 18 | 3.3% |
| No Internet | 27 | 5.0% |
| Total | 542 | 100.0% |
New Windsor Summary
New Windsor is a small town located in Carroll County, Maryland. It is situated in the northern part of the state, about 25 miles northwest of Baltimore. The town has a population of about 1,400 people and covers an area of 1.2 square miles.
History
New Windsor was founded in 1797 by a group of German immigrants who had settled in the area. The town was named after the city of Windsor in England. The town was originally a farming community, and the main crops grown were wheat, corn, and tobacco. The town was also known for its brickyards, which produced bricks for many of the buildings in the area.
In the early 1900s, the town began to grow and develop. The first bank was established in 1906, and the first post office opened in 1908. The town also had a number of stores, including a general store, a hardware store, and a drug store.
In the 1950s, the town began to decline as many of the businesses closed and the population decreased. However, in the late 1980s, the town began to experience a resurgence as new businesses opened and the population began to increase.
Geography
New Windsor is located in the northern part of Carroll County, Maryland. It is situated in the Piedmont region of the state, which is characterized by rolling hills and valleys. The town is located on the banks of the Monocacy River, which flows through the town.
The town is surrounded by farmland and is home to a number of parks and recreational areas. The town is also home to a number of historic sites, including the New Windsor Historic District, which is listed on the National Register of Historic Places.
Economy
The economy of New Windsor is largely based on agriculture and tourism. The town is home to a number of farms, which produce a variety of crops, including wheat, corn, and tobacco. The town is also home to a number of wineries, which produce a variety of wines.
The town is also home to a number of small businesses, including restaurants, shops, and other services. The town is also home to a number of historic sites, which attract tourists from around the region.
Demographics
As of the 2010 census, the population of New Windsor was 1,400. The town is predominantly white, with about 95% of the population being white. The town also has a small Hispanic population, with about 4% of the population being Hispanic. The median household income in the town is $50,000, and the median home value is $200,000.
New Windsor is a small town with a rich history and a vibrant economy. The town is home to a number of farms, wineries, and other businesses, and is a popular tourist destination. The town is also home to a number of historic sites, which attract visitors from around the region.
Common Questions
What is the Total Population of New Windsor?
Total Population of New Windsor is 1,304.
What is the Total Male Population of New Windsor?
Total Male Population of New Windsor is 625.
What is the Total Female Population of New Windsor?
Total Female Population of New Windsor is 679.
What is the Ratio of Males per 100 Females in New Windsor?
There are 92.05 Males per 100 Females in New Windsor.
What is the Ratio of Females per 100 Males in New Windsor?
There are 108.64 Females per 100 Males in New Windsor.
What is the Median Population Age in New Windsor?
Median Population Age in New Windsor is 50.2 Years.
What is the Average Family Size in New Windsor
Average Family Size in New Windsor is 2.6 People.
What is the Average Household Size in New Windsor
Average Household Size in New Windsor is 2.4 People.
What is Per Capita Income in New Windsor?
Per Capita income in New Windsor is $46,028.
What is the Median Family Income in New Windsor?
Median Family Income in New Windsor is $103,250.
What is the Median Household income in New Windsor?
Median Household Income in New Windsor is $96,667.
What is Inequality or Gini Index in New Windsor?
Inequality or Gini Index in New Windsor is 0.37.
How Large is the Labor Force in New Windsor?
There are 673 People in the Labor Forcein in New Windsor.
What is the Percentage of People in the Labor Force in New Windsor?
59.8% of People are in the Labor Force in New Windsor.
What is the Unemployment Rate in New Windsor?
Unemployment Rate in New Windsor is 12.9%.