Cities with the Highest Percentage of Immigrants from England in Florida
RELATED REPORTS & OPTIONS
England
Florida
Compare Cities
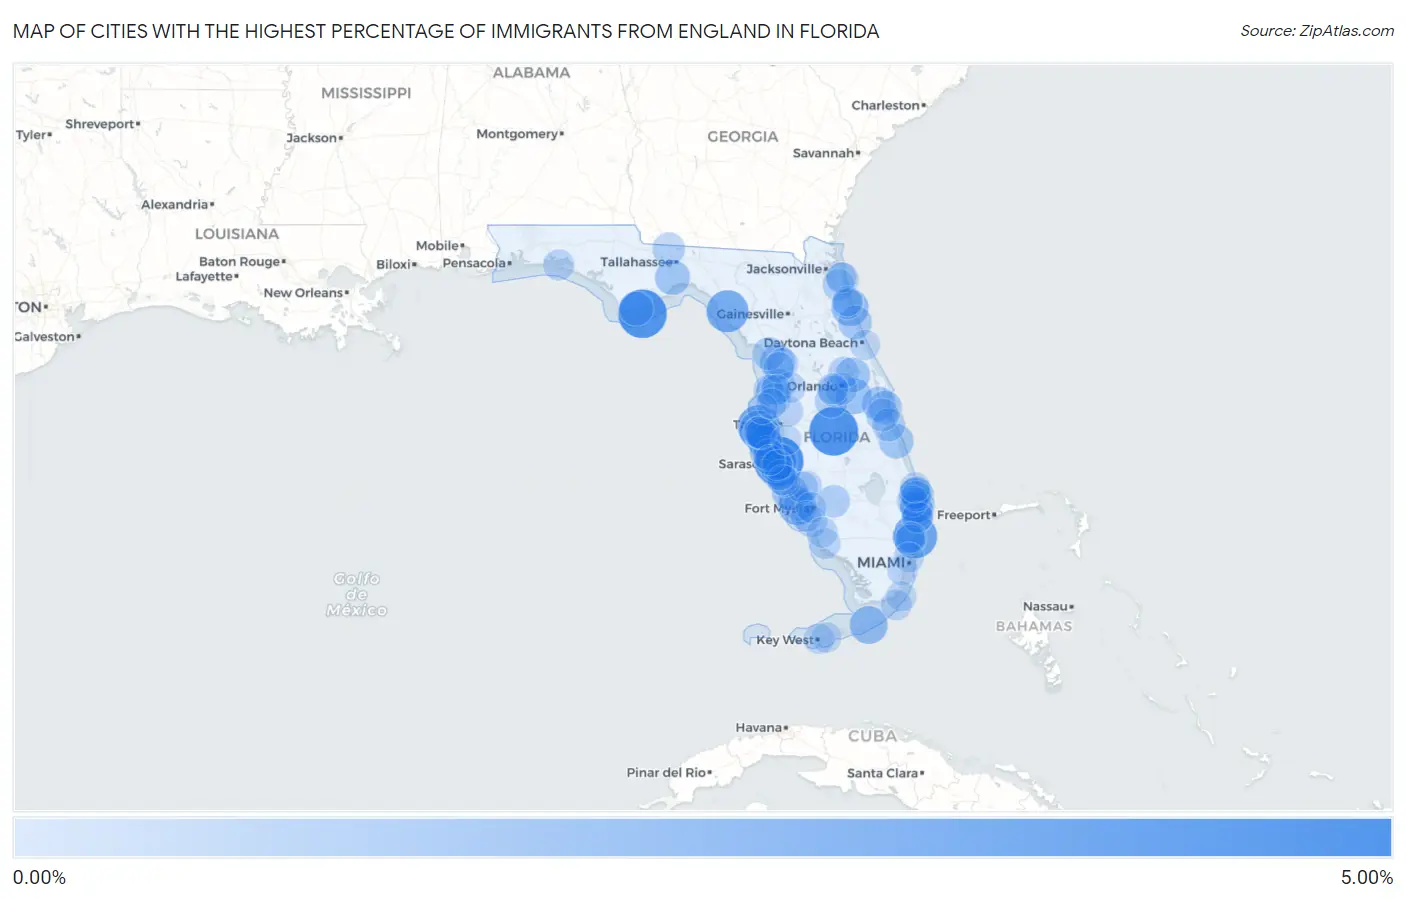
Map of Cities with the Highest Percentage of Immigrants from England in Florida
0.00%
5.00%
Cities with the Highest Percentage of Immigrants from England in Florida
| City | England | vs State | vs National | |
| 1. | Desoto Lakes | 4.55% | 0.17%(+4.37)#1 | 0.096%(+4.45)#40 |
| 2. | Babson Park | 4.39% | 0.17%(+4.21)#2 | 0.096%(+4.29)#44 |
| 3. | St George Island | 4.33% | 0.17%(+4.16)#3 | 0.096%(+4.23)#46 |
| 4. | Sea Ranch Lakes | 3.39% | 0.17%(+3.21)#4 | 0.096%(+3.29)#72 |
| 5. | Belleair Shore | 2.99% | 0.17%(+2.81)#5 | 0.096%(+2.89)#86 |
| 6. | Steinhatchee | 2.92% | 0.17%(+2.74)#6 | 0.096%(+2.82)#89 |
| 7. | North Sarasota | 2.33% | 0.17%(+2.16)#7 | 0.096%(+2.24)#118 |
| 8. | Indian Shores | 2.28% | 0.17%(+2.11)#8 | 0.096%(+2.19)#121 |
| 9. | Pineland | 2.11% | 0.17%(+1.94)#9 | 0.096%(+2.01)#138 |
| 10. | Duck Key | 2.05% | 0.17%(+1.88)#10 | 0.096%(+1.96)#148 |
| 11. | Crescent Beach | 1.92% | 0.17%(+1.75)#11 | 0.096%(+1.83)#167 |
| 12. | Lake Mary Jane | 1.65% | 0.17%(+1.48)#12 | 0.096%(+1.55)#211 |
| 13. | Rotonda | 1.60% | 0.17%(+1.43)#13 | 0.096%(+1.51)#219 |
| 14. | Bay Pines | 1.51% | 0.17%(+1.33)#14 | 0.096%(+1.41)#236 |
| 15. | Black Diamond | 1.51% | 0.17%(+1.33)#15 | 0.096%(+1.41)#237 |
| 16. | Crawfordville | 1.46% | 0.17%(+1.29)#16 | 0.096%(+1.37)#245 |
| 17. | Juno Ridge | 1.45% | 0.17%(+1.27)#17 | 0.096%(+1.35)#246 |
| 18. | Osprey | 1.44% | 0.17%(+1.26)#18 | 0.096%(+1.34)#250 |
| 19. | St Pete Beach | 1.43% | 0.17%(+1.25)#19 | 0.096%(+1.33)#253 |
| 20. | Black Hammock | 1.40% | 0.17%(+1.23)#20 | 0.096%(+1.31)#258 |
| 21. | The Meadows | 1.39% | 0.17%(+1.22)#21 | 0.096%(+1.29)#261 |
| 22. | Gifford | 1.36% | 0.17%(+1.18)#22 | 0.096%(+1.26)#272 |
| 23. | Palm Beach | 1.31% | 0.17%(+1.14)#23 | 0.096%(+1.22)#279 |
| 24. | Apalachicola | 1.28% | 0.17%(+1.10)#24 | 0.096%(+1.18)#289 |
| 25. | Tierra Verde | 1.25% | 0.17%(+1.08)#25 | 0.096%(+1.16)#297 |
| 26. | Viera East | 1.24% | 0.17%(+1.07)#26 | 0.096%(+1.15)#300 |
| 27. | Beverly Beach | 1.21% | 0.17%(+1.04)#27 | 0.096%(+1.12)#309 |
| 28. | South Patrick Shores | 1.19% | 0.17%(+1.01)#28 | 0.096%(+1.09)#316 |
| 29. | Holmes Beach | 1.04% | 0.17%(+0.866)#29 | 0.096%(+0.944)#378 |
| 30. | Grant Valkaria | 1.04% | 0.17%(+0.865)#30 | 0.096%(+0.944)#379 |
| 31. | Brookridge | 1.02% | 0.17%(+0.850)#31 | 0.096%(+0.928)#390 |
| 32. | Melbourne Village | 1.02% | 0.17%(+0.845)#32 | 0.096%(+0.923)#395 |
| 33. | Celebration | 1.01% | 0.17%(+0.831)#33 | 0.096%(+0.910)#402 |
| 34. | Inglis | 1.00% | 0.17%(+0.827)#34 | 0.096%(+0.905)#404 |
| 35. | Marco Shores-Hammock Bay | 0.97% | 0.17%(+0.798)#35 | 0.096%(+0.876)#421 |
| 36. | Havana | 0.94% | 0.17%(+0.766)#36 | 0.096%(+0.844)#447 |
| 37. | Palmer Ranch | 0.93% | 0.17%(+0.755)#37 | 0.096%(+0.833)#452 |
| 38. | Sawgrass | 0.92% | 0.17%(+0.748)#38 | 0.096%(+0.826)#457 |
| 39. | Glen Ridge | 0.91% | 0.17%(+0.739)#39 | 0.096%(+0.817)#466 |
| 40. | Timber Pines | 0.91% | 0.17%(+0.735)#40 | 0.096%(+0.813)#468 |
| 41. | Fort Denaud | 0.91% | 0.17%(+0.734)#41 | 0.096%(+0.812)#470 |
| 42. | Lake Clarke Shores | 0.90% | 0.17%(+0.726)#42 | 0.096%(+0.804)#473 |
| 43. | North Redington Beach | 0.89% | 0.17%(+0.715)#43 | 0.096%(+0.793)#484 |
| 44. | Edgewood | 0.86% | 0.17%(+0.681)#44 | 0.096%(+0.759)#516 |
| 45. | South Palm Beach | 0.85% | 0.17%(+0.675)#45 | 0.096%(+0.753)#520 |
| 46. | Rainbow Springs | 0.83% | 0.17%(+0.654)#46 | 0.096%(+0.732)#543 |
| 47. | South Sarasota | 0.82% | 0.17%(+0.650)#47 | 0.096%(+0.728)#547 |
| 48. | Nocatee | 0.79% | 0.17%(+0.619)#48 | 0.096%(+0.697)#577 |
| 49. | Juno Beach | 0.79% | 0.17%(+0.611)#49 | 0.096%(+0.689)#582 |
| 50. | Quail Ridge | 0.78% | 0.17%(+0.608)#50 | 0.096%(+0.686)#584 |
| 51. | Fort Myers Beach | 0.78% | 0.17%(+0.604)#51 | 0.096%(+0.682)#591 |
| 52. | Lauderdale Lakes | 0.74% | 0.17%(+0.569)#52 | 0.096%(+0.647)#630 |
| 53. | Cortez | 0.74% | 0.17%(+0.561)#53 | 0.096%(+0.639)#640 |
| 54. | Bokeelia | 0.72% | 0.17%(+0.543)#54 | 0.096%(+0.621)#654 |
| 55. | Briny Breezes | 0.70% | 0.17%(+0.527)#55 | 0.096%(+0.605)#666 |
| 56. | Citrus Hills | 0.70% | 0.17%(+0.523)#56 | 0.096%(+0.601)#669 |
| 57. | Lake Mary | 0.70% | 0.17%(+0.523)#57 | 0.096%(+0.601)#672 |
| 58. | Redington Shores | 0.67% | 0.17%(+0.499)#58 | 0.096%(+0.577)#706 |
| 59. | Bay Hill | 0.66% | 0.17%(+0.490)#59 | 0.096%(+0.568)#714 |
| 60. | Harbour Heights | 0.65% | 0.17%(+0.477)#60 | 0.096%(+0.555)#733 |
| 61. | Pebble Creek | 0.65% | 0.17%(+0.473)#61 | 0.096%(+0.551)#742 |
| 62. | Cabana Colony | 0.64% | 0.17%(+0.468)#62 | 0.096%(+0.546)#748 |
| 63. | Charlotte Harbor | 0.64% | 0.17%(+0.468)#63 | 0.096%(+0.546)#749 |
| 64. | Miramar Beach | 0.63% | 0.17%(+0.451)#64 | 0.096%(+0.529)#772 |
| 65. | West Palm Beach | 0.62% | 0.17%(+0.442)#65 | 0.096%(+0.520)#781 |
| 66. | Vilano Beach | 0.61% | 0.17%(+0.437)#66 | 0.096%(+0.515)#793 |
| 67. | Madeira Beach | 0.61% | 0.17%(+0.436)#67 | 0.096%(+0.514)#794 |
| 68. | Hill N Dale | 0.60% | 0.17%(+0.424)#68 | 0.096%(+0.502)#811 |
| 69. | Windermere | 0.59% | 0.17%(+0.417)#69 | 0.096%(+0.495)#826 |
| 70. | Key Largo | 0.59% | 0.17%(+0.416)#70 | 0.096%(+0.494)#829 |
| 71. | Gulf Stream | 0.59% | 0.17%(+0.415)#71 | 0.096%(+0.493)#830 |
| 72. | Plantation | 0.58% | 0.17%(+0.411)#72 | 0.096%(+0.489)#838 |
| 73. | Punta Rassa | 0.58% | 0.17%(+0.410)#73 | 0.096%(+0.488)#841 |
| 74. | Verona Walk | 0.57% | 0.17%(+0.393)#74 | 0.096%(+0.471)#869 |
| 75. | Washington Park | 0.56% | 0.17%(+0.389)#75 | 0.096%(+0.467)#872 |
| 76. | Lochmoor Waterway Estates | 0.56% | 0.17%(+0.389)#76 | 0.096%(+0.467)#874 |
| 77. | Lecanto | 0.56% | 0.17%(+0.388)#77 | 0.096%(+0.466)#875 |
| 78. | Island Walk | 0.56% | 0.17%(+0.386)#78 | 0.096%(+0.464)#884 |
| 79. | Butler Beach | 0.56% | 0.17%(+0.385)#79 | 0.096%(+0.463)#886 |
| 80. | North Palm Beach | 0.56% | 0.17%(+0.383)#80 | 0.096%(+0.461)#889 |
| 81. | Pinecrest | 0.55% | 0.17%(+0.378)#81 | 0.096%(+0.456)#893 |
| 82. | Hernando Beach | 0.55% | 0.17%(+0.373)#82 | 0.096%(+0.451)#912 |
| 83. | Spring Hill | 0.54% | 0.17%(+0.362)#83 | 0.096%(+0.440)#928 |
| 84. | Key Vista | 0.53% | 0.17%(+0.355)#84 | 0.096%(+0.433)#942 |
| 85. | Laurel | 0.52% | 0.17%(+0.348)#85 | 0.096%(+0.427)#958 |
| 86. | Venice Gardens | 0.51% | 0.17%(+0.341)#86 | 0.096%(+0.419)#973 |
| 87. | River Ridge | 0.51% | 0.17%(+0.336)#87 | 0.096%(+0.414)#983 |
| 88. | Oakland Park | 0.51% | 0.17%(+0.332)#88 | 0.096%(+0.410)#993 |
| 89. | Key West | 0.49% | 0.17%(+0.320)#89 | 0.096%(+0.398)#1,008 |
| 90. | Southgate | 0.49% | 0.17%(+0.311)#90 | 0.096%(+0.389)#1,033 |
| 91. | Longboat Key | 0.48% | 0.17%(+0.307)#91 | 0.096%(+0.385)#1,041 |
| 92. | Pelican Marsh | 0.48% | 0.17%(+0.303)#92 | 0.096%(+0.381)#1,058 |
| 93. | Tequesta | 0.47% | 0.17%(+0.300)#93 | 0.096%(+0.378)#1,072 |
| 94. | El Portal | 0.47% | 0.17%(+0.298)#94 | 0.096%(+0.376)#1,079 |
| 95. | St Augustine Beach | 0.47% | 0.17%(+0.298)#95 | 0.096%(+0.376)#1,081 |
| 96. | North Key Largo | 0.47% | 0.17%(+0.298)#96 | 0.096%(+0.376)#1,083 |
| 97. | Daytona Beach Shores | 0.47% | 0.17%(+0.297)#97 | 0.096%(+0.375)#1,084 |
| 98. | Big Coppitt Key | 0.47% | 0.17%(+0.296)#98 | 0.096%(+0.374)#1,089 |
| 99. | Palm Valley | 0.47% | 0.17%(+0.291)#99 | 0.096%(+0.369)#1,101 |
| 100. | Sun City Center | 0.46% | 0.17%(+0.283)#100 | 0.096%(+0.361)#1,117 |
Common Questions
What are the Top 10 Cities with the Highest Percentage of Immigrants from England in Florida?
Top 10 Cities with the Highest Percentage of Immigrants from England in Florida are:
#1
4.55%
#2
4.39%
#3
4.33%
#4
3.39%
#5
2.99%
#6
2.92%
#7
2.33%
#8
2.28%
#9
2.11%
#10
2.05%
What city has the Highest Percentage of Immigrants from England in Florida?
Desoto Lakes has the Highest Percentage of Immigrants from England in Florida with 4.55%.
What is the Percentage of Immigrants from England in the State of Florida?
Percentage of Immigrants from England in Florida is 0.17%.
What is the Percentage of Immigrants from England in the United States?
Percentage of Immigrants from England in the United States is 0.096%.