Cities with the Highest Percentage of Immigrants from England in South Carolina
RELATED REPORTS & OPTIONS
England
South Carolina
Compare Cities
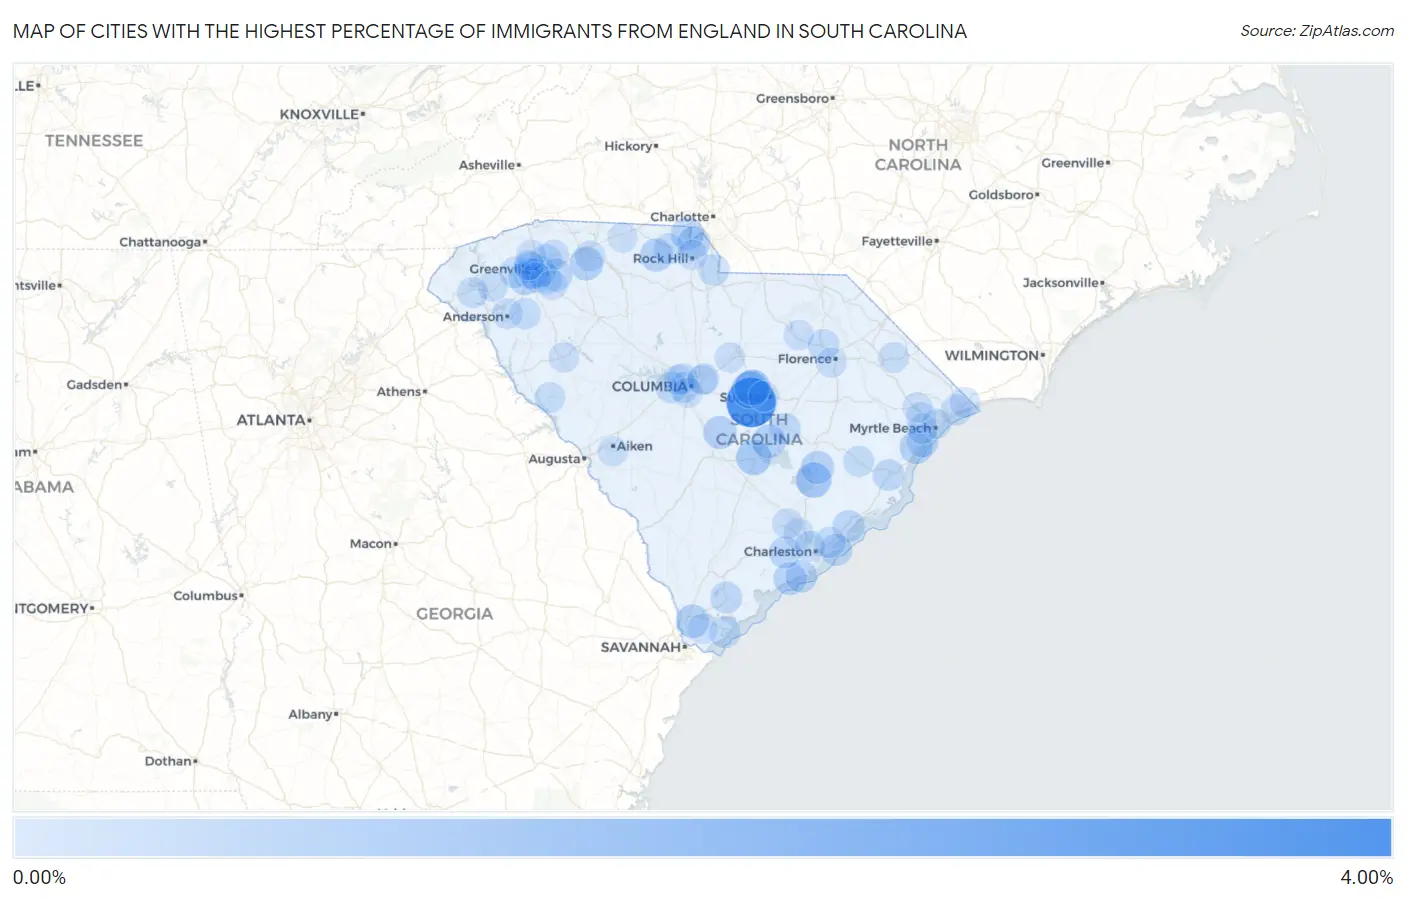
Map of Cities with the Highest Percentage of Immigrants from England in South Carolina
0.00%
4.00%
Cities with the Highest Percentage of Immigrants from England in South Carolina
| City | England | vs State | vs National | |
| 1. | Wedgefield | 3.27% | 0.099%(+3.17)#1 | 0.096%(+3.17)#77 |
| 2. | Stateburg | 1.15% | 0.099%(+1.05)#2 | 0.096%(+1.05)#329 |
| 3. | Oakland | 0.94% | 0.099%(+0.840)#3 | 0.096%(+0.843)#448 |
| 4. | Capitol View | 0.92% | 0.099%(+0.817)#4 | 0.096%(+0.820)#462 |
| 5. | Bonneau | 0.86% | 0.099%(+0.760)#5 | 0.096%(+0.763)#506 |
| 6. | Santee | 0.84% | 0.099%(+0.742)#6 | 0.096%(+0.745)#529 |
| 7. | Ben Avon | 0.65% | 0.099%(+0.548)#7 | 0.096%(+0.552)#737 |
| 8. | Summerton | 0.56% | 0.099%(+0.461)#8 | 0.096%(+0.464)#883 |
| 9. | Roebuck | 0.55% | 0.099%(+0.448)#9 | 0.096%(+0.451)#911 |
| 10. | Hardeeville | 0.55% | 0.099%(+0.447)#10 | 0.096%(+0.450)#914 |
| 11. | St Matthews | 0.52% | 0.099%(+0.418)#11 | 0.096%(+0.421)#968 |
| 12. | St Stephen | 0.51% | 0.099%(+0.406)#12 | 0.096%(+0.409)#994 |
| 13. | Keowee Key | 0.49% | 0.099%(+0.391)#13 | 0.096%(+0.394)#1,018 |
| 14. | Sharon | 0.49% | 0.099%(+0.387)#14 | 0.096%(+0.390)#1,030 |
| 15. | Murrells Inlet | 0.49% | 0.099%(+0.386)#15 | 0.096%(+0.389)#1,032 |
| 16. | Lake Wylie | 0.47% | 0.099%(+0.373)#16 | 0.096%(+0.376)#1,076 |
| 17. | Baxter | 0.45% | 0.099%(+0.353)#17 | 0.096%(+0.356)#1,129 |
| 18. | Tega Cay | 0.44% | 0.099%(+0.337)#18 | 0.096%(+0.341)#1,180 |
| 19. | Seabrook Island | 0.44% | 0.099%(+0.337)#19 | 0.096%(+0.340)#1,182 |
| 20. | Powdersville | 0.42% | 0.099%(+0.322)#20 | 0.096%(+0.325)#1,218 |
| 21. | Litchfield Beach | 0.37% | 0.099%(+0.271)#21 | 0.096%(+0.274)#1,419 |
| 22. | Five Forks | 0.37% | 0.099%(+0.266)#22 | 0.096%(+0.269)#1,435 |
| 23. | Garden City | 0.36% | 0.099%(+0.259)#23 | 0.096%(+0.262)#1,467 |
| 24. | Kiawah Island | 0.33% | 0.099%(+0.229)#24 | 0.096%(+0.232)#1,584 |
| 25. | Awendaw | 0.32% | 0.099%(+0.223)#25 | 0.096%(+0.227)#1,609 |
| 26. | Isle Of Palms | 0.32% | 0.099%(+0.223)#26 | 0.096%(+0.226)#1,612 |
| 27. | Ravenel | 0.31% | 0.099%(+0.212)#27 | 0.096%(+0.215)#1,665 |
| 28. | Beaufort | 0.29% | 0.099%(+0.195)#28 | 0.096%(+0.198)#1,755 |
| 29. | Georgetown | 0.27% | 0.099%(+0.172)#29 | 0.096%(+0.175)#1,892 |
| 30. | White Knoll | 0.26% | 0.099%(+0.165)#30 | 0.096%(+0.168)#1,944 |
| 31. | Manning | 0.26% | 0.099%(+0.159)#31 | 0.096%(+0.163)#1,975 |
| 32. | Lexington | 0.25% | 0.099%(+0.154)#32 | 0.096%(+0.157)#2,028 |
| 33. | Greenville | 0.25% | 0.099%(+0.150)#33 | 0.096%(+0.154)#2,049 |
| 34. | Hilton Head Island | 0.24% | 0.099%(+0.139)#34 | 0.096%(+0.142)#2,111 |
| 35. | The Cliffs Valley | 0.24% | 0.099%(+0.138)#35 | 0.096%(+0.141)#2,125 |
| 36. | Van Wyck | 0.23% | 0.099%(+0.130)#36 | 0.096%(+0.133)#2,177 |
| 37. | Darlington | 0.23% | 0.099%(+0.127)#37 | 0.096%(+0.131)#2,197 |
| 38. | Welcome | 0.22% | 0.099%(+0.124)#38 | 0.096%(+0.127)#2,224 |
| 39. | Taylors | 0.22% | 0.099%(+0.118)#39 | 0.096%(+0.121)#2,294 |
| 40. | York | 0.21% | 0.099%(+0.111)#40 | 0.096%(+0.115)#2,340 |
| 41. | Mount Pleasant | 0.20% | 0.099%(+0.098)#41 | 0.096%(+0.102)#2,467 |
| 42. | Belton | 0.18% | 0.099%(+0.084)#42 | 0.096%(+0.087)#2,615 |
| 43. | Easley | 0.18% | 0.099%(+0.082)#43 | 0.096%(+0.085)#2,640 |
| 44. | Mauldin | 0.18% | 0.099%(+0.079)#44 | 0.096%(+0.082)#2,666 |
| 45. | Daufuskie Island | 0.18% | 0.099%(+0.076)#45 | 0.096%(+0.079)#2,690 |
| 46. | Andrews | 0.14% | 0.099%(+0.039)#46 | 0.096%(+0.042)#3,117 |
| 47. | Parker | 0.14% | 0.099%(+0.037)#47 | 0.096%(+0.040)#3,140 |
| 48. | North Charleston | 0.13% | 0.099%(+0.034)#48 | 0.096%(+0.037)#3,179 |
| 49. | Woodfield | 0.13% | 0.099%(+0.027)#49 | 0.096%(+0.030)#3,262 |
| 50. | Sumter | 0.13% | 0.099%(+0.026)#50 | 0.096%(+0.029)#3,277 |
| 51. | Spartanburg | 0.13% | 0.099%(+0.026)#51 | 0.096%(+0.029)#3,278 |
| 52. | Mullins | 0.12% | 0.099%(+0.025)#52 | 0.096%(+0.028)#3,293 |
| 53. | Seneca | 0.12% | 0.099%(+0.025)#53 | 0.096%(+0.028)#3,295 |
| 54. | Arkwright | 0.12% | 0.099%(+0.016)#54 | 0.096%(+0.020)#3,389 |
| 55. | Charleston | 0.11% | 0.099%(+0.015)#55 | 0.096%(+0.018)#3,404 |
| 56. | Central | 0.11% | 0.099%(+0.014)#56 | 0.096%(+0.017)#3,421 |
| 57. | Mccormick | 0.11% | 0.099%(+0.009)#57 | 0.096%(+0.012)#3,496 |
| 58. | North Myrtle Beach | 0.11% | 0.099%(+0.007)#58 | 0.096%(+0.010)#3,529 |
| 59. | St Andrews | 0.10% | 0.099%(+0.005)#59 | 0.096%(+0.009)#3,544 |
| 60. | Carolina Forest | 0.10% | 0.099%(+0.001)#60 | 0.096%(+0.004)#3,612 |
| 61. | Red Hill | 0.096% | 0.099%(-0.003)#61 | 0.096%(-0.000)#3,672 |
| 62. | Summerville | 0.094% | 0.099%(-0.005)#62 | 0.096%(-0.002)#3,700 |
| 63. | Socastee | 0.090% | 0.099%(-0.010)#63 | 0.096%(-0.006)#3,777 |
| 64. | Greer | 0.089% | 0.099%(-0.010)#64 | 0.096%(-0.007)#3,787 |
| 65. | Dunean | 0.088% | 0.099%(-0.012)#65 | 0.096%(-0.009)#3,814 |
| 66. | West Columbia | 0.086% | 0.099%(-0.014)#66 | 0.096%(-0.010)#3,839 |
| 67. | Anderson | 0.085% | 0.099%(-0.014)#67 | 0.096%(-0.011)#3,850 |
| 68. | Seven Oaks | 0.082% | 0.099%(-0.017)#68 | 0.096%(-0.014)#3,895 |
| 69. | Little River | 0.082% | 0.099%(-0.018)#69 | 0.096%(-0.015)#3,902 |
| 70. | Travelers Rest | 0.076% | 0.099%(-0.024)#70 | 0.096%(-0.021)#3,999 |
| 71. | Cayce | 0.073% | 0.099%(-0.027)#71 | 0.096%(-0.024)#4,057 |
| 72. | Gantt | 0.070% | 0.099%(-0.029)#72 | 0.096%(-0.026)#4,099 |
| 73. | Lugoff | 0.064% | 0.099%(-0.036)#73 | 0.096%(-0.033)#4,202 |
| 74. | Berea | 0.056% | 0.099%(-0.044)#74 | 0.096%(-0.041)#4,350 |
| 75. | Columbia | 0.056% | 0.099%(-0.044)#75 | 0.096%(-0.041)#4,352 |
| 76. | Hartsville | 0.054% | 0.099%(-0.046)#76 | 0.096%(-0.043)#4,393 |
| 77. | Rock Hill | 0.046% | 0.099%(-0.054)#77 | 0.096%(-0.050)#4,515 |
| 78. | Bluffton | 0.041% | 0.099%(-0.059)#78 | 0.096%(-0.055)#4,600 |
| 79. | Aiken | 0.034% | 0.099%(-0.065)#79 | 0.096%(-0.062)#4,693 |
| 80. | Greenwood | 0.031% | 0.099%(-0.068)#80 | 0.096%(-0.065)#4,750 |
| 81. | Myrtle Beach | 0.031% | 0.099%(-0.069)#81 | 0.096%(-0.066)#4,762 |
| 82. | Florence | 0.028% | 0.099%(-0.072)#82 | 0.096%(-0.069)#4,810 |
| 83. | Wyboo | 0.026% | 0.099%(-0.073)#83 | 0.096%(-0.070)#4,827 |
| 84. | Conway | 0.024% | 0.099%(-0.076)#84 | 0.096%(-0.072)#4,866 |
| 85. | Gaffney | 0.024% | 0.099%(-0.076)#85 | 0.096%(-0.073)#4,869 |
| 86. | Simpsonville | 0.021% | 0.099%(-0.079)#86 | 0.096%(-0.076)#4,915 |
| 87. | Clemson University | 0.016% | 0.099%(-0.083)#87 | 0.096%(-0.080)#4,973 |
Common Questions
What are the Top 10 Cities with the Highest Percentage of Immigrants from England in South Carolina?
Top 10 Cities with the Highest Percentage of Immigrants from England in South Carolina are:
#1
3.27%
#2
1.15%
#3
0.94%
#4
0.86%
#5
0.84%
#6
0.56%
#7
0.55%
#8
0.55%
#9
0.52%
#10
0.51%
What city has the Highest Percentage of Immigrants from England in South Carolina?
Wedgefield has the Highest Percentage of Immigrants from England in South Carolina with 3.27%.
What is the Percentage of Immigrants from England in the State of South Carolina?
Percentage of Immigrants from England in South Carolina is 0.099%.
What is the Percentage of Immigrants from England in the United States?
Percentage of Immigrants from England in the United States is 0.096%.