Cities with the Highest Percentage of Immigrants from England in Minnesota
RELATED REPORTS & OPTIONS
England
Minnesota
Compare Cities
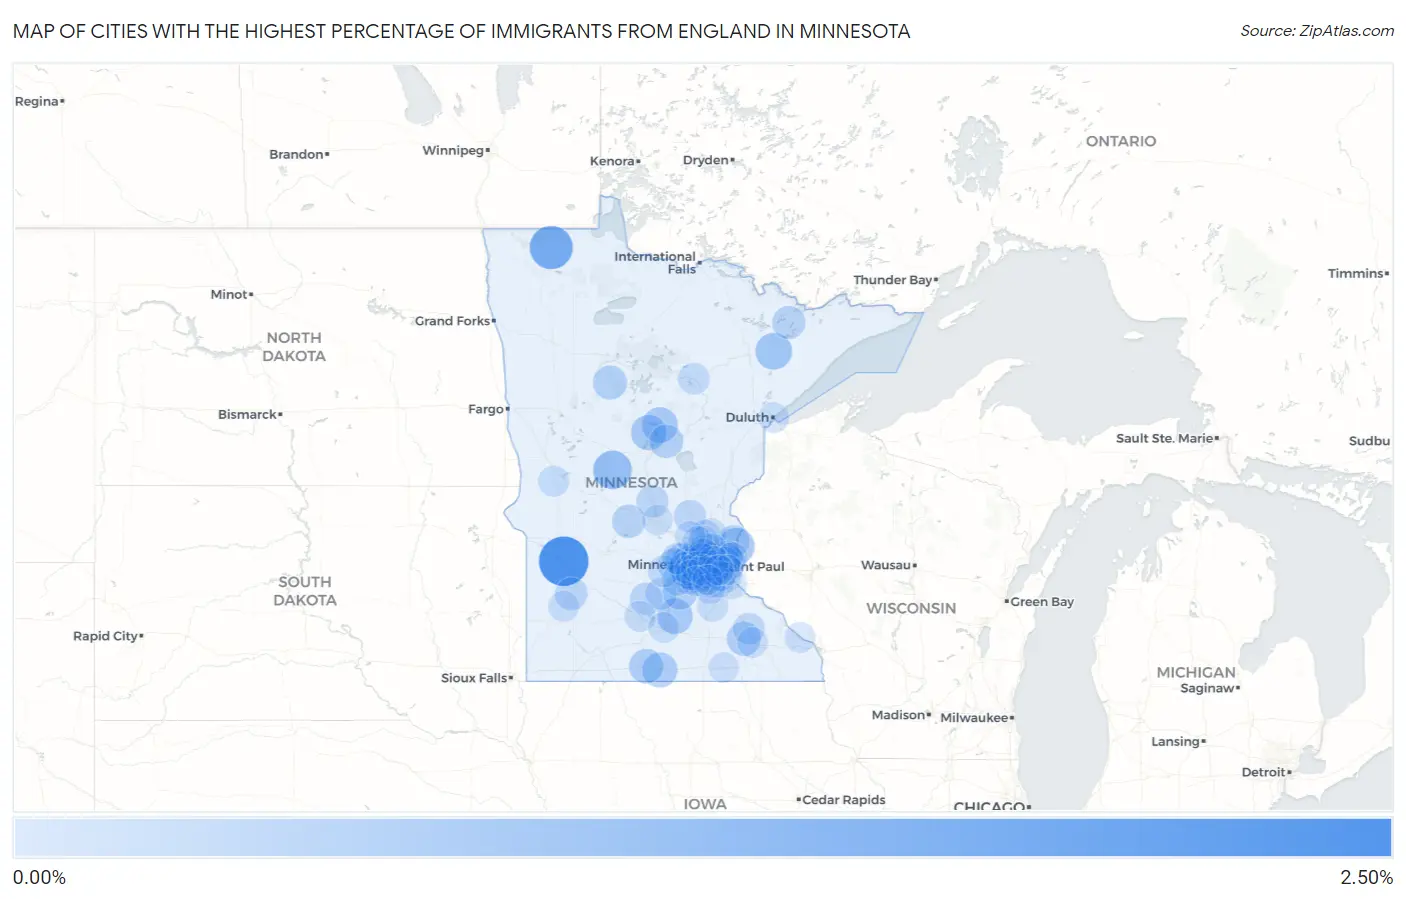
Map of Cities with the Highest Percentage of Immigrants from England in Minnesota
0.00%
2.50%
Cities with the Highest Percentage of Immigrants from England in Minnesota
| City | England | vs State | vs National | |
| 1. | Watson | 2.09% | 0.046%(+2.05)#1 | 0.096%(+2.00)#144 |
| 2. | Badger | 1.38% | 0.046%(+1.34)#2 | 0.096%(+1.29)#265 |
| 3. | Minnetonka Beach | 1.30% | 0.046%(+1.25)#3 | 0.096%(+1.20)#287 |
| 4. | Clarissa | 0.89% | 0.046%(+0.841)#4 | 0.096%(+0.791)#485 |
| 5. | Dresbach | 0.77% | 0.046%(+0.726)#5 | 0.096%(+0.676)#601 |
| 6. | Marine On St Croix | 0.69% | 0.046%(+0.647)#6 | 0.096%(+0.597)#679 |
| 7. | Hoyt Lakes | 0.67% | 0.046%(+0.622)#7 | 0.096%(+0.572)#709 |
| 8. | Crosslake | 0.57% | 0.046%(+0.524)#8 | 0.096%(+0.473)#863 |
| 9. | Pequot Lakes | 0.56% | 0.046%(+0.516)#9 | 0.096%(+0.466)#876 |
| 10. | Cleveland | 0.56% | 0.046%(+0.510)#10 | 0.096%(+0.460)#891 |
| 11. | Blue Earth | 0.50% | 0.046%(+0.457)#11 | 0.096%(+0.407)#997 |
| 12. | Granada | 0.45% | 0.046%(+0.400)#12 | 0.096%(+0.350)#1,154 |
| 13. | Belle Plaine | 0.42% | 0.046%(+0.375)#13 | 0.096%(+0.325)#1,221 |
| 14. | Byron | 0.41% | 0.046%(+0.362)#14 | 0.096%(+0.312)#1,270 |
| 15. | Independence | 0.40% | 0.046%(+0.357)#15 | 0.096%(+0.307)#1,284 |
| 16. | Lake George | 0.39% | 0.046%(+0.344)#16 | 0.096%(+0.294)#1,334 |
| 17. | Watertown | 0.36% | 0.046%(+0.314)#17 | 0.096%(+0.264)#1,459 |
| 18. | Ironton | 0.36% | 0.046%(+0.311)#18 | 0.096%(+0.261)#1,468 |
| 19. | Eden Prairie | 0.35% | 0.046%(+0.307)#19 | 0.096%(+0.257)#1,479 |
| 20. | Lake Elmo | 0.35% | 0.046%(+0.299)#20 | 0.096%(+0.249)#1,507 |
| 21. | St Martin | 0.32% | 0.046%(+0.278)#21 | 0.096%(+0.228)#1,602 |
| 22. | Ely | 0.31% | 0.046%(+0.260)#22 | 0.096%(+0.210)#1,689 |
| 23. | Chaska | 0.31% | 0.046%(+0.260)#23 | 0.096%(+0.210)#1,690 |
| 24. | Wayzata | 0.30% | 0.046%(+0.252)#24 | 0.096%(+0.202)#1,739 |
| 25. | Cottonwood | 0.26% | 0.046%(+0.215)#25 | 0.096%(+0.165)#1,958 |
| 26. | Brooklyn Center | 0.23% | 0.046%(+0.186)#26 | 0.096%(+0.136)#2,160 |
| 27. | Winthrop | 0.23% | 0.046%(+0.185)#27 | 0.096%(+0.135)#2,164 |
| 28. | Scandia | 0.23% | 0.046%(+0.181)#28 | 0.096%(+0.131)#2,194 |
| 29. | Pine Springs | 0.23% | 0.046%(+0.179)#29 | 0.096%(+0.129)#2,205 |
| 30. | Princeton | 0.22% | 0.046%(+0.178)#30 | 0.096%(+0.128)#2,215 |
| 31. | Rice | 0.21% | 0.046%(+0.164)#31 | 0.096%(+0.114)#2,347 |
| 32. | Orono | 0.21% | 0.046%(+0.160)#32 | 0.096%(+0.110)#2,385 |
| 33. | Oronoco | 0.18% | 0.046%(+0.131)#33 | 0.096%(+0.081)#2,677 |
| 34. | Arlington | 0.16% | 0.046%(+0.118)#34 | 0.096%(+0.068)#2,813 |
| 35. | Lester Prairie | 0.16% | 0.046%(+0.110)#35 | 0.096%(+0.060)#2,901 |
| 36. | Grand Rapids | 0.15% | 0.046%(+0.106)#36 | 0.096%(+0.056)#2,952 |
| 37. | Cologne | 0.14% | 0.046%(+0.098)#37 | 0.096%(+0.048)#3,050 |
| 38. | Mound | 0.13% | 0.046%(+0.083)#38 | 0.096%(+0.033)#3,231 |
| 39. | St Louis Park | 0.13% | 0.046%(+0.083)#39 | 0.096%(+0.033)#3,234 |
| 40. | Falcon Heights | 0.11% | 0.046%(+0.068)#40 | 0.096%(+0.018)#3,406 |
| 41. | Delano | 0.11% | 0.046%(+0.061)#41 | 0.096%(+0.011)#3,516 |
| 42. | Shoreview | 0.10% | 0.046%(+0.058)#42 | 0.096%(+0.008)#3,554 |
| 43. | Grant | 0.10% | 0.046%(+0.054)#43 | 0.096%(+0.004)#3,610 |
| 44. | New Ulm | 0.100% | 0.046%(+0.053)#44 | 0.096%(+0.003)#3,628 |
| 45. | Bloomington | 0.099% | 0.046%(+0.052)#45 | 0.096%(+0.002)#3,648 |
| 46. | Oakdale | 0.093% | 0.046%(+0.046)#46 | 0.096%(-0.004)#3,720 |
| 47. | Shorewood | 0.091% | 0.046%(+0.044)#47 | 0.096%(-0.006)#3,763 |
| 48. | Elbow Lake | 0.089% | 0.046%(+0.043)#48 | 0.096%(-0.007)#3,788 |
| 49. | Marshall | 0.081% | 0.046%(+0.034)#49 | 0.096%(-0.016)#3,918 |
| 50. | St Paul | 0.079% | 0.046%(+0.033)#50 | 0.096%(-0.017)#3,938 |
| 51. | Plymouth | 0.079% | 0.046%(+0.033)#51 | 0.096%(-0.017)#3,949 |
| 52. | Richfield | 0.073% | 0.046%(+0.027)#52 | 0.096%(-0.023)#4,040 |
| 53. | Northfield | 0.073% | 0.046%(+0.027)#53 | 0.096%(-0.023)#4,047 |
| 54. | Maple Grove | 0.073% | 0.046%(+0.026)#54 | 0.096%(-0.024)#4,055 |
| 55. | Coon Rapids | 0.073% | 0.046%(+0.026)#55 | 0.096%(-0.024)#4,059 |
| 56. | Minneapolis | 0.073% | 0.046%(+0.026)#56 | 0.096%(-0.024)#4,061 |
| 57. | Hastings | 0.073% | 0.046%(+0.026)#57 | 0.096%(-0.024)#4,065 |
| 58. | New Brighton | 0.069% | 0.046%(+0.023)#58 | 0.096%(-0.027)#4,109 |
| 59. | East Bethel | 0.067% | 0.046%(+0.021)#59 | 0.096%(-0.029)#4,135 |
| 60. | Oak Grove | 0.067% | 0.046%(+0.021)#60 | 0.096%(-0.029)#4,139 |
| 61. | Andover | 0.064% | 0.046%(+0.018)#61 | 0.096%(-0.032)#4,189 |
| 62. | North Mankato | 0.063% | 0.046%(+0.017)#62 | 0.096%(-0.033)#4,214 |
| 63. | Eagan | 0.060% | 0.046%(+0.014)#63 | 0.096%(-0.036)#4,277 |
| 64. | Minnetonka | 0.060% | 0.046%(+0.013)#64 | 0.096%(-0.037)#4,282 |
| 65. | Savage | 0.059% | 0.046%(+0.012)#65 | 0.096%(-0.038)#4,308 |
| 66. | Cottage Grove | 0.051% | 0.046%(+0.005)#66 | 0.096%(-0.045)#4,430 |
| 67. | Blaine | 0.050% | 0.046%(+0.004)#67 | 0.096%(-0.046)#4,450 |
| 68. | Brooklyn Park | 0.049% | 0.046%(+0.003)#68 | 0.096%(-0.047)#4,462 |
| 69. | Crystal | 0.048% | 0.046%(+0.002)#69 | 0.096%(-0.048)#4,487 |
| 70. | Rochester | 0.046% | 0.046%(+0.000)#70 | 0.096%(-0.050)#4,505 |
| 71. | Duluth | 0.043% | 0.046%(-0.004)#71 | 0.096%(-0.054)#4,576 |
| 72. | Rosemount | 0.042% | 0.046%(-0.004)#72 | 0.096%(-0.054)#4,579 |
| 73. | Winona | 0.038% | 0.046%(-0.008)#73 | 0.096%(-0.058)#4,635 |
| 74. | Apple Valley | 0.038% | 0.046%(-0.009)#74 | 0.096%(-0.059)#4,645 |
| 75. | Chanhassen | 0.035% | 0.046%(-0.011)#75 | 0.096%(-0.062)#4,691 |
| 76. | Mendota Heights | 0.034% | 0.046%(-0.012)#76 | 0.096%(-0.062)#4,694 |
| 77. | Edina | 0.034% | 0.046%(-0.012)#77 | 0.096%(-0.062)#4,698 |
| 78. | Lakeville | 0.033% | 0.046%(-0.014)#78 | 0.096%(-0.064)#4,723 |
| 79. | St Cloud | 0.032% | 0.046%(-0.014)#79 | 0.096%(-0.064)#4,732 |
| 80. | Stillwater | 0.031% | 0.046%(-0.015)#80 | 0.096%(-0.065)#4,751 |
| 81. | Austin | 0.031% | 0.046%(-0.016)#81 | 0.096%(-0.066)#4,759 |
| 82. | Inver Grove Heights | 0.028% | 0.046%(-0.018)#82 | 0.096%(-0.068)#4,801 |
| 83. | Roseville | 0.028% | 0.046%(-0.019)#83 | 0.096%(-0.069)#4,805 |
| 84. | Woodbury | 0.026% | 0.046%(-0.020)#84 | 0.096%(-0.070)#4,826 |
| 85. | Shakopee | 0.025% | 0.046%(-0.021)#85 | 0.096%(-0.071)#4,856 |
| 86. | West St Paul | 0.024% | 0.046%(-0.022)#86 | 0.096%(-0.072)#4,864 |
| 87. | Elk River | 0.023% | 0.046%(-0.023)#87 | 0.096%(-0.073)#4,879 |
| 88. | Ramsey | 0.022% | 0.046%(-0.025)#88 | 0.096%(-0.075)#4,903 |
| 89. | Burnsville | 0.016% | 0.046%(-0.031)#89 | 0.096%(-0.081)#4,981 |
Common Questions
What are the Top 10 Cities with the Highest Percentage of Immigrants from England in Minnesota?
Top 10 Cities with the Highest Percentage of Immigrants from England in Minnesota are:
#1
2.09%
#2
1.38%
#3
1.30%
#4
0.89%
#5
0.69%
#6
0.67%
#7
0.57%
#8
0.56%
#9
0.56%
#10
0.50%
What city has the Highest Percentage of Immigrants from England in Minnesota?
Watson has the Highest Percentage of Immigrants from England in Minnesota with 2.09%.
What is the Percentage of Immigrants from England in the State of Minnesota?
Percentage of Immigrants from England in Minnesota is 0.046%.
What is the Percentage of Immigrants from England in the United States?
Percentage of Immigrants from England in the United States is 0.096%.