Cities with the Highest Percentage of Immigrants from Ecuador in North Carolina
RELATED REPORTS & OPTIONS
Ecuador
North Carolina
Compare Cities
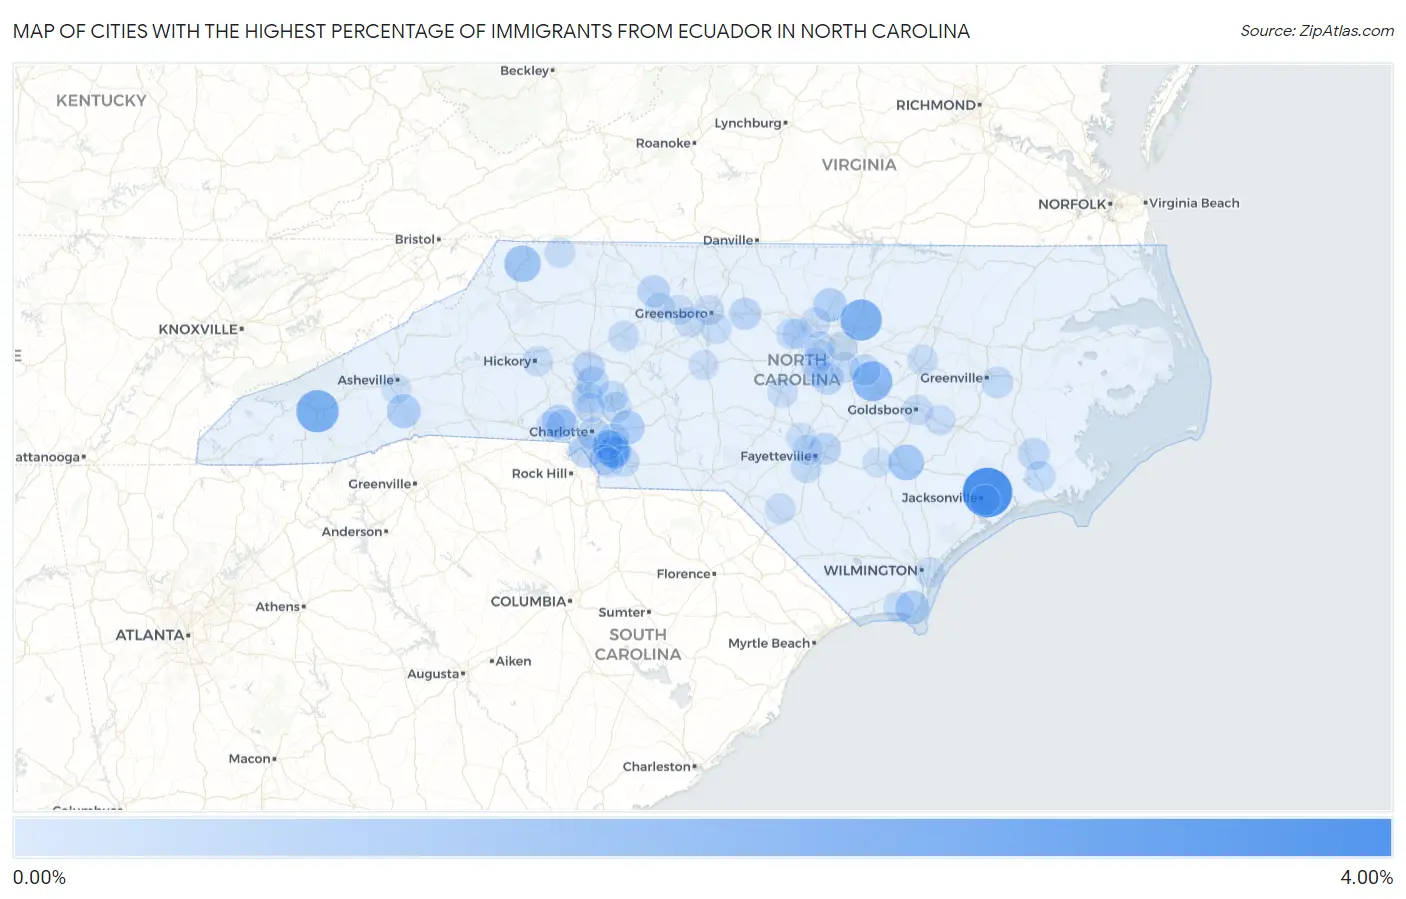
Map of Cities with the Highest Percentage of Immigrants from Ecuador in North Carolina
0.00%
4.00%
Cities with the Highest Percentage of Immigrants from Ecuador in North Carolina
| City | Ecuador | vs State | vs National | |
| 1. | Pumpkin Center | 3.49% | 0.074%(+3.41)#-1 | 0.15%(+3.34)#0 |
| 2. | Dillsboro | 2.16% | 0.074%(+2.09)#353 | 0.15%(+2.02)#9,869 |
| 3. | Youngsville | 1.98% | 0.074%(+1.91)#354 | 0.15%(+1.84)#9,870 |
| 4. | Wilson S Mills | 1.70% | 0.074%(+1.63)#355 | 0.15%(+1.56)#9,871 |
| 5. | Jefferson | 1.12% | 0.074%(+1.05)#356 | 0.15%(+0.977)#9,872 |
| 6. | Stallings | 1.00% | 0.074%(+0.926)#387 | 0.15%(+0.855)#11,300 |
| 7. | Warsaw | 0.98% | 0.074%(+0.910)#388 | 0.15%(+0.839)#11,301 |
| 8. | Midland | 0.68% | 0.074%(+0.610)#389 | 0.15%(+0.539)#11,302 |
| 9. | Mountain Home | 0.67% | 0.074%(+0.596)#390 | 0.15%(+0.525)#11,303 |
| 10. | Southport | 0.65% | 0.074%(+0.573)#391 | 0.15%(+0.502)#11,304 |
| 11. | Butner | 0.62% | 0.074%(+0.547)#392 | 0.15%(+0.476)#11,305 |
| 12. | Pineville | 0.57% | 0.074%(+0.496)#393 | 0.15%(+0.424)#11,306 |
| 13. | Ranlo | 0.53% | 0.074%(+0.461)#394 | 0.15%(+0.390)#11,307 |
| 14. | Lake Park | 0.51% | 0.074%(+0.435)#395 | 0.15%(+0.363)#11,308 |
| 15. | Mooresville | 0.41% | 0.074%(+0.336)#396 | 0.15%(+0.265)#11,309 |
| 16. | Indian Trail | 0.39% | 0.074%(+0.315)#397 | 0.15%(+0.244)#11,310 |
| 17. | Rural Hall | 0.39% | 0.074%(+0.311)#398 | 0.15%(+0.240)#11,311 |
| 18. | Charlotte | 0.38% | 0.074%(+0.309)#399 | 0.15%(+0.238)#11,312 |
| 19. | Fuquay Varina | 0.38% | 0.074%(+0.304)#400 | 0.15%(+0.233)#11,313 |
| 20. | Burlington | 0.38% | 0.074%(+0.303)#401 | 0.15%(+0.232)#11,314 |
| 21. | Eastover | 0.36% | 0.074%(+0.281)#402 | 0.15%(+0.210)#11,315 |
| 22. | Troutman | 0.35% | 0.074%(+0.278)#403 | 0.15%(+0.207)#11,900 |
| 23. | Fairfield Harbour | 0.28% | 0.074%(+0.210)#404 | 0.15%(+0.139)#11,901 |
| 24. | Lowell | 0.27% | 0.074%(+0.197)#405 | 0.15%(+0.126)#11,902 |
| 25. | Simpson | 0.26% | 0.074%(+0.185)#406 | 0.15%(+0.114)#11,903 |
| 26. | Cornelius | 0.22% | 0.074%(+0.146)#407 | 0.15%(+0.075)#11,904 |
| 27. | Mint Hill | 0.22% | 0.074%(+0.144)#408 | 0.15%(+0.073)#11,905 |
| 28. | Monroe | 0.21% | 0.074%(+0.138)#409 | 0.15%(+0.067)#11,906 |
| 29. | Hope Mills | 0.21% | 0.074%(+0.135)#410 | 0.15%(+0.064)#11,907 |
| 30. | Clayton | 0.21% | 0.074%(+0.135)#411 | 0.15%(+0.063)#11,908 |
| 31. | Concord | 0.17% | 0.074%(+0.101)#412 | 0.15%(+0.029)#11,909 |
| 32. | Havelock | 0.17% | 0.074%(+0.099)#413 | 0.15%(+0.028)#12,105 |
| 33. | Kannapolis | 0.17% | 0.074%(+0.097)#414 | 0.15%(+0.025)#12,106 |
| 34. | Mocksville | 0.15% | 0.074%(+0.078)#415 | 0.15%(+0.007)#12,107 |
| 35. | Carrboro | 0.15% | 0.074%(+0.076)#416 | 0.15%(+0.005)#12,108 |
| 36. | Matthews | 0.15% | 0.074%(+0.071)#417 | 0.15%(-0.000)#12,109 |
| 37. | Pembroke | 0.14% | 0.074%(+0.067)#418 | 0.15%(-0.004)#12,110 |
| 38. | Oak Island | 0.13% | 0.074%(+0.054)#419 | 0.15%(-0.017)#12,111 |
| 39. | Gastonia | 0.11% | 0.074%(+0.039)#420 | 0.15%(-0.032)#12,112 |
| 40. | Sparta | 0.11% | 0.074%(+0.037)#421 | 0.15%(-0.034)#12,113 |
| 41. | Weddington | 0.11% | 0.074%(+0.032)#422 | 0.15%(-0.039)#12,114 |
| 42. | Sanford | 0.11% | 0.074%(+0.031)#423 | 0.15%(-0.040)#12,115 |
| 43. | Goldsboro | 0.10% | 0.074%(+0.027)#424 | 0.15%(-0.044)#12,116 |
| 44. | Pleasant Garden | 0.10% | 0.074%(+0.026)#425 | 0.15%(-0.045)#12,117 |
| 45. | Hickory | 0.095% | 0.074%(+0.020)#426 | 0.15%(-0.051)#12,118 |
| 46. | Garner | 0.092% | 0.074%(+0.017)#427 | 0.15%(-0.054)#12,119 |
| 47. | High Point | 0.089% | 0.074%(+0.014)#428 | 0.15%(-0.057)#12,120 |
| 48. | Durham | 0.083% | 0.074%(+0.009)#429 | 0.15%(-0.062)#12,121 |
| 49. | Kernersville | 0.081% | 0.074%(+0.007)#430 | 0.15%(-0.064)#12,122 |
| 50. | Anderson Creek | 0.076% | 0.074%(+0.002)#431 | 0.15%(-0.069)#12,123 |
| 51. | La Grange | 0.076% | 0.074%(+0.002)#432 | 0.15%(-0.069)#12,124 |
| 52. | Cary | 0.074% | 0.074%(+0.000)#433 | 0.15%(-0.071)#12,125 |
| 53. | Greensboro | 0.070% | 0.074%(-0.004)#434 | 0.15%(-0.075)#12,126 |
| 54. | Wilson | 0.069% | 0.074%(-0.005)#435 | 0.15%(-0.076)#12,127 |
| 55. | Chapel Hill | 0.066% | 0.074%(-0.008)#436 | 0.15%(-0.079)#12,128 |
| 56. | Fayetteville | 0.065% | 0.074%(-0.009)#437 | 0.15%(-0.081)#12,129 |
| 57. | Jacksonville | 0.061% | 0.074%(-0.013)#438 | 0.15%(-0.084)#12,130 |
| 58. | Wesley Chapel | 0.057% | 0.074%(-0.017)#439 | 0.15%(-0.088)#12,131 |
| 59. | Holly Springs | 0.055% | 0.074%(-0.019)#440 | 0.15%(-0.091)#12,132 |
| 60. | Asheboro | 0.052% | 0.074%(-0.023)#441 | 0.15%(-0.094)#12,133 |
| 61. | Apex | 0.044% | 0.074%(-0.030)#442 | 0.15%(-0.101)#12,134 |
| 62. | Morrisville | 0.037% | 0.074%(-0.037)#443 | 0.15%(-0.108)#12,135 |
| 63. | Huntersville | 0.034% | 0.074%(-0.040)#444 | 0.15%(-0.111)#12,136 |
| 64. | Raleigh | 0.029% | 0.074%(-0.045)#445 | 0.15%(-0.116)#12,137 |
| 65. | Asheville | 0.029% | 0.074%(-0.045)#446 | 0.15%(-0.116)#12,138 |
| 66. | Clinton | 0.024% | 0.074%(-0.050)#447 | 0.15%(-0.121)#12,139 |
| 67. | Winston Salem | 0.015% | 0.074%(-0.059)#448 | 0.15%(-0.130)#12,140 |
| 68. | Wilmington | 0.015% | 0.074%(-0.060)#449 | 0.15%(-0.131)#12,141 |
| 69. | Spring Lake | 0.0085% | 0.074%(-0.066)#450 | 0.15%(-0.137)#12,142 |
Common Questions
What are the Top 10 Cities with the Highest Percentage of Immigrants from Ecuador in North Carolina?
Top 10 Cities with the Highest Percentage of Immigrants from Ecuador in North Carolina are:
#1
3.49%
#2
2.16%
#3
1.98%
#4
1.70%
#5
1.12%
#6
1.00%
#7
0.98%
#8
0.68%
#9
0.67%
#10
0.65%
What city has the Highest Percentage of Immigrants from Ecuador in North Carolina?
Pumpkin Center has the Highest Percentage of Immigrants from Ecuador in North Carolina with 3.49%.
What is the Percentage of Immigrants from Ecuador in the State of North Carolina?
Percentage of Immigrants from Ecuador in North Carolina is 0.074%.
What is the Percentage of Immigrants from Ecuador in the United States?
Percentage of Immigrants from Ecuador in the United States is 0.15%.