Cities with the Highest Percentage of Immigrants from Ecuador in Minnesota
RELATED REPORTS & OPTIONS
Ecuador
Minnesota
Compare Cities
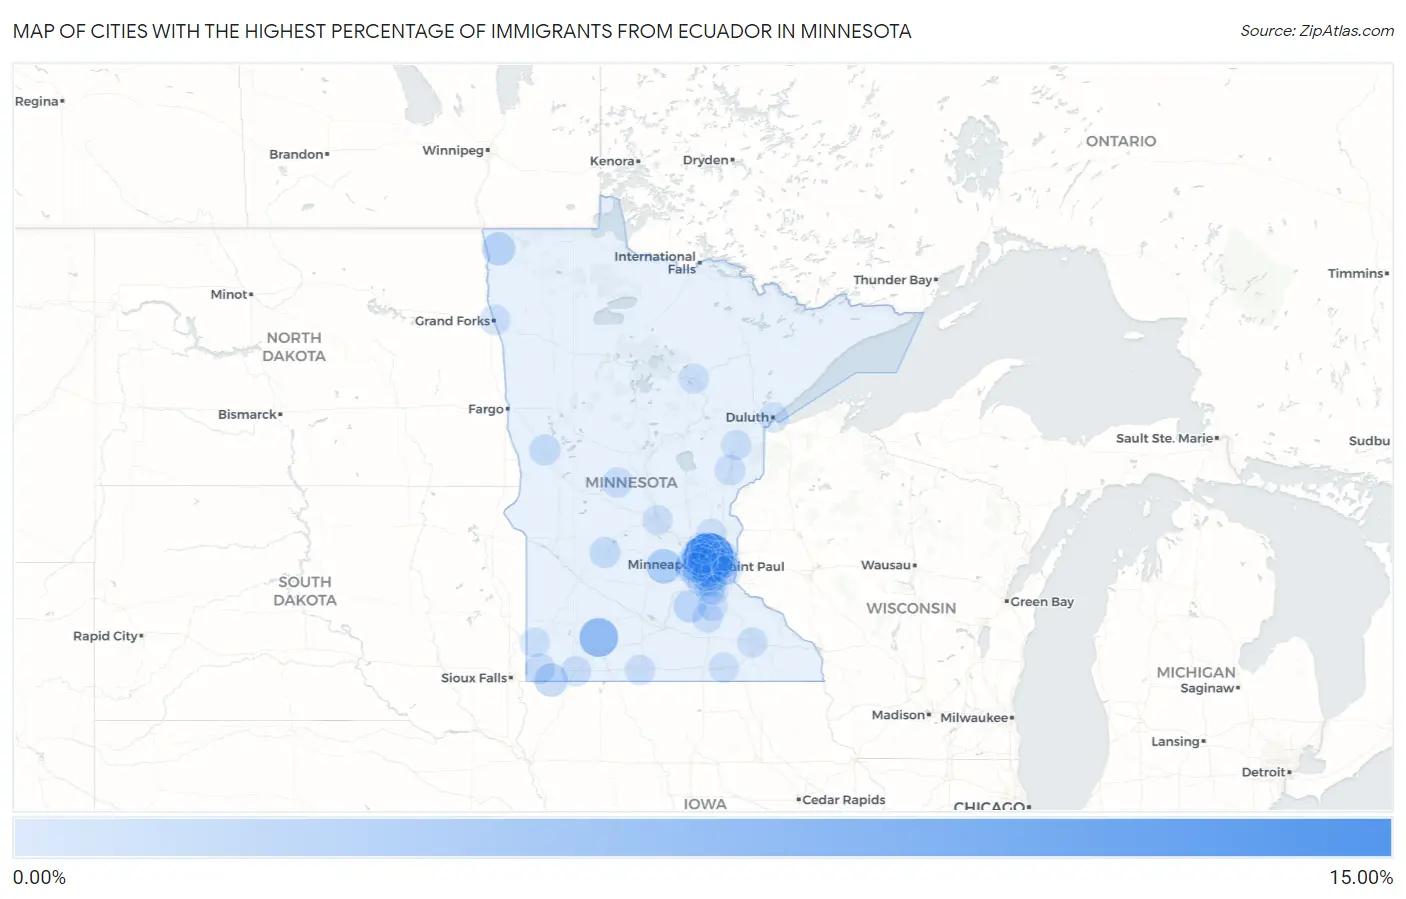
Map of Cities with the Highest Percentage of Immigrants from Ecuador in Minnesota
0.00%
15.00%
Cities with the Highest Percentage of Immigrants from Ecuador in Minnesota
| City | Ecuador | vs State | vs National | |
| 1. | Hilltop | 12.94% | 0.15%(+12.8)#16 | 0.15%(+12.8)#1,784 |
| 2. | Jeffers | 5.56% | 0.15%(+5.41)#135 | 0.15%(+5.41)#6,199 |
| 3. | Columbia Heights | 3.19% | 0.15%(+3.04)#136 | 0.15%(+3.04)#6,200 |
| 4. | Winsted | 2.85% | 0.15%(+2.71)#149 | 0.15%(+2.71)#6,655 |
| 5. | Ellsworth | 2.02% | 0.15%(+1.88)#150 | 0.15%(+1.88)#6,656 |
| 6. | Hallock | 2.00% | 0.15%(+1.85)#151 | 0.15%(+1.85)#6,657 |
| 7. | Fridley | 1.55% | 0.15%(+1.41)#152 | 0.15%(+1.41)#6,658 |
| 8. | Montgomery | 1.47% | 0.15%(+1.33)#153 | 0.15%(+1.33)#6,659 |
| 9. | Long Lake | 1.17% | 0.15%(+1.02)#154 | 0.15%(+1.02)#6,660 |
| 10. | Minneapolis | 0.95% | 0.15%(+0.805)#155 | 0.15%(+0.808)#6,661 |
| 11. | Elizabeth | 0.74% | 0.15%(+0.587)#156 | 0.15%(+0.590)#6,662 |
| 12. | Burnsville | 0.69% | 0.15%(+0.539)#157 | 0.15%(+0.541)#6,663 |
| 13. | Willmar | 0.66% | 0.15%(+0.514)#158 | 0.15%(+0.516)#6,664 |
| 14. | Robbinsdale | 0.48% | 0.15%(+0.336)#269 | 0.15%(+0.339)#10,145 |
| 15. | Brooklyn Center | 0.46% | 0.15%(+0.314)#270 | 0.15%(+0.317)#10,146 |
| 16. | Minnetonka Beach | 0.43% | 0.15%(+0.284)#271 | 0.15%(+0.287)#10,147 |
| 17. | St Louis Park | 0.41% | 0.15%(+0.258)#282 | 0.15%(+0.261)#10,453 |
| 18. | Luverne | 0.35% | 0.15%(+0.198)#317 | 0.15%(+0.201)#11,406 |
| 19. | Osseo | 0.34% | 0.15%(+0.194)#327 | 0.15%(+0.196)#11,606 |
| 20. | Sandstone | 0.31% | 0.15%(+0.164)#328 | 0.15%(+0.167)#11,607 |
| 21. | Brooklyn Park | 0.30% | 0.15%(+0.156)#329 | 0.15%(+0.158)#11,608 |
| 22. | Maplewood | 0.28% | 0.15%(+0.137)#330 | 0.15%(+0.140)#11,609 |
| 23. | Savage | 0.27% | 0.15%(+0.117)#331 | 0.15%(+0.120)#11,610 |
| 24. | East Grand Forks | 0.26% | 0.15%(+0.115)#332 | 0.15%(+0.118)#11,611 |
| 25. | Worthington | 0.20% | 0.15%(+0.054)#333 | 0.15%(+0.057)#11,612 |
| 26. | Plymouth | 0.19% | 0.15%(+0.045)#334 | 0.15%(+0.047)#11,613 |
| 27. | Champlin | 0.19% | 0.15%(+0.042)#338 | 0.15%(+0.045)#11,975 |
| 28. | South St Paul | 0.17% | 0.15%(+0.027)#339 | 0.15%(+0.030)#11,976 |
| 29. | Fairmont | 0.17% | 0.15%(+0.025)#340 | 0.15%(+0.028)#11,977 |
| 30. | Long Prairie | 0.16% | 0.15%(+0.016)#341 | 0.15%(+0.019)#11,978 |
| 31. | Blaine | 0.15% | 0.15%(-0.001)#342 | 0.15%(+0.002)#11,979 |
| 32. | Moose Lake | 0.12% | 0.15%(-0.026)#343 | 0.15%(-0.023)#11,980 |
| 33. | Faribault | 0.11% | 0.15%(-0.033)#344 | 0.15%(-0.031)#11,981 |
| 34. | Roseville | 0.11% | 0.15%(-0.043)#345 | 0.15%(-0.040)#11,982 |
| 35. | Maple Grove | 0.10% | 0.15%(-0.047)#346 | 0.15%(-0.044)#12,033 |
| 36. | Shoreview | 0.10% | 0.15%(-0.048)#347 | 0.15%(-0.045)#12,034 |
| 37. | Lakeville | 0.092% | 0.15%(-0.056)#348 | 0.15%(-0.053)#12,035 |
| 38. | Apple Valley | 0.088% | 0.15%(-0.060)#349 | 0.15%(-0.057)#12,036 |
| 39. | St Cloud | 0.087% | 0.15%(-0.061)#350 | 0.15%(-0.058)#12,037 |
| 40. | East Bethel | 0.084% | 0.15%(-0.064)#351 | 0.15%(-0.061)#12,038 |
| 41. | Eden Prairie | 0.080% | 0.15%(-0.068)#352 | 0.15%(-0.065)#12,039 |
| 42. | Bloomington | 0.077% | 0.15%(-0.071)#353 | 0.15%(-0.068)#12,040 |
| 43. | Rochester | 0.064% | 0.15%(-0.084)#354 | 0.15%(-0.082)#12,041 |
| 44. | Eagan | 0.054% | 0.15%(-0.094)#355 | 0.15%(-0.091)#12,042 |
| 45. | Austin | 0.054% | 0.15%(-0.095)#356 | 0.15%(-0.092)#12,043 |
| 46. | Richfield | 0.052% | 0.15%(-0.097)#357 | 0.15%(-0.094)#12,044 |
| 47. | Oakdale | 0.050% | 0.15%(-0.098)#358 | 0.15%(-0.095)#12,045 |
| 48. | Golden Valley | 0.050% | 0.15%(-0.098)#359 | 0.15%(-0.096)#12,046 |
| 49. | White Bear Lake | 0.049% | 0.15%(-0.099)#360 | 0.15%(-0.096)#12,047 |
| 50. | St Paul | 0.047% | 0.15%(-0.102)#361 | 0.15%(-0.099)#12,048 |
| 51. | Northfield | 0.044% | 0.15%(-0.104)#362 | 0.15%(-0.101)#12,049 |
| 52. | Coon Rapids | 0.038% | 0.15%(-0.110)#363 | 0.15%(-0.107)#12,050 |
| 53. | Farmington | 0.034% | 0.15%(-0.114)#364 | 0.15%(-0.111)#12,051 |
| 54. | Woodbury | 0.030% | 0.15%(-0.118)#365 | 0.15%(-0.115)#12,052 |
| 55. | Minnetonka | 0.030% | 0.15%(-0.118)#366 | 0.15%(-0.115)#12,053 |
| 56. | Pipestone | 0.024% | 0.15%(-0.124)#367 | 0.15%(-0.121)#12,054 |
| 57. | Duluth | 0.020% | 0.15%(-0.129)#368 | 0.15%(-0.126)#12,055 |
| 58. | Grand Rapids | 0.018% | 0.15%(-0.130)#369 | 0.15%(-0.127)#12,056 |
| 59. | Crystal | 0.017% | 0.15%(-0.131)#370 | 0.15%(-0.128)#12,057 |
Common Questions
What are the Top 10 Cities with the Highest Percentage of Immigrants from Ecuador in Minnesota?
Top 10 Cities with the Highest Percentage of Immigrants from Ecuador in Minnesota are:
#1
12.94%
#2
5.56%
#3
3.19%
#4
2.85%
#5
2.02%
#6
2.00%
#7
1.55%
#8
1.47%
#9
1.17%
#10
0.95%
What city has the Highest Percentage of Immigrants from Ecuador in Minnesota?
Hilltop has the Highest Percentage of Immigrants from Ecuador in Minnesota with 12.94%.
What is the Percentage of Immigrants from Ecuador in the State of Minnesota?
Percentage of Immigrants from Ecuador in Minnesota is 0.15%.
What is the Percentage of Immigrants from Ecuador in the United States?
Percentage of Immigrants from Ecuador in the United States is 0.15%.