Cities with the Highest Percentage of Immigrants from Ecuador in Washington
RELATED REPORTS & OPTIONS
Ecuador
Washington
Compare Cities
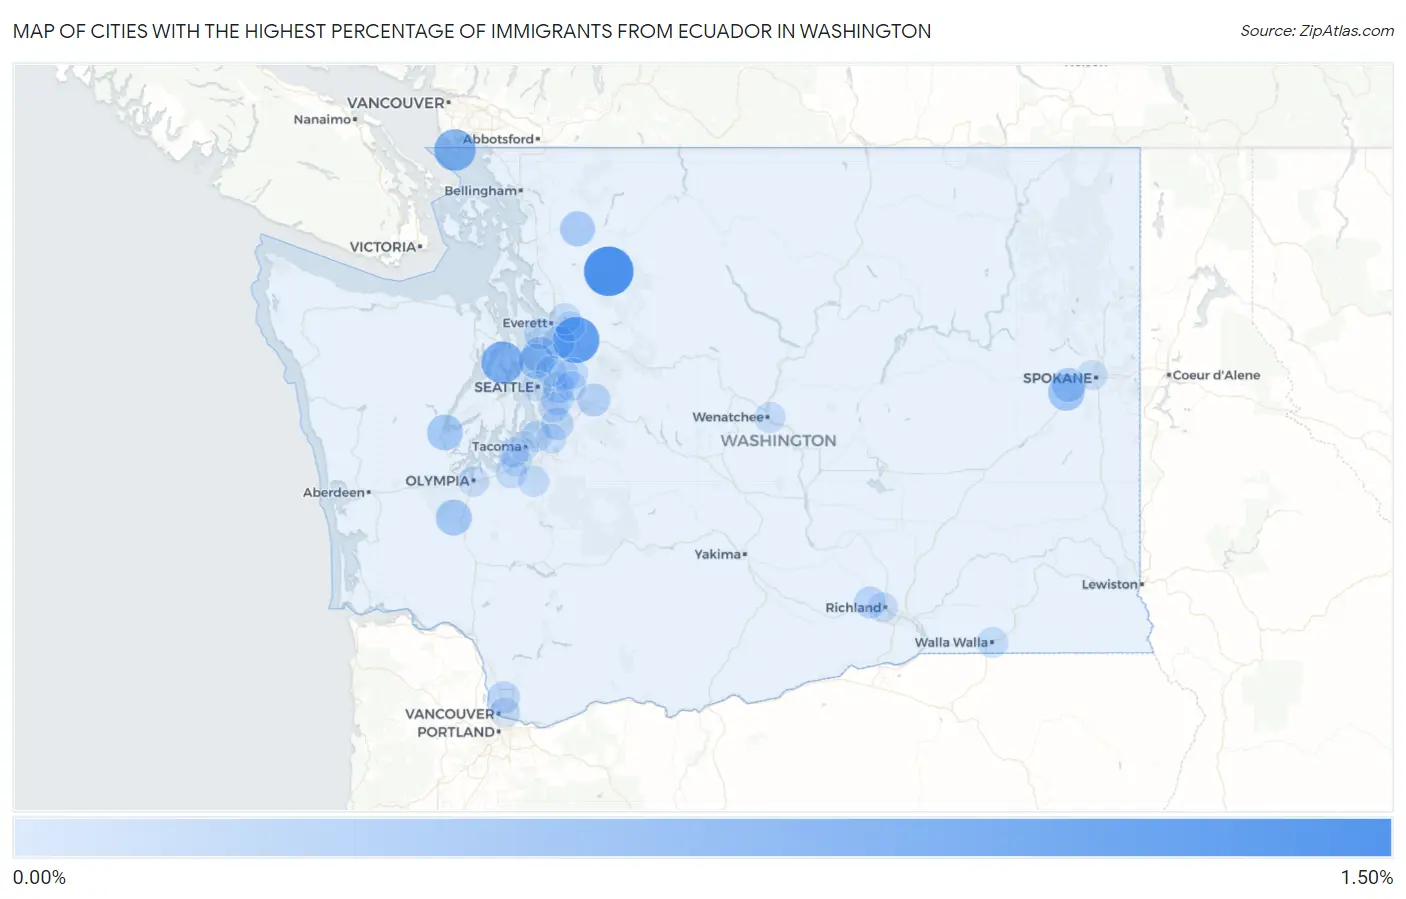
Map of Cities with the Highest Percentage of Immigrants from Ecuador in Washington
0.00%
1.50%
Cities with the Highest Percentage of Immigrants from Ecuador in Washington
| City | Ecuador | vs State | vs National | |
| 1. | Swede Heaven | 1.10% | 0.020%(+1.08)#-1 | 0.15%(+0.954)#0 |
| 2. | Monroe North | 0.90% | 0.020%(+0.884)#282 | 0.15%(+0.759)#7,989 |
| 3. | Poulsbo | 0.67% | 0.020%(+0.648)#283 | 0.15%(+0.523)#7,990 |
| 4. | Point Roberts | 0.64% | 0.020%(+0.620)#284 | 0.15%(+0.495)#7,991 |
| 5. | Medical Lake | 0.35% | 0.020%(+0.326)#285 | 0.15%(+0.201)#7,992 |
| 6. | Mountlake Terrace | 0.32% | 0.020%(+0.298)#286 | 0.15%(+0.173)#7,993 |
| 7. | Rochester | 0.32% | 0.020%(+0.298)#287 | 0.15%(+0.173)#7,994 |
| 8. | Skokomish | 0.31% | 0.020%(+0.290)#320 | 0.15%(+0.165)#8,913 |
| 9. | Shoreline | 0.27% | 0.020%(+0.249)#321 | 0.15%(+0.124)#8,914 |
| 10. | Hamilton | 0.27% | 0.020%(+0.246)#322 | 0.15%(+0.121)#8,915 |
| 11. | Fairchild Afb | 0.22% | 0.020%(+0.200)#323 | 0.15%(+0.075)#8,916 |
| 12. | Snoqualmie | 0.16% | 0.020%(+0.140)#324 | 0.15%(+0.015)#8,917 |
| 13. | Newcastle | 0.13% | 0.020%(+0.111)#325 | 0.15%(-0.014)#8,918 |
| 14. | Mount Vista | 0.13% | 0.020%(+0.105)#349 | 0.15%(-0.020)#9,871 |
| 15. | Kent | 0.12% | 0.020%(+0.102)#350 | 0.15%(-0.023)#9,872 |
| 16. | Silver Firs | 0.12% | 0.020%(+0.101)#351 | 0.15%(-0.024)#9,873 |
| 17. | West Richland | 0.10% | 0.020%(+0.082)#352 | 0.15%(-0.042)#9,874 |
| 18. | Mukilteo | 0.089% | 0.020%(+0.069)#353 | 0.15%(-0.056)#9,875 |
| 19. | Fort Lewis | 0.082% | 0.020%(+0.062)#354 | 0.15%(-0.063)#9,876 |
| 20. | Bellevue | 0.082% | 0.020%(+0.061)#355 | 0.15%(-0.064)#9,877 |
| 21. | Union Hill Novelty Hill | 0.069% | 0.020%(+0.049)#377 | 0.15%(-0.076)#11,667 |
| 22. | Federal Way | 0.067% | 0.020%(+0.047)#378 | 0.15%(-0.078)#11,668 |
| 23. | Lake Stevens | 0.062% | 0.020%(+0.042)#379 | 0.15%(-0.083)#11,669 |
| 24. | East Wenatchee | 0.057% | 0.020%(+0.037)#380 | 0.15%(-0.088)#11,670 |
| 25. | Walla Walla | 0.056% | 0.020%(+0.036)#381 | 0.15%(-0.089)#11,671 |
| 26. | Elk Plain | 0.049% | 0.020%(+0.029)#382 | 0.15%(-0.096)#11,672 |
| 27. | Redmond | 0.049% | 0.020%(+0.029)#383 | 0.15%(-0.096)#11,673 |
| 28. | Kirkland | 0.048% | 0.020%(+0.028)#384 | 0.15%(-0.097)#11,674 |
| 29. | Olympia | 0.044% | 0.020%(+0.023)#385 | 0.15%(-0.102)#11,675 |
| 30. | Lakewood | 0.040% | 0.020%(+0.019)#386 | 0.15%(-0.106)#11,676 |
| 31. | Richland | 0.023% | 0.020%(+0.003)#387 | 0.15%(-0.122)#11,677 |
| 32. | Renton | 0.023% | 0.020%(+0.003)#388 | 0.15%(-0.122)#11,678 |
| 33. | Vancouver | 0.022% | 0.020%(+0.002)#389 | 0.15%(-0.123)#11,679 |
| 34. | Sammamish | 0.021% | 0.020%(+0.001)#390 | 0.15%(-0.124)#11,680 |
| 35. | Everett | 0.015% | 0.020%(-0.005)#391 | 0.15%(-0.130)#11,681 |
| 36. | University Place | 0.014% | 0.020%(-0.006)#392 | 0.15%(-0.131)#11,682 |
| 37. | Seattle | 0.012% | 0.020%(-0.009)#393 | 0.15%(-0.134)#11,683 |
| 38. | Auburn | 0.012% | 0.020%(-0.009)#394 | 0.15%(-0.134)#11,684 |
| 39. | Spokane | 0.011% | 0.020%(-0.009)#395 | 0.15%(-0.134)#11,685 |
| 40. | Tacoma | 0.0018% | 0.020%(-0.018)#396 | 0.15%(-0.143)#11,686 |
Common Questions
What are the Top 10 Cities with the Highest Percentage of Immigrants from Ecuador in Washington?
Top 10 Cities with the Highest Percentage of Immigrants from Ecuador in Washington are:
#1
1.10%
#2
0.90%
#3
0.67%
#4
0.64%
#5
0.35%
#6
0.32%
#7
0.32%
#8
0.31%
#9
0.27%
#10
0.27%
What city has the Highest Percentage of Immigrants from Ecuador in Washington?
Swede Heaven has the Highest Percentage of Immigrants from Ecuador in Washington with 1.10%.
What is the Percentage of Immigrants from Ecuador in the State of Washington?
Percentage of Immigrants from Ecuador in Washington is 0.020%.
What is the Percentage of Immigrants from Ecuador in the United States?
Percentage of Immigrants from Ecuador in the United States is 0.15%.