Cities with the Highest Percentage of Immigrants from Ecuador in Virginia
RELATED REPORTS & OPTIONS
Ecuador
Virginia
Compare Cities
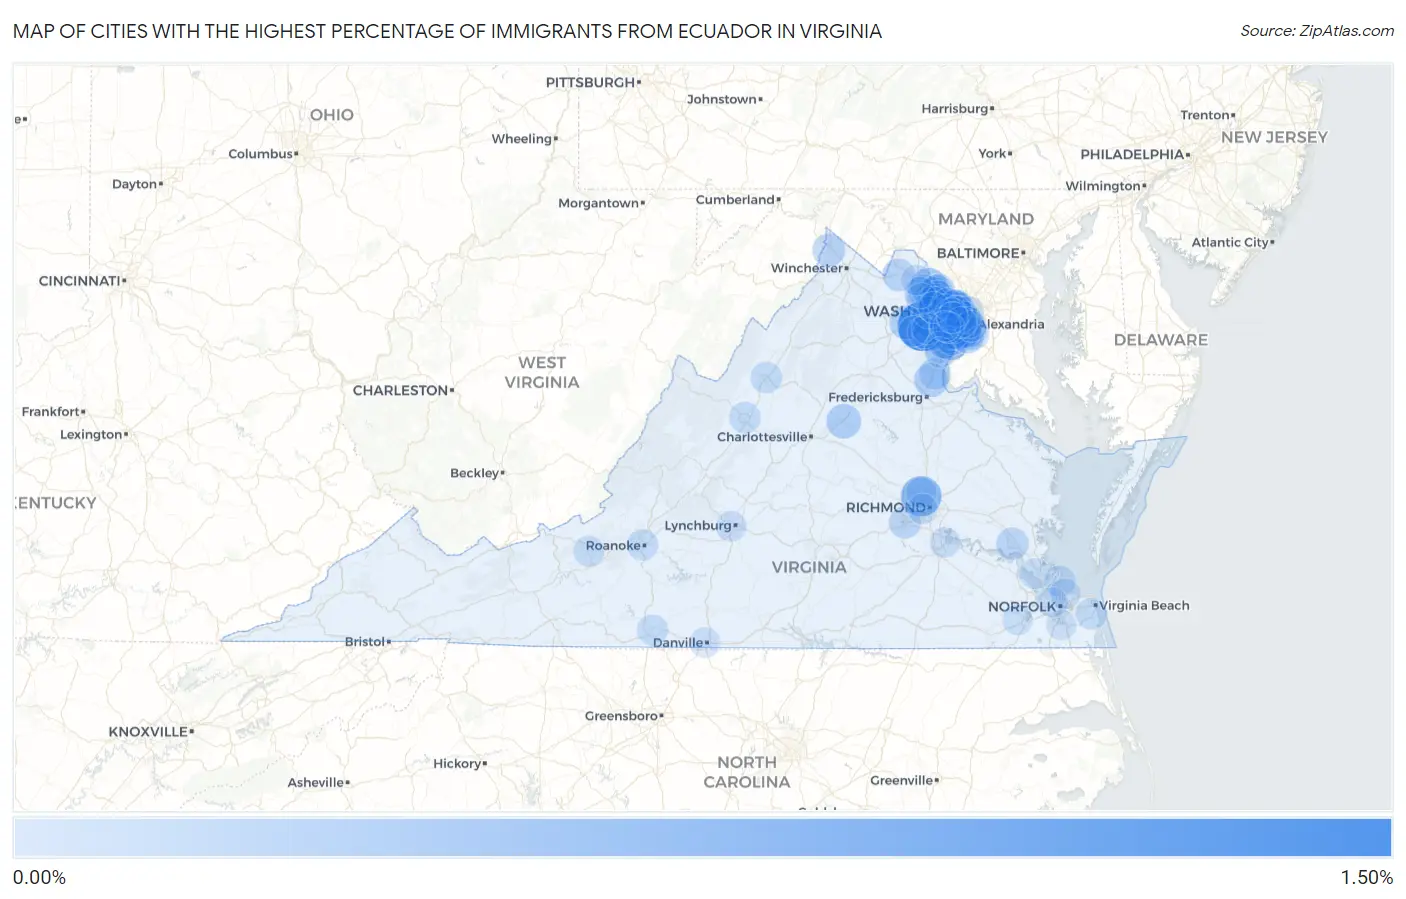
Map of Cities with the Highest Percentage of Immigrants from Ecuador in Virginia
0.00%
1.50%
Cities with the Highest Percentage of Immigrants from Ecuador in Virginia
| City | Ecuador | vs State | vs National | |
| 1. | Sudley | 1.41% | 0.055%(+1.36)#17 | 0.15%(+1.26)#2,801 |
| 2. | Dumbarton | 0.73% | 0.055%(+0.671)#70 | 0.15%(+0.580)#5,802 |
| 3. | Dunn Loring | 0.69% | 0.055%(+0.634)#183 | 0.15%(+0.544)#9,774 |
| 4. | Franconia | 0.69% | 0.055%(+0.632)#242 | 0.15%(+0.542)#11,553 |
| 5. | Moorefield | 0.64% | 0.055%(+0.583)#243 | 0.15%(+0.492)#11,554 |
| 6. | Occoquan | 0.56% | 0.055%(+0.505)#244 | 0.15%(+0.414)#11,555 |
| 7. | South Run | 0.46% | 0.055%(+0.406)#245 | 0.15%(+0.316)#11,556 |
| 8. | University Center | 0.45% | 0.055%(+0.395)#246 | 0.15%(+0.305)#11,557 |
| 9. | West Falls Church | 0.43% | 0.055%(+0.379)#247 | 0.15%(+0.289)#11,558 |
| 10. | Pimmit Hills | 0.42% | 0.055%(+0.361)#254 | 0.15%(+0.270)#11,798 |
| 11. | Centreville | 0.38% | 0.055%(+0.322)#255 | 0.15%(+0.232)#11,799 |
| 12. | Sterling | 0.38% | 0.055%(+0.322)#256 | 0.15%(+0.231)#11,800 |
| 13. | Tysons | 0.33% | 0.055%(+0.278)#257 | 0.15%(+0.188)#11,801 |
| 14. | Woodlawn Cdp Fairfax County | 0.33% | 0.055%(+0.276)#258 | 0.15%(+0.186)#11,802 |
| 15. | Groveton | 0.33% | 0.055%(+0.274)#259 | 0.15%(+0.183)#11,803 |
| 16. | Gordonsville | 0.31% | 0.055%(+0.254)#260 | 0.15%(+0.163)#11,804 |
| 17. | Lake Ridge | 0.30% | 0.055%(+0.243)#261 | 0.15%(+0.152)#11,805 |
| 18. | Stafford Courthouse | 0.28% | 0.055%(+0.226)#262 | 0.15%(+0.135)#11,806 |
| 19. | Haymarket | 0.25% | 0.055%(+0.200)#263 | 0.15%(+0.109)#11,807 |
| 20. | Springfield | 0.24% | 0.055%(+0.181)#264 | 0.15%(+0.090)#11,808 |
| 21. | Ashburn | 0.23% | 0.055%(+0.172)#265 | 0.15%(+0.081)#11,809 |
| 22. | Crosspointe | 0.23% | 0.055%(+0.172)#266 | 0.15%(+0.081)#11,810 |
| 23. | Difficult Run | 0.21% | 0.055%(+0.156)#267 | 0.15%(+0.066)#11,811 |
| 24. | Hayfield | 0.21% | 0.055%(+0.150)#268 | 0.15%(+0.060)#11,812 |
| 25. | Fort Hunt | 0.19% | 0.055%(+0.133)#269 | 0.15%(+0.042)#11,813 |
| 26. | Sugarland Run | 0.19% | 0.055%(+0.133)#270 | 0.15%(+0.042)#11,814 |
| 27. | Purcellville | 0.18% | 0.055%(+0.125)#271 | 0.15%(+0.034)#11,815 |
| 28. | Lake Holiday | 0.18% | 0.055%(+0.124)#272 | 0.15%(+0.034)#11,816 |
| 29. | Falls Church | 0.18% | 0.055%(+0.124)#273 | 0.15%(+0.033)#11,817 |
| 30. | Laurel Hill | 0.18% | 0.055%(+0.122)#274 | 0.15%(+0.032)#11,818 |
| 31. | Fair Oaks | 0.18% | 0.055%(+0.122)#275 | 0.15%(+0.031)#11,819 |
| 32. | Herndon | 0.17% | 0.055%(+0.113)#276 | 0.15%(+0.022)#11,820 |
| 33. | Williamsburg | 0.16% | 0.055%(+0.107)#277 | 0.15%(+0.016)#12,251 |
| 34. | Buckhall | 0.16% | 0.055%(+0.105)#278 | 0.15%(+0.014)#12,252 |
| 35. | Newington | 0.15% | 0.055%(+0.100)#279 | 0.15%(+0.010)#12,253 |
| 36. | Lowes Island | 0.15% | 0.055%(+0.096)#280 | 0.15%(+0.006)#12,254 |
| 37. | Brandermill | 0.15% | 0.055%(+0.092)#281 | 0.15%(+0.002)#12,255 |
| 38. | Arlington | 0.14% | 0.055%(+0.084)#282 | 0.15%(-0.006)#12,256 |
| 39. | Mount Vernon | 0.14% | 0.055%(+0.081)#283 | 0.15%(-0.010)#12,257 |
| 40. | Annandale | 0.13% | 0.055%(+0.078)#284 | 0.15%(-0.013)#12,258 |
| 41. | Aquia Harbour | 0.13% | 0.055%(+0.075)#285 | 0.15%(-0.016)#12,259 |
| 42. | West Springfield | 0.12% | 0.055%(+0.069)#286 | 0.15%(-0.021)#12,260 |
| 43. | Manassas | 0.12% | 0.055%(+0.065)#287 | 0.15%(-0.026)#12,261 |
| 44. | Reston | 0.11% | 0.055%(+0.059)#288 | 0.15%(-0.031)#12,262 |
| 45. | Mcnair | 0.11% | 0.055%(+0.058)#289 | 0.15%(-0.033)#12,263 |
| 46. | Chantilly | 0.10% | 0.055%(+0.049)#290 | 0.15%(-0.041)#12,264 |
| 47. | Staunton | 0.098% | 0.055%(+0.043)#291 | 0.15%(-0.048)#12,265 |
| 48. | Bailey S Crossroads | 0.097% | 0.055%(+0.042)#292 | 0.15%(-0.048)#12,266 |
| 49. | Harrisonburg | 0.097% | 0.055%(+0.042)#293 | 0.15%(-0.049)#12,267 |
| 50. | Loudoun Valley Estates | 0.095% | 0.055%(+0.040)#294 | 0.15%(-0.050)#12,268 |
| 51. | Newington Forest | 0.095% | 0.055%(+0.040)#295 | 0.15%(-0.050)#12,269 |
| 52. | Lake Barcroft | 0.094% | 0.055%(+0.040)#296 | 0.15%(-0.051)#12,270 |
| 53. | Dranesville | 0.091% | 0.055%(+0.036)#297 | 0.15%(-0.055)#12,271 |
| 54. | Oakton | 0.090% | 0.055%(+0.036)#298 | 0.15%(-0.055)#12,272 |
| 55. | Mclean | 0.087% | 0.055%(+0.032)#299 | 0.15%(-0.059)#12,273 |
| 56. | Dale City | 0.087% | 0.055%(+0.032)#300 | 0.15%(-0.059)#12,274 |
| 57. | Roanoke | 0.079% | 0.055%(+0.024)#301 | 0.15%(-0.067)#12,275 |
| 58. | Virginia Beach | 0.078% | 0.055%(+0.023)#302 | 0.15%(-0.067)#12,276 |
| 59. | Hampton | 0.076% | 0.055%(+0.021)#303 | 0.15%(-0.069)#12,277 |
| 60. | Broadlands | 0.075% | 0.055%(+0.021)#304 | 0.15%(-0.070)#12,278 |
| 61. | Alexandria | 0.072% | 0.055%(+0.018)#305 | 0.15%(-0.073)#12,279 |
| 62. | Rose Hill Cdp Fairfax County | 0.071% | 0.055%(+0.016)#306 | 0.15%(-0.074)#12,280 |
| 63. | Wolf Trap | 0.070% | 0.055%(+0.015)#307 | 0.15%(-0.075)#12,281 |
| 64. | Kings Park West | 0.068% | 0.055%(+0.013)#308 | 0.15%(-0.077)#12,282 |
| 65. | Martinsville | 0.066% | 0.055%(+0.012)#309 | 0.15%(-0.079)#12,283 |
| 66. | Merrifield | 0.065% | 0.055%(+0.011)#310 | 0.15%(-0.080)#12,284 |
| 67. | Manassas Park | 0.058% | 0.055%(+0.004)#311 | 0.15%(-0.087)#12,285 |
| 68. | Franklin Farm | 0.058% | 0.055%(+0.004)#312 | 0.15%(-0.087)#12,286 |
| 69. | Huntington | 0.057% | 0.055%(+0.003)#313 | 0.15%(-0.088)#12,336 |
| 70. | Leesylvania | 0.054% | 0.055%(-0.000)#314 | 0.15%(-0.091)#12,337 |
| 71. | Newport News | 0.052% | 0.055%(-0.003)#315 | 0.15%(-0.093)#12,338 |
| 72. | Idylwood | 0.051% | 0.055%(-0.004)#316 | 0.15%(-0.095)#12,339 |
| 73. | Lincolnia | 0.050% | 0.055%(-0.004)#317 | 0.15%(-0.095)#12,340 |
| 74. | Blacksburg | 0.042% | 0.055%(-0.013)#318 | 0.15%(-0.103)#12,341 |
| 75. | Montclair | 0.041% | 0.055%(-0.014)#319 | 0.15%(-0.104)#12,342 |
| 76. | Burke | 0.034% | 0.055%(-0.021)#320 | 0.15%(-0.111)#12,413 |
| 77. | Burke Centre | 0.033% | 0.055%(-0.021)#321 | 0.15%(-0.112)#12,414 |
| 78. | Leesburg | 0.033% | 0.055%(-0.022)#322 | 0.15%(-0.112)#12,415 |
| 79. | Norfolk | 0.032% | 0.055%(-0.023)#323 | 0.15%(-0.113)#12,416 |
| 80. | Woodburn | 0.030% | 0.055%(-0.025)#324 | 0.15%(-0.115)#12,417 |
| 81. | Laurel | 0.027% | 0.055%(-0.028)#325 | 0.15%(-0.118)#12,418 |
| 82. | Danville | 0.026% | 0.055%(-0.029)#326 | 0.15%(-0.119)#12,419 |
| 83. | Linton Hall | 0.023% | 0.055%(-0.031)#327 | 0.15%(-0.122)#12,420 |
| 84. | Hopewell | 0.022% | 0.055%(-0.033)#328 | 0.15%(-0.124)#12,421 |
| 85. | Lynchburg | 0.021% | 0.055%(-0.033)#329 | 0.15%(-0.124)#12,422 |
| 86. | Suffolk | 0.013% | 0.055%(-0.042)#330 | 0.15%(-0.133)#12,423 |
| 87. | Richmond | 0.012% | 0.055%(-0.042)#331 | 0.15%(-0.133)#12,424 |
| 88. | Chesapeake | 0.0072% | 0.055%(-0.047)#332 | 0.15%(-0.138)#12,425 |
| 89. | Portsmouth | 0.0072% | 0.055%(-0.047)#333 | 0.15%(-0.138)#12,426 |
Common Questions
What are the Top 10 Cities with the Highest Percentage of Immigrants from Ecuador in Virginia?
Top 10 Cities with the Highest Percentage of Immigrants from Ecuador in Virginia are:
#1
1.41%
#2
0.73%
#3
0.69%
#4
0.69%
#5
0.56%
#6
0.46%
#7
0.45%
#8
0.43%
#9
0.42%
#10
0.38%
What city has the Highest Percentage of Immigrants from Ecuador in Virginia?
Sudley has the Highest Percentage of Immigrants from Ecuador in Virginia with 1.41%.
What is the Percentage of Immigrants from Ecuador in the State of Virginia?
Percentage of Immigrants from Ecuador in Virginia is 0.055%.
What is the Percentage of Immigrants from Ecuador in the United States?
Percentage of Immigrants from Ecuador in the United States is 0.15%.