Cities with the Most Immigrants from China in West Virginia
RELATED REPORTS & OPTIONS
China
West Virginia
Compare Cities
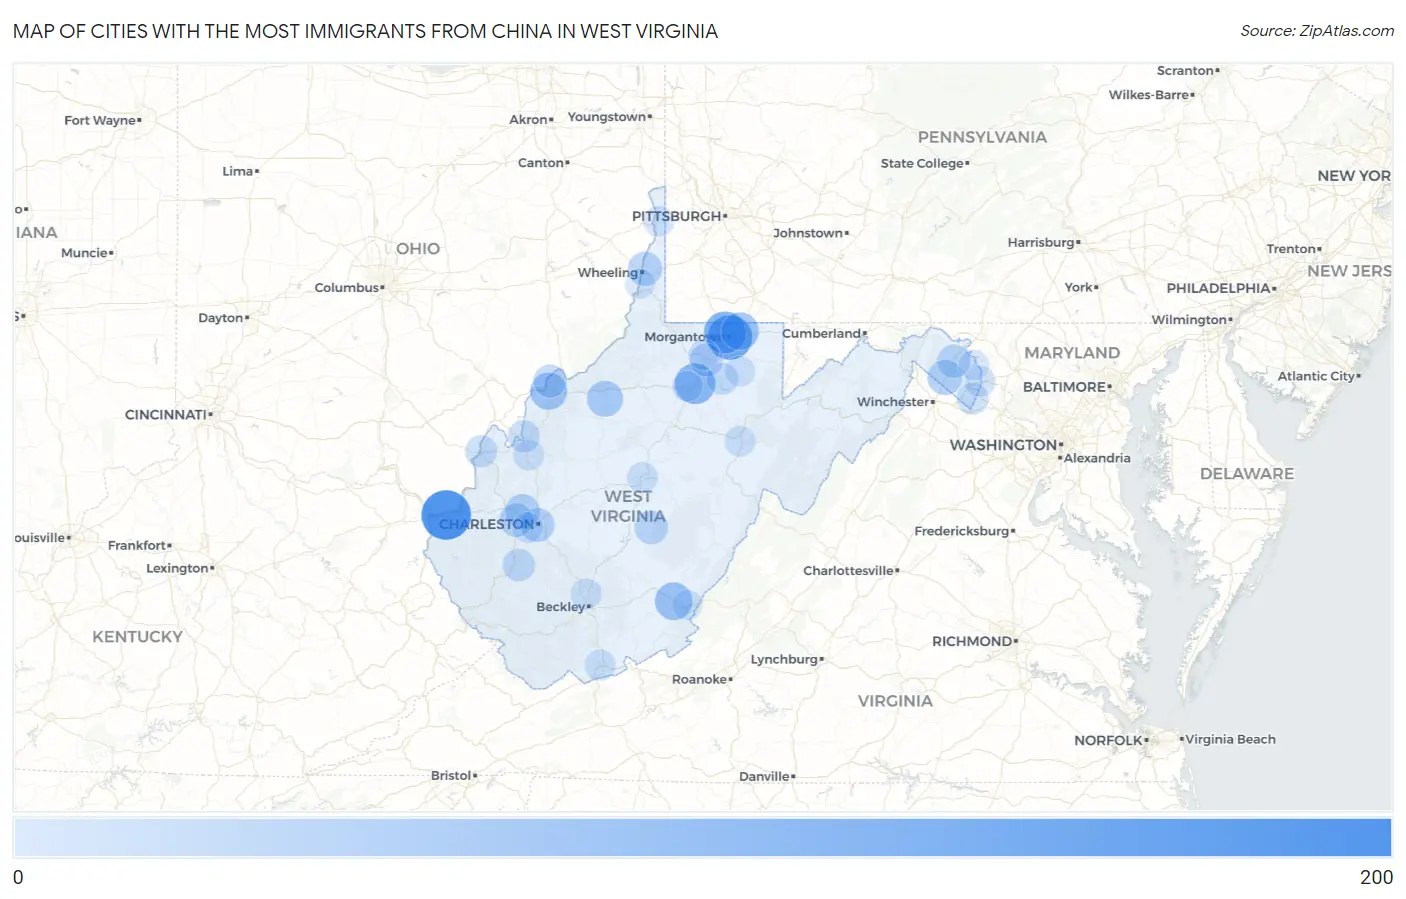
Map of Cities with the Most Immigrants from China in West Virginia
0
200
Cities with the Most Immigrants from China in West Virginia
| City | China | vs State | vs National | |
| 1. | Huntington | 172 | 1,927(8.93%)#1 | 2,829,008(0.01%)#1,422 |
| 2. | Morgantown | 127 | 1,927(6.59%)#2 | 2,829,008(0.00%)#1,741 |
| 3. | Star City | 104 | 1,927(5.40%)#3 | 2,829,008(0.00%)#1,974 |
| 4. | Bridgeport | 93 | 1,927(4.83%)#4 | 2,829,008(0.00%)#2,111 |
| 5. | Lewisburg | 65 | 1,927(3.37%)#5 | 2,829,008(0.00%)#2,582 |
| 6. | Cheat Lake | 64 | 1,927(3.32%)#6 | 2,829,008(0.00%)#2,596 |
| 7. | Parkersburg | 59 | 1,927(3.06%)#7 | 2,829,008(0.00%)#2,704 |
| 8. | Harrisville | 50 | 1,927(2.59%)#8 | 2,829,008(0.00%)#2,955 |
| 9. | Inwood | 41 | 1,927(2.13%)#9 | 2,829,008(0.00%)#3,251 |
| 10. | Cross Lanes | 37 | 1,927(1.92%)#10 | 2,829,008(0.00%)#3,387 |
| 11. | Charleston | 34 | 1,927(1.76%)#11 | 2,829,008(0.00%)#3,507 |
| 12. | Wheeling | 34 | 1,927(1.76%)#12 | 2,829,008(0.00%)#3,513 |
| 13. | St Albans | 32 | 1,927(1.66%)#13 | 2,829,008(0.00%)#3,621 |
| 14. | Craigsville | 29 | 1,927(1.50%)#14 | 2,829,008(0.00%)#3,793 |
| 15. | Martinsburg | 28 | 1,927(1.45%)#15 | 2,829,008(0.00%)#3,807 |
| 16. | Fairmont | 25 | 1,927(1.30%)#16 | 2,829,008(0.00%)#3,981 |
| 17. | Vienna | 25 | 1,927(1.30%)#17 | 2,829,008(0.00%)#3,989 |
| 18. | Madison | 20 | 1,927(1.04%)#18 | 2,829,008(0.00%)#4,321 |
| 19. | Ravenswood | 17 | 1,927(0.88%)#19 | 2,829,008(0.00%)#4,555 |
| 20. | Point Pleasant | 16 | 1,927(0.83%)#20 | 2,829,008(0.00%)#4,642 |
| 21. | Grafton | 13 | 1,927(0.67%)#21 | 2,829,008(0.00%)#4,907 |
| 22. | Shannondale | 13 | 1,927(0.67%)#22 | 2,829,008(0.00%)#4,925 |
| 23. | Princeton | 8 | 1,927(0.42%)#23 | 2,829,008(0.00%)#5,448 |
| 24. | Ripley | 7 | 1,927(0.36%)#24 | 2,829,008(0.00%)#5,600 |
| 25. | Bradley | 7 | 1,927(0.36%)#25 | 2,829,008(0.00%)#5,627 |
| 26. | Elkins | 6 | 1,927(0.31%)#26 | 2,829,008(0.00%)#5,697 |
| 27. | Bolivar | 6 | 1,927(0.31%)#27 | 2,829,008(0.00%)#5,782 |
| 28. | Sutton | 6 | 1,927(0.31%)#28 | 2,829,008(0.00%)#5,798 |
| 29. | Weirton | 4 | 1,927(0.21%)#29 | 2,829,008(0.00%)#5,986 |
| 30. | Clarksburg | 4 | 1,927(0.21%)#30 | 2,829,008(0.00%)#5,989 |
| 31. | South Charleston | 4 | 1,927(0.21%)#31 | 2,829,008(0.00%)#5,991 |
| 32. | Barrackville | 4 | 1,927(0.21%)#32 | 2,829,008(0.00%)#6,048 |
| 33. | Shepherdstown | 3 | 1,927(0.16%)#33 | 2,829,008(0.00%)#6,179 |
| 34. | Newburg | 3 | 1,927(0.16%)#34 | 2,829,008(0.00%)#6,255 |
| 35. | White Sulphur Springs | 1 | 1,927(0.05%)#35 | 2,829,008(0.00%)#6,485 |
| 36. | Mcmechen | 1 | 1,927(0.05%)#36 | 2,829,008(0.00%)#6,501 |
1
2Common Questions
What are the Top 10 Cities with the Most Immigrants from China in West Virginia?
Top 10 Cities with the Most Immigrants from China in West Virginia are:
#1
172
#2
127
#3
104
#4
93
#5
65
#6
64
#7
59
#8
50
#9
41
#10
37
What city has the Most Immigrants from China in West Virginia?
Huntington has the Most Immigrants from China in West Virginia with 172.
What is the Total Immigrants from China in the State of West Virginia?
Total Immigrants from China in West Virginia is 1,927.
What is the Total Immigrants from China in the United States?
Total Immigrants from China in the United States is 2,829,008.