Cities with the Most Immigrants from China in Oregon
RELATED REPORTS & OPTIONS
China
Oregon
Compare Cities
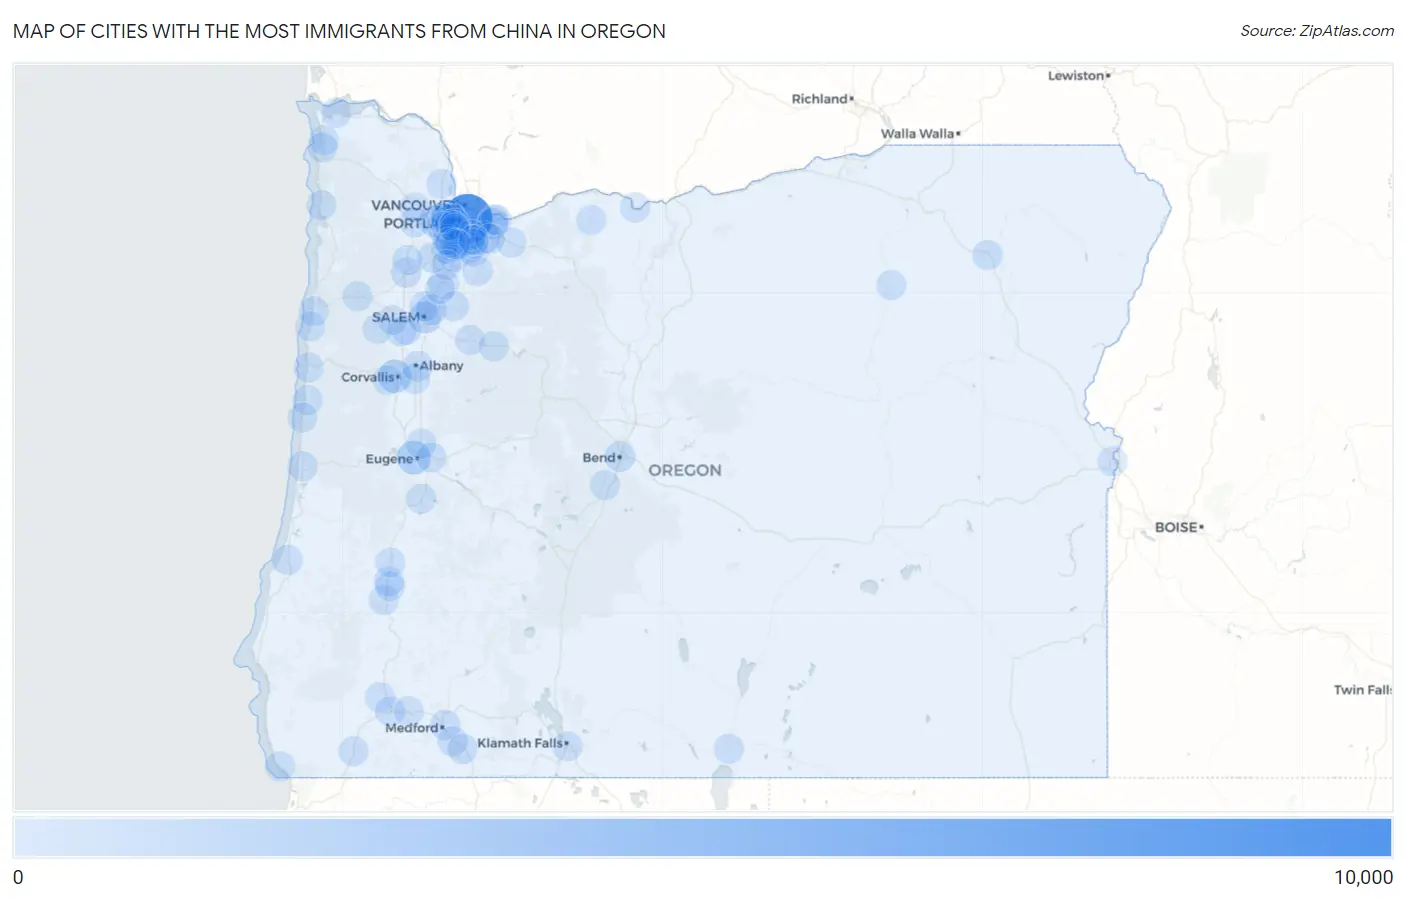
Map of Cities with the Most Immigrants from China in Oregon
0
10,000
Cities with the Most Immigrants from China in Oregon
| City | China | vs State | vs National | |
| 1. | Portland | 9,006 | 27,415(32.85%)#1 | 2,829,008(0.32%)#38 |
| 2. | Eugene | 1,612 | 27,415(5.88%)#2 | 2,829,008(0.06%)#210 |
| 3. | Corvallis | 1,465 | 27,415(5.34%)#3 | 2,829,008(0.05%)#235 |
| 4. | Bethany | 1,328 | 27,415(4.84%)#4 | 2,829,008(0.05%)#267 |
| 5. | Beaverton | 941 | 27,415(3.43%)#5 | 2,829,008(0.03%)#367 |
| 6. | Lake Oswego | 903 | 27,415(3.29%)#6 | 2,829,008(0.03%)#383 |
| 7. | Salem | 897 | 27,415(3.27%)#7 | 2,829,008(0.03%)#386 |
| 8. | Happy Valley | 859 | 27,415(3.13%)#8 | 2,829,008(0.03%)#398 |
| 9. | Cedar Mill | 810 | 27,415(2.95%)#9 | 2,829,008(0.03%)#417 |
| 10. | Hillsboro | 801 | 27,415(2.92%)#10 | 2,829,008(0.03%)#421 |
| 11. | Tigard | 553 | 27,415(2.02%)#11 | 2,829,008(0.02%)#578 |
| 12. | West Linn | 486 | 27,415(1.77%)#12 | 2,829,008(0.02%)#643 |
| 13. | Aloha | 423 | 27,415(1.54%)#13 | 2,829,008(0.01%)#708 |
| 14. | Gresham | 418 | 27,415(1.52%)#14 | 2,829,008(0.01%)#716 |
| 15. | Hayesville | 332 | 27,415(1.21%)#15 | 2,829,008(0.01%)#855 |
| 16. | Albany | 271 | 27,415(0.99%)#16 | 2,829,008(0.01%)#997 |
| 17. | Bend | 268 | 27,415(0.98%)#17 | 2,829,008(0.01%)#1,010 |
| 18. | Wilsonville | 198 | 27,415(0.72%)#18 | 2,829,008(0.01%)#1,294 |
| 19. | Keizer | 186 | 27,415(0.68%)#19 | 2,829,008(0.01%)#1,347 |
| 20. | Woodburn | 182 | 27,415(0.66%)#20 | 2,829,008(0.01%)#1,368 |
| 21. | Tualatin | 178 | 27,415(0.65%)#21 | 2,829,008(0.01%)#1,383 |
| 22. | Mcminnville | 175 | 27,415(0.64%)#22 | 2,829,008(0.01%)#1,404 |
| 23. | North Bend | 157 | 27,415(0.57%)#23 | 2,829,008(0.01%)#1,519 |
| 24. | Oak Hills | 156 | 27,415(0.57%)#24 | 2,829,008(0.01%)#1,527 |
| 25. | Medford | 140 | 27,415(0.51%)#25 | 2,829,008(0.00%)#1,630 |
| 26. | Oregon City | 138 | 27,415(0.50%)#26 | 2,829,008(0.00%)#1,648 |
| 27. | Newberg | 111 | 27,415(0.40%)#27 | 2,829,008(0.00%)#1,886 |
| 28. | Talent | 94 | 27,415(0.34%)#28 | 2,829,008(0.00%)#2,105 |
| 29. | Ashland | 89 | 27,415(0.32%)#29 | 2,829,008(0.00%)#2,161 |
| 30. | Silverton | 85 | 27,415(0.31%)#30 | 2,829,008(0.00%)#2,228 |
| 31. | Garden Home Whitford | 83 | 27,415(0.30%)#31 | 2,829,008(0.00%)#2,257 |
| 32. | Sherwood | 81 | 27,415(0.30%)#32 | 2,829,008(0.00%)#2,278 |
| 33. | La Grande | 81 | 27,415(0.30%)#33 | 2,829,008(0.00%)#2,282 |
| 34. | Bull Mountain | 81 | 27,415(0.30%)#34 | 2,829,008(0.00%)#2,286 |
| 35. | Troutdale | 79 | 27,415(0.29%)#35 | 2,829,008(0.00%)#2,316 |
| 36. | Cedar Hills | 79 | 27,415(0.29%)#36 | 2,829,008(0.00%)#2,325 |
| 37. | Marlene | 77 | 27,415(0.28%)#37 | 2,829,008(0.00%)#2,355 |
| 38. | Rockcreek | 74 | 27,415(0.27%)#38 | 2,829,008(0.00%)#2,403 |
| 39. | Forest Grove | 63 | 27,415(0.23%)#39 | 2,829,008(0.00%)#2,615 |
| 40. | Brookings | 60 | 27,415(0.22%)#40 | 2,829,008(0.00%)#2,694 |
| 41. | Newport | 47 | 27,415(0.17%)#41 | 2,829,008(0.00%)#3,050 |
| 42. | Wood Village | 46 | 27,415(0.17%)#42 | 2,829,008(0.00%)#3,088 |
| 43. | Florence | 44 | 27,415(0.16%)#43 | 2,829,008(0.00%)#3,145 |
| 44. | Coburg | 41 | 27,415(0.15%)#44 | 2,829,008(0.00%)#3,258 |
| 45. | Klamath Falls | 40 | 27,415(0.15%)#45 | 2,829,008(0.00%)#3,266 |
| 46. | Oak Grove | 40 | 27,415(0.15%)#46 | 2,829,008(0.00%)#3,271 |
| 47. | Gladstone | 36 | 27,415(0.13%)#47 | 2,829,008(0.00%)#3,432 |
| 48. | Philomath | 34 | 27,415(0.12%)#48 | 2,829,008(0.00%)#3,536 |
| 49. | Cottage Grove | 33 | 27,415(0.12%)#49 | 2,829,008(0.00%)#3,570 |
| 50. | Sandy | 31 | 27,415(0.11%)#50 | 2,829,008(0.00%)#3,667 |
| 51. | Milwaukie | 30 | 27,415(0.11%)#51 | 2,829,008(0.00%)#3,703 |
| 52. | Santa Clara | 30 | 27,415(0.11%)#52 | 2,829,008(0.00%)#3,712 |
| 53. | West Haven Sylvan | 29 | 27,415(0.11%)#53 | 2,829,008(0.00%)#3,770 |
| 54. | Merlin | 28 | 27,415(0.10%)#54 | 2,829,008(0.00%)#3,852 |
| 55. | Sunriver | 27 | 27,415(0.10%)#55 | 2,829,008(0.00%)#3,909 |
| 56. | Springfield | 24 | 27,415(0.09%)#56 | 2,829,008(0.00%)#4,026 |
| 57. | Mount Hood | 24 | 27,415(0.09%)#57 | 2,829,008(0.00%)#4,067 |
| 58. | Gearhart | 24 | 27,415(0.09%)#58 | 2,829,008(0.00%)#4,080 |
| 59. | The Dalles | 23 | 27,415(0.08%)#59 | 2,829,008(0.00%)#4,103 |
| 60. | Monmouth | 23 | 27,415(0.08%)#60 | 2,829,008(0.00%)#4,111 |
| 61. | Lincoln City | 23 | 27,415(0.08%)#61 | 2,829,008(0.00%)#4,113 |
| 62. | West Slope | 23 | 27,415(0.08%)#62 | 2,829,008(0.00%)#4,122 |
| 63. | Cave Junction | 23 | 27,415(0.08%)#63 | 2,829,008(0.00%)#4,149 |
| 64. | Damascus | 22 | 27,415(0.08%)#64 | 2,829,008(0.00%)#4,171 |
| 65. | Mulino | 21 | 27,415(0.08%)#65 | 2,829,008(0.00%)#4,254 |
| 66. | Scappoose | 20 | 27,415(0.07%)#66 | 2,829,008(0.00%)#4,294 |
| 67. | Raleigh Hills | 20 | 27,415(0.07%)#67 | 2,829,008(0.00%)#4,301 |
| 68. | Green | 19 | 27,415(0.07%)#68 | 2,829,008(0.00%)#4,376 |
| 69. | Seaside | 19 | 27,415(0.07%)#69 | 2,829,008(0.00%)#4,379 |
| 70. | Falcon Heights | 19 | 27,415(0.07%)#70 | 2,829,008(0.00%)#4,420 |
| 71. | Roseburg North | 18 | 27,415(0.07%)#71 | 2,829,008(0.00%)#4,470 |
| 72. | Rivergrove | 17 | 27,415(0.06%)#72 | 2,829,008(0.00%)#4,582 |
| 73. | Roseburg | 16 | 27,415(0.06%)#73 | 2,829,008(0.00%)#4,593 |
| 74. | Independence | 16 | 27,415(0.06%)#74 | 2,829,008(0.00%)#4,613 |
| 75. | King City | 16 | 27,415(0.06%)#75 | 2,829,008(0.00%)#4,634 |
| 76. | River Road | 15 | 27,415(0.05%)#76 | 2,829,008(0.00%)#4,704 |
| 77. | Durham | 15 | 27,415(0.05%)#77 | 2,829,008(0.00%)#4,748 |
| 78. | Lincoln Beach | 14 | 27,415(0.05%)#78 | 2,829,008(0.00%)#4,832 |
| 79. | Grants Pass | 13 | 27,415(0.05%)#79 | 2,829,008(0.00%)#4,864 |
| 80. | Banks | 13 | 27,415(0.05%)#80 | 2,829,008(0.00%)#4,941 |
| 81. | Carlton | 12 | 27,415(0.04%)#81 | 2,829,008(0.00%)#5,038 |
| 82. | Rogue River | 11 | 27,415(0.04%)#82 | 2,829,008(0.00%)#5,145 |
| 83. | Dallas | 10 | 27,415(0.04%)#83 | 2,829,008(0.00%)#5,179 |
| 84. | Ontario | 10 | 27,415(0.04%)#84 | 2,829,008(0.00%)#5,189 |
| 85. | Waldport | 10 | 27,415(0.04%)#85 | 2,829,008(0.00%)#5,259 |
| 86. | Yachats | 10 | 27,415(0.04%)#86 | 2,829,008(0.00%)#5,282 |
| 87. | Gervais | 9 | 27,415(0.03%)#87 | 2,829,008(0.00%)#5,360 |
| 88. | Ukiah | 9 | 27,415(0.03%)#88 | 2,829,008(0.00%)#5,410 |
| 89. | Lakeview | 8 | 27,415(0.03%)#89 | 2,829,008(0.00%)#5,472 |
| 90. | Dunthorpe | 8 | 27,415(0.03%)#90 | 2,829,008(0.00%)#5,503 |
| 91. | Grand Ronde | 8 | 27,415(0.03%)#91 | 2,829,008(0.00%)#5,512 |
| 92. | Mehama | 8 | 27,415(0.03%)#92 | 2,829,008(0.00%)#5,530 |
| 93. | Oatfield | 6 | 27,415(0.02%)#93 | 2,829,008(0.00%)#5,679 |
| 94. | Butteville | 6 | 27,415(0.02%)#94 | 2,829,008(0.00%)#5,822 |
| 95. | Sutherlin | 5 | 27,415(0.02%)#95 | 2,829,008(0.00%)#5,856 |
| 96. | Gates | 4 | 27,415(0.01%)#96 | 2,829,008(0.00%)#6,098 |
| 97. | Rockaway Beach | 3 | 27,415(0.01%)#97 | 2,829,008(0.00%)#6,187 |
| 98. | Tangent | 3 | 27,415(0.01%)#98 | 2,829,008(0.00%)#6,192 |
| 99. | Astoria | 2 | 27,415(0.01%)#99 | 2,829,008(0.00%)#6,282 |
| 100. | Falls City | 2 | 27,415(0.01%)#100 | 2,829,008(0.00%)#6,324 |
Common Questions
What are the Top 10 Cities with the Most Immigrants from China in Oregon?
Top 10 Cities with the Most Immigrants from China in Oregon are:
#1
9,006
#2
1,612
#3
1,465
#4
1,328
#5
941
#6
903
#7
897
#8
859
#9
810
#10
801
What city has the Most Immigrants from China in Oregon?
Portland has the Most Immigrants from China in Oregon with 9,006.
What is the Total Immigrants from China in the State of Oregon?
Total Immigrants from China in Oregon is 27,415.
What is the Total Immigrants from China in the United States?
Total Immigrants from China in the United States is 2,829,008.