Cities with the Most Immigrants from China in Minnesota
RELATED REPORTS & OPTIONS
China
Minnesota
Compare Cities
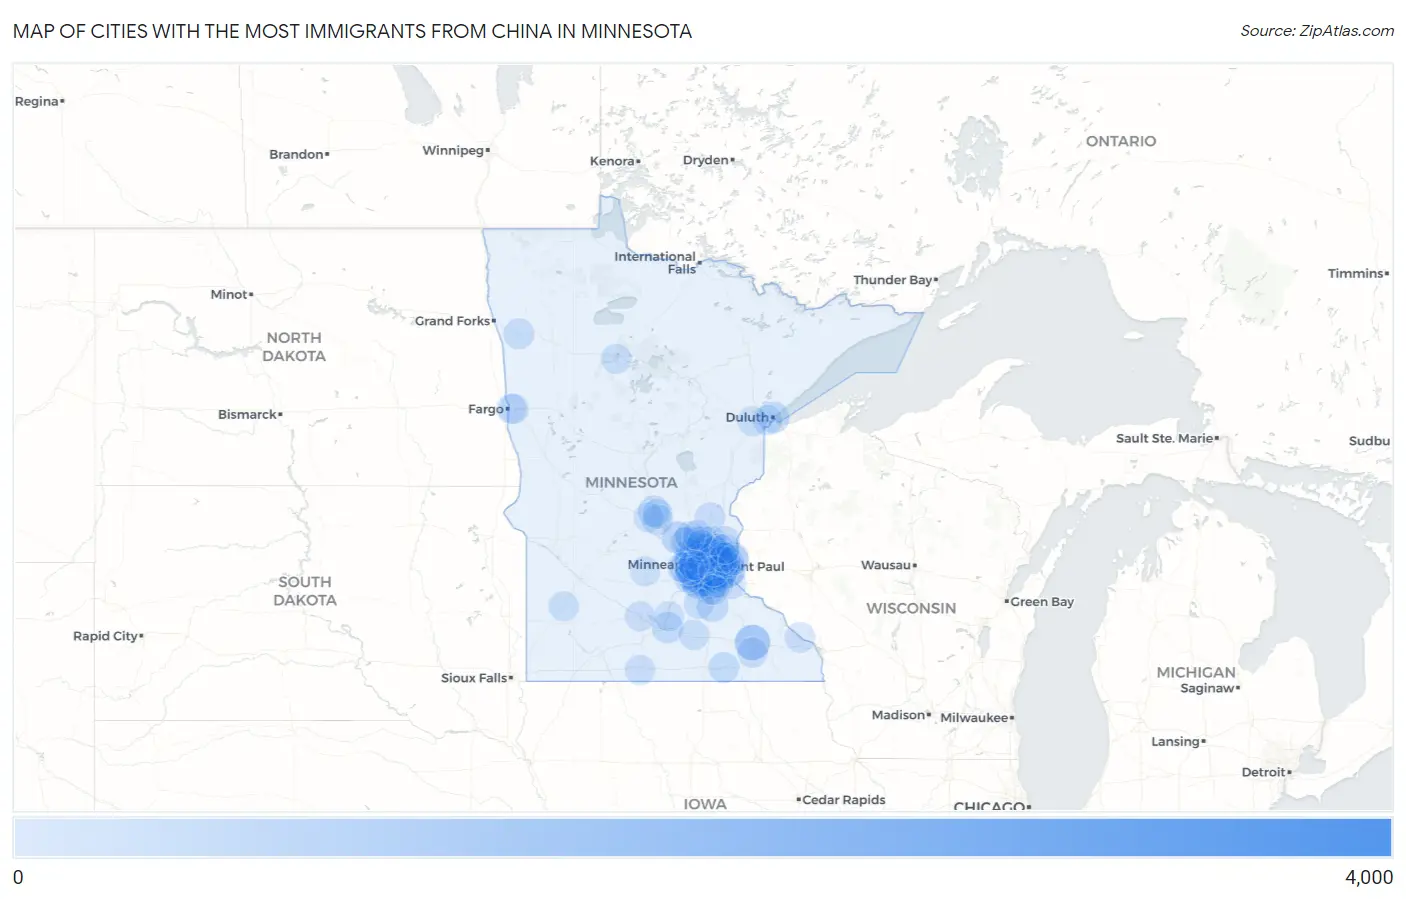
Map of Cities with the Most Immigrants from China in Minnesota
0
4,000
Cities with the Most Immigrants from China in Minnesota
| City | China | vs State | vs National | |
| 1. | Minneapolis | 3,179 | 20,595(15.44%)#1 | 2,829,008(0.11%)#111 |
| 2. | St Paul | 1,786 | 20,595(8.67%)#2 | 2,829,008(0.06%)#193 |
| 3. | Eden Prairie | 946 | 20,595(4.59%)#3 | 2,829,008(0.03%)#363 |
| 4. | Woodbury | 833 | 20,595(4.04%)#4 | 2,829,008(0.03%)#409 |
| 5. | Rochester | 823 | 20,595(4.00%)#5 | 2,829,008(0.03%)#412 |
| 6. | Plymouth | 738 | 20,595(3.58%)#6 | 2,829,008(0.03%)#458 |
| 7. | Edina | 701 | 20,595(3.40%)#7 | 2,829,008(0.02%)#482 |
| 8. | Shoreview | 580 | 20,595(2.82%)#8 | 2,829,008(0.02%)#558 |
| 9. | Bloomington | 471 | 20,595(2.29%)#9 | 2,829,008(0.02%)#664 |
| 10. | Minnetonka | 458 | 20,595(2.22%)#10 | 2,829,008(0.02%)#675 |
| 11. | Maple Grove | 454 | 20,595(2.20%)#11 | 2,829,008(0.02%)#679 |
| 12. | St Louis Park | 369 | 20,595(1.79%)#12 | 2,829,008(0.01%)#791 |
| 13. | Blaine | 368 | 20,595(1.79%)#13 | 2,829,008(0.01%)#793 |
| 14. | Monticello | 330 | 20,595(1.60%)#14 | 2,829,008(0.01%)#861 |
| 15. | Eagan | 313 | 20,595(1.52%)#15 | 2,829,008(0.01%)#895 |
| 16. | Apple Valley | 294 | 20,595(1.43%)#16 | 2,829,008(0.01%)#935 |
| 17. | Orono | 272 | 20,595(1.32%)#17 | 2,829,008(0.01%)#993 |
| 18. | Duluth | 234 | 20,595(1.14%)#18 | 2,829,008(0.01%)#1,127 |
| 19. | Roseville | 226 | 20,595(1.10%)#19 | 2,829,008(0.01%)#1,166 |
| 20. | Shakopee | 214 | 20,595(1.04%)#20 | 2,829,008(0.01%)#1,217 |
| 21. | Stillwater | 212 | 20,595(1.03%)#21 | 2,829,008(0.01%)#1,225 |
| 22. | Burnsville | 206 | 20,595(1.00%)#22 | 2,829,008(0.01%)#1,244 |
| 23. | Mankato | 206 | 20,595(1.00%)#23 | 2,829,008(0.01%)#1,245 |
| 24. | Falcon Heights | 200 | 20,595(0.97%)#24 | 2,829,008(0.01%)#1,283 |
| 25. | Northfield | 199 | 20,595(0.97%)#25 | 2,829,008(0.01%)#1,286 |
| 26. | Lakeville | 198 | 20,595(0.96%)#26 | 2,829,008(0.01%)#1,289 |
| 27. | Richfield | 187 | 20,595(0.91%)#27 | 2,829,008(0.01%)#1,341 |
| 28. | Sartell | 187 | 20,595(0.91%)#28 | 2,829,008(0.01%)#1,343 |
| 29. | Maplewood | 186 | 20,595(0.90%)#29 | 2,829,008(0.01%)#1,346 |
| 30. | Brooklyn Park | 180 | 20,595(0.87%)#30 | 2,829,008(0.01%)#1,376 |
| 31. | Arden Hills | 163 | 20,595(0.79%)#31 | 2,829,008(0.01%)#1,477 |
| 32. | New Brighton | 161 | 20,595(0.78%)#32 | 2,829,008(0.01%)#1,493 |
| 33. | Medina | 150 | 20,595(0.73%)#33 | 2,829,008(0.01%)#1,571 |
| 34. | Lauderdale | 149 | 20,595(0.72%)#34 | 2,829,008(0.01%)#1,577 |
| 35. | Austin | 139 | 20,595(0.67%)#35 | 2,829,008(0.00%)#1,639 |
| 36. | Columbia Heights | 127 | 20,595(0.62%)#36 | 2,829,008(0.00%)#1,742 |
| 37. | St Anthony City Hennepin And Ramsey Counties | 126 | 20,595(0.61%)#37 | 2,829,008(0.00%)#1,755 |
| 38. | Crookston | 126 | 20,595(0.61%)#38 | 2,829,008(0.00%)#1,759 |
| 39. | Savage | 125 | 20,595(0.61%)#39 | 2,829,008(0.00%)#1,764 |
| 40. | St Cloud | 111 | 20,595(0.54%)#40 | 2,829,008(0.00%)#1,882 |
| 41. | Chanhassen | 110 | 20,595(0.53%)#41 | 2,829,008(0.00%)#1,891 |
| 42. | North Oaks | 99 | 20,595(0.48%)#42 | 2,829,008(0.00%)#2,035 |
| 43. | Mound | 96 | 20,595(0.47%)#43 | 2,829,008(0.00%)#2,080 |
| 44. | Inver Grove Heights | 85 | 20,595(0.41%)#44 | 2,829,008(0.00%)#2,223 |
| 45. | Champlin | 84 | 20,595(0.41%)#45 | 2,829,008(0.00%)#2,235 |
| 46. | Otsego | 81 | 20,595(0.39%)#46 | 2,829,008(0.00%)#2,277 |
| 47. | Oakdale | 80 | 20,595(0.39%)#47 | 2,829,008(0.00%)#2,297 |
| 48. | Lake Elmo | 79 | 20,595(0.38%)#48 | 2,829,008(0.00%)#2,321 |
| 49. | Prior Lake | 78 | 20,595(0.38%)#49 | 2,829,008(0.00%)#2,333 |
| 50. | Winona | 74 | 20,595(0.36%)#50 | 2,829,008(0.00%)#2,396 |
| 51. | Robbinsdale | 74 | 20,595(0.36%)#51 | 2,829,008(0.00%)#2,399 |
| 52. | Golden Valley | 72 | 20,595(0.35%)#52 | 2,829,008(0.00%)#2,441 |
| 53. | Brooklyn Center | 71 | 20,595(0.34%)#53 | 2,829,008(0.00%)#2,455 |
| 54. | Fridley | 63 | 20,595(0.31%)#54 | 2,829,008(0.00%)#2,612 |
| 55. | Hastings | 62 | 20,595(0.30%)#55 | 2,829,008(0.00%)#2,632 |
| 56. | Mounds View | 60 | 20,595(0.29%)#56 | 2,829,008(0.00%)#2,688 |
| 57. | Waseca | 59 | 20,595(0.29%)#57 | 2,829,008(0.00%)#2,714 |
| 58. | Little Canada | 58 | 20,595(0.28%)#58 | 2,829,008(0.00%)#2,743 |
| 59. | Rosemount | 54 | 20,595(0.26%)#59 | 2,829,008(0.00%)#2,817 |
| 60. | Cambridge | 54 | 20,595(0.26%)#60 | 2,829,008(0.00%)#2,821 |
| 61. | Corcoran | 54 | 20,595(0.26%)#61 | 2,829,008(0.00%)#2,828 |
| 62. | Andover | 50 | 20,595(0.24%)#62 | 2,829,008(0.00%)#2,928 |
| 63. | Ham Lake | 49 | 20,595(0.24%)#63 | 2,829,008(0.00%)#2,970 |
| 64. | Forest Lake | 48 | 20,595(0.23%)#64 | 2,829,008(0.00%)#3,008 |
| 65. | Bemidji | 48 | 20,595(0.23%)#65 | 2,829,008(0.00%)#3,009 |
| 66. | Circle Pines | 48 | 20,595(0.23%)#66 | 2,829,008(0.00%)#3,025 |
| 67. | Lino Lakes | 45 | 20,595(0.22%)#67 | 2,829,008(0.00%)#3,100 |
| 68. | St. John's University | 45 | 20,595(0.22%)#68 | 2,829,008(0.00%)#3,124 |
| 69. | Coon Rapids | 43 | 20,595(0.21%)#69 | 2,829,008(0.00%)#3,156 |
| 70. | North St Paul | 43 | 20,595(0.21%)#70 | 2,829,008(0.00%)#3,170 |
| 71. | White Bear Lake | 41 | 20,595(0.20%)#71 | 2,829,008(0.00%)#3,229 |
| 72. | Lonsdale | 40 | 20,595(0.19%)#72 | 2,829,008(0.00%)#3,285 |
| 73. | Chaska | 39 | 20,595(0.19%)#73 | 2,829,008(0.00%)#3,297 |
| 74. | Ramsey | 38 | 20,595(0.18%)#74 | 2,829,008(0.00%)#3,333 |
| 75. | Crystal | 38 | 20,595(0.18%)#75 | 2,829,008(0.00%)#3,339 |
| 76. | Minnetrista | 37 | 20,595(0.18%)#76 | 2,829,008(0.00%)#3,391 |
| 77. | Marshall | 35 | 20,595(0.17%)#77 | 2,829,008(0.00%)#3,478 |
| 78. | Stewartville | 35 | 20,595(0.17%)#78 | 2,829,008(0.00%)#3,487 |
| 79. | Hopkins | 34 | 20,595(0.17%)#79 | 2,829,008(0.00%)#3,519 |
| 80. | Farmington | 32 | 20,595(0.16%)#80 | 2,829,008(0.00%)#3,608 |
| 81. | Fairmont | 31 | 20,595(0.15%)#81 | 2,829,008(0.00%)#3,668 |
| 82. | Shorewood | 31 | 20,595(0.15%)#82 | 2,829,008(0.00%)#3,676 |
| 83. | Proctor | 30 | 20,595(0.15%)#83 | 2,829,008(0.00%)#3,732 |
| 84. | Mahtomedi | 29 | 20,595(0.14%)#84 | 2,829,008(0.00%)#3,771 |
| 85. | Albertville | 29 | 20,595(0.14%)#85 | 2,829,008(0.00%)#3,774 |
| 86. | New Ulm | 28 | 20,595(0.14%)#86 | 2,829,008(0.00%)#3,814 |
| 87. | Anoka | 27 | 20,595(0.13%)#87 | 2,829,008(0.00%)#3,870 |
| 88. | Mendota Heights | 26 | 20,595(0.13%)#88 | 2,829,008(0.00%)#3,938 |
| 89. | St Joseph | 26 | 20,595(0.13%)#89 | 2,829,008(0.00%)#3,950 |
| 90. | St Peter | 24 | 20,595(0.12%)#90 | 2,829,008(0.00%)#4,041 |
| 91. | Wayzata | 24 | 20,595(0.12%)#91 | 2,829,008(0.00%)#4,068 |
| 92. | Hutchinson | 23 | 20,595(0.11%)#92 | 2,829,008(0.00%)#4,104 |
| 93. | Sauk Rapids | 23 | 20,595(0.11%)#93 | 2,829,008(0.00%)#4,105 |
| 94. | Cloquet | 22 | 20,595(0.11%)#94 | 2,829,008(0.00%)#4,169 |
| 95. | Oak Park Heights | 21 | 20,595(0.10%)#95 | 2,829,008(0.00%)#4,241 |
| 96. | Hugo | 20 | 20,595(0.10%)#96 | 2,829,008(0.00%)#4,277 |
| 97. | Moorhead | 19 | 20,595(0.09%)#97 | 2,829,008(0.00%)#4,341 |
| 98. | Elk River | 17 | 20,595(0.08%)#98 | 2,829,008(0.00%)#4,505 |
| 99. | Dilworth | 17 | 20,595(0.08%)#99 | 2,829,008(0.00%)#4,545 |
| 100. | Nowthen | 17 | 20,595(0.08%)#100 | 2,829,008(0.00%)#4,546 |
Common Questions
What are the Top 10 Cities with the Most Immigrants from China in Minnesota?
Top 10 Cities with the Most Immigrants from China in Minnesota are:
#1
3,179
#2
1,786
#3
946
#4
833
#5
823
#6
738
#7
701
#8
580
#9
471
#10
458
What city has the Most Immigrants from China in Minnesota?
Minneapolis has the Most Immigrants from China in Minnesota with 3,179.
What is the Total Immigrants from China in the State of Minnesota?
Total Immigrants from China in Minnesota is 20,595.
What is the Total Immigrants from China in the United States?
Total Immigrants from China in the United States is 2,829,008.