Cities with the Most Immigrants from China in Utah
RELATED REPORTS & OPTIONS
China
Utah
Compare Cities
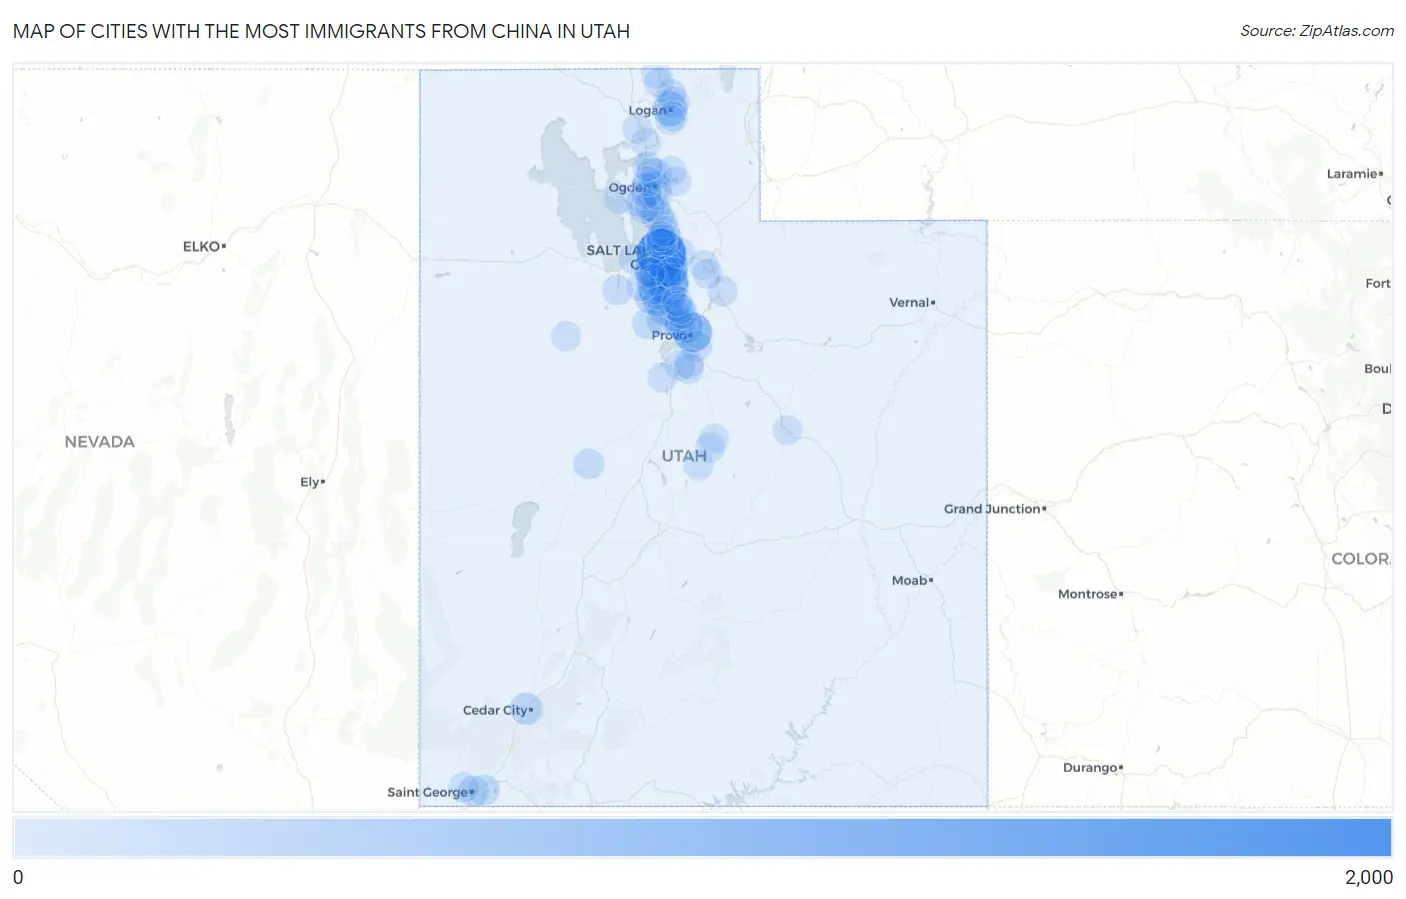
Map of Cities with the Most Immigrants from China in Utah
0
2,000
Cities with the Most Immigrants from China in Utah
| City | China | vs State | vs National | |
| 1. | Salt Lake City | 1,644 | 10,179(16.15%)#1 | 2,829,008(0.06%)#206 |
| 2. | Sandy | 764 | 10,179(7.51%)#2 | 2,829,008(0.03%)#440 |
| 3. | Provo | 748 | 10,179(7.35%)#3 | 2,829,008(0.03%)#451 |
| 4. | Millcreek | 651 | 10,179(6.40%)#4 | 2,829,008(0.02%)#510 |
| 5. | Taylorsville | 506 | 10,179(4.97%)#5 | 2,829,008(0.02%)#629 |
| 6. | Logan | 376 | 10,179(3.69%)#6 | 2,829,008(0.01%)#780 |
| 7. | West Valley City | 343 | 10,179(3.37%)#7 | 2,829,008(0.01%)#832 |
| 8. | Orem | 318 | 10,179(3.12%)#8 | 2,829,008(0.01%)#883 |
| 9. | Draper | 292 | 10,179(2.87%)#9 | 2,829,008(0.01%)#943 |
| 10. | Lehi | 265 | 10,179(2.60%)#10 | 2,829,008(0.01%)#1,023 |
| 11. | South Jordan | 248 | 10,179(2.44%)#11 | 2,829,008(0.01%)#1,071 |
| 12. | South Salt Lake | 239 | 10,179(2.35%)#12 | 2,829,008(0.01%)#1,108 |
| 13. | Murray | 231 | 10,179(2.27%)#13 | 2,829,008(0.01%)#1,142 |
| 14. | Midvale | 228 | 10,179(2.24%)#14 | 2,829,008(0.01%)#1,154 |
| 15. | Herriman | 210 | 10,179(2.06%)#15 | 2,829,008(0.01%)#1,229 |
| 16. | Cottonwood Heights | 199 | 10,179(1.96%)#16 | 2,829,008(0.01%)#1,285 |
| 17. | Ogden | 198 | 10,179(1.95%)#17 | 2,829,008(0.01%)#1,288 |
| 18. | Kaysville | 197 | 10,179(1.94%)#18 | 2,829,008(0.01%)#1,300 |
| 19. | Cedar City | 189 | 10,179(1.86%)#19 | 2,829,008(0.01%)#1,329 |
| 20. | West Haven | 156 | 10,179(1.53%)#20 | 2,829,008(0.01%)#1,526 |
| 21. | Riverton | 153 | 10,179(1.50%)#21 | 2,829,008(0.01%)#1,550 |
| 22. | American Fork | 146 | 10,179(1.43%)#22 | 2,829,008(0.01%)#1,601 |
| 23. | West Jordan | 128 | 10,179(1.26%)#23 | 2,829,008(0.00%)#1,727 |
| 24. | Vineyard | 102 | 10,179(1.00%)#24 | 2,829,008(0.00%)#1,993 |
| 25. | Washington | 99 | 10,179(0.97%)#25 | 2,829,008(0.00%)#2,029 |
| 26. | Springville | 90 | 10,179(0.88%)#26 | 2,829,008(0.00%)#2,144 |
| 27. | North Logan | 87 | 10,179(0.85%)#27 | 2,829,008(0.00%)#2,197 |
| 28. | Delta | 73 | 10,179(0.72%)#28 | 2,829,008(0.00%)#2,429 |
| 29. | Eagle Mountain | 71 | 10,179(0.70%)#29 | 2,829,008(0.00%)#2,454 |
| 30. | Saratoga Springs | 63 | 10,179(0.62%)#30 | 2,829,008(0.00%)#2,609 |
| 31. | Holladay | 60 | 10,179(0.59%)#31 | 2,829,008(0.00%)#2,680 |
| 32. | St George | 59 | 10,179(0.58%)#32 | 2,829,008(0.00%)#2,701 |
| 33. | Highland | 51 | 10,179(0.50%)#33 | 2,829,008(0.00%)#2,898 |
| 34. | Farmington | 48 | 10,179(0.47%)#34 | 2,829,008(0.00%)#3,007 |
| 35. | Bountiful | 45 | 10,179(0.44%)#35 | 2,829,008(0.00%)#3,095 |
| 36. | White | 45 | 10,179(0.44%)#36 | 2,829,008(0.00%)#3,117 |
| 37. | Tooele | 43 | 10,179(0.42%)#37 | 2,829,008(0.00%)#3,158 |
| 38. | North Ogden | 43 | 10,179(0.42%)#38 | 2,829,008(0.00%)#3,162 |
| 39. | Pleasant Grove | 38 | 10,179(0.37%)#39 | 2,829,008(0.00%)#3,331 |
| 40. | Layton | 36 | 10,179(0.35%)#40 | 2,829,008(0.00%)#3,414 |
| 41. | Woods Cross | 34 | 10,179(0.33%)#41 | 2,829,008(0.00%)#3,528 |
| 42. | Payson | 29 | 10,179(0.28%)#42 | 2,829,008(0.00%)#3,753 |
| 43. | Pleasant View | 28 | 10,179(0.28%)#43 | 2,829,008(0.00%)#3,820 |
| 44. | Bluffdale | 27 | 10,179(0.27%)#44 | 2,829,008(0.00%)#3,871 |
| 45. | Heber | 27 | 10,179(0.27%)#45 | 2,829,008(0.00%)#3,872 |
| 46. | West Point | 27 | 10,179(0.27%)#46 | 2,829,008(0.00%)#3,883 |
| 47. | Santa Clara | 27 | 10,179(0.27%)#47 | 2,829,008(0.00%)#3,892 |
| 48. | Magna | 26 | 10,179(0.26%)#48 | 2,829,008(0.00%)#3,920 |
| 49. | Emigration Canyon | 24 | 10,179(0.24%)#49 | 2,829,008(0.00%)#4,086 |
| 50. | Kearns | 20 | 10,179(0.20%)#50 | 2,829,008(0.00%)#4,266 |
| 51. | North Salt Lake | 20 | 10,179(0.20%)#51 | 2,829,008(0.00%)#4,272 |
| 52. | Alpine | 20 | 10,179(0.20%)#52 | 2,829,008(0.00%)#4,288 |
| 53. | Snyderville | 20 | 10,179(0.20%)#53 | 2,829,008(0.00%)#4,303 |
| 54. | Smithfield | 17 | 10,179(0.17%)#54 | 2,829,008(0.00%)#4,513 |
| 55. | Elk Ridge | 16 | 10,179(0.16%)#55 | 2,829,008(0.00%)#4,636 |
| 56. | Centerville | 15 | 10,179(0.15%)#56 | 2,829,008(0.00%)#4,690 |
| 57. | Ephraim | 15 | 10,179(0.15%)#57 | 2,829,008(0.00%)#4,716 |
| 58. | Wolf Creek | 14 | 10,179(0.14%)#58 | 2,829,008(0.00%)#4,848 |
| 59. | Brigham City | 13 | 10,179(0.13%)#59 | 2,829,008(0.00%)#4,871 |
| 60. | Clearfield | 12 | 10,179(0.12%)#60 | 2,829,008(0.00%)#4,968 |
| 61. | Salem | 12 | 10,179(0.12%)#61 | 2,829,008(0.00%)#4,996 |
| 62. | Hooper | 11 | 10,179(0.11%)#62 | 2,829,008(0.00%)#5,089 |
| 63. | Park City | 11 | 10,179(0.11%)#63 | 2,829,008(0.00%)#5,093 |
| 64. | Syracuse | 10 | 10,179(0.10%)#64 | 2,829,008(0.00%)#5,167 |
| 65. | Mount Pleasant | 10 | 10,179(0.10%)#65 | 2,829,008(0.00%)#5,231 |
| 66. | Dugway | 10 | 10,179(0.10%)#66 | 2,829,008(0.00%)#5,289 |
| 67. | Cedar Hills | 9 | 10,179(0.09%)#67 | 2,829,008(0.00%)#5,322 |
| 68. | Nibley | 8 | 10,179(0.08%)#68 | 2,829,008(0.00%)#5,445 |
| 69. | South Ogden | 7 | 10,179(0.07%)#69 | 2,829,008(0.00%)#5,549 |
| 70. | Roy | 4 | 10,179(0.04%)#70 | 2,829,008(0.00%)#5,976 |
| 71. | West Bountiful | 4 | 10,179(0.04%)#71 | 2,829,008(0.00%)#6,005 |
| 72. | Millville | 4 | 10,179(0.04%)#72 | 2,829,008(0.00%)#6,039 |
| 73. | Spring City | 3 | 10,179(0.03%)#73 | 2,829,008(0.00%)#6,203 |
| 74. | Bear River City | 3 | 10,179(0.03%)#74 | 2,829,008(0.00%)#6,223 |
| 75. | Goshen | 2 | 10,179(0.02%)#75 | 2,829,008(0.00%)#6,348 |
| 76. | Huntsville | 2 | 10,179(0.02%)#76 | 2,829,008(0.00%)#6,394 |
| 77. | Cornish | 2 | 10,179(0.02%)#77 | 2,829,008(0.00%)#6,422 |
| 78. | Price | 1 | 10,179(0.01%)#78 | 2,829,008(0.00%)#6,460 |
| 79. | Marriott Slaterville | 1 | 10,179(0.01%)#79 | 2,829,008(0.00%)#6,494 |
| 80. | South Willard | 1 | 10,179(0.01%)#80 | 2,829,008(0.00%)#6,503 |
| 81. | Copperton | 1 | 10,179(0.01%)#81 | 2,829,008(0.00%)#6,521 |
| 82. | Trenton | 1 | 10,179(0.01%)#82 | 2,829,008(0.00%)#6,546 |
Common Questions
What are the Top 10 Cities with the Most Immigrants from China in Utah?
Top 10 Cities with the Most Immigrants from China in Utah are:
#1
1,644
#2
764
#3
748
#4
651
#5
506
#6
376
#7
343
#8
318
#9
292
#10
265
What city has the Most Immigrants from China in Utah?
Salt Lake City has the Most Immigrants from China in Utah with 1,644.
What is the Total Immigrants from China in the State of Utah?
Total Immigrants from China in Utah is 10,179.
What is the Total Immigrants from China in the United States?
Total Immigrants from China in the United States is 2,829,008.