Cities with the Most Immigrants from China in New York
RELATED REPORTS & OPTIONS
China
New York
Compare Cities
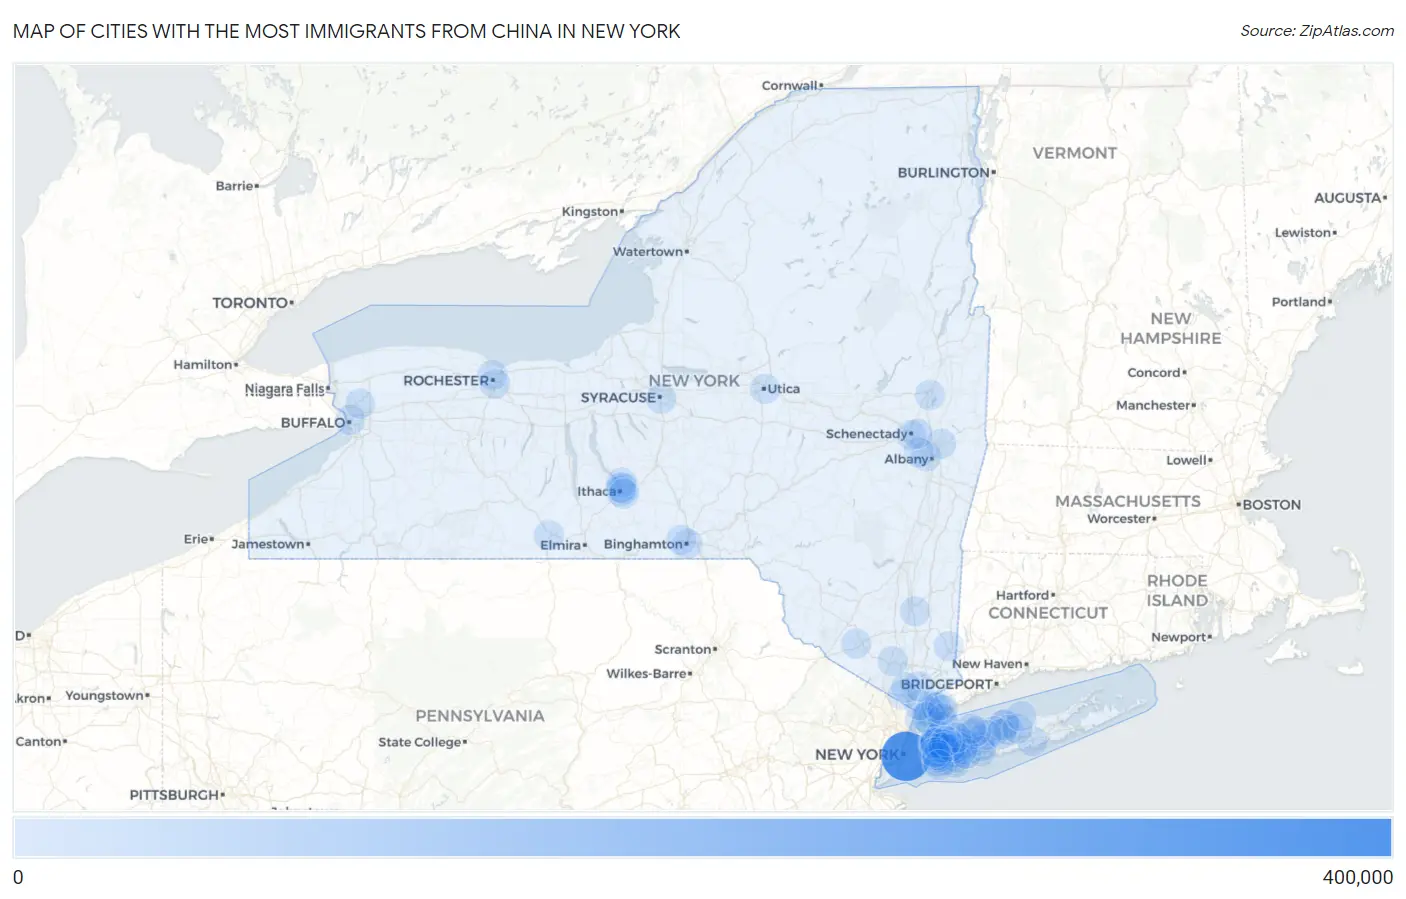
Map of Cities with the Most Immigrants from China in New York
0
400,000
Cities with the Most Immigrants from China in New York
| City | China | vs State | vs National | |
| 1. | New York | 398,944 | 483,749(82.47%)#1 | 2,829,008(14.10%)#1 |
| 2. | Jericho | 2,027 | 483,749(0.42%)#2 | 2,829,008(0.07%)#163 |
| 3. | Syracuse | 2,025 | 483,749(0.42%)#3 | 2,829,008(0.07%)#164 |
| 4. | Rochester | 1,556 | 483,749(0.32%)#4 | 2,829,008(0.06%)#223 |
| 5. | Ithaca | 1,510 | 483,749(0.31%)#5 | 2,829,008(0.05%)#229 |
| 6. | Syosset | 1,442 | 483,749(0.30%)#6 | 2,829,008(0.05%)#241 |
| 7. | Valley Stream | 1,220 | 483,749(0.25%)#7 | 2,829,008(0.04%)#286 |
| 8. | Plainview | 1,127 | 483,749(0.23%)#8 | 2,829,008(0.04%)#308 |
| 9. | Hicksville | 1,049 | 483,749(0.22%)#9 | 2,829,008(0.04%)#337 |
| 10. | White Plains | 1,011 | 483,749(0.21%)#10 | 2,829,008(0.04%)#344 |
| 11. | Scarsdale | 1,003 | 483,749(0.21%)#11 | 2,829,008(0.04%)#345 |
| 12. | Albany | 1,002 | 483,749(0.21%)#12 | 2,829,008(0.04%)#346 |
| 13. | North New Hyde Park | 968 | 483,749(0.20%)#13 | 2,829,008(0.03%)#356 |
| 14. | Stony Brook University | 900 | 483,749(0.19%)#14 | 2,829,008(0.03%)#385 |
| 15. | Levittown | 776 | 483,749(0.16%)#15 | 2,829,008(0.03%)#435 |
| 16. | Yonkers | 764 | 483,749(0.16%)#16 | 2,829,008(0.03%)#439 |
| 17. | Troy | 763 | 483,749(0.16%)#17 | 2,829,008(0.03%)#441 |
| 18. | Brighton | 759 | 483,749(0.16%)#18 | 2,829,008(0.03%)#443 |
| 19. | Mineola | 689 | 483,749(0.14%)#19 | 2,829,008(0.02%)#490 |
| 20. | Buffalo | 681 | 483,749(0.14%)#20 | 2,829,008(0.02%)#495 |
| 21. | Greenville Cdp Westchester County | 648 | 483,749(0.13%)#21 | 2,829,008(0.02%)#512 |
| 22. | Garden City | 647 | 483,749(0.13%)#22 | 2,829,008(0.02%)#513 |
| 23. | Dix Hills | 644 | 483,749(0.13%)#23 | 2,829,008(0.02%)#516 |
| 24. | Deer Park | 643 | 483,749(0.13%)#24 | 2,829,008(0.02%)#517 |
| 25. | University Gardens | 635 | 483,749(0.13%)#25 | 2,829,008(0.02%)#525 |
| 26. | Stony Brook | 622 | 483,749(0.13%)#26 | 2,829,008(0.02%)#535 |
| 27. | Floral Park | 607 | 483,749(0.13%)#27 | 2,829,008(0.02%)#543 |
| 28. | Garden City Park | 599 | 483,749(0.12%)#28 | 2,829,008(0.02%)#548 |
| 29. | Binghamton | 583 | 483,749(0.12%)#29 | 2,829,008(0.02%)#556 |
| 30. | Centereach | 558 | 483,749(0.12%)#30 | 2,829,008(0.02%)#574 |
| 31. | Franklin Square | 540 | 483,749(0.11%)#31 | 2,829,008(0.02%)#595 |
| 32. | Lake Success | 533 | 483,749(0.11%)#32 | 2,829,008(0.02%)#606 |
| 33. | Great Neck | 526 | 483,749(0.11%)#33 | 2,829,008(0.02%)#610 |
| 34. | Glen Cove | 503 | 483,749(0.10%)#34 | 2,829,008(0.02%)#631 |
| 35. | East Meadow | 485 | 483,749(0.10%)#35 | 2,829,008(0.02%)#644 |
| 36. | Smithtown | 470 | 483,749(0.10%)#36 | 2,829,008(0.02%)#667 |
| 37. | New Hyde Park | 438 | 483,749(0.09%)#37 | 2,829,008(0.02%)#692 |
| 38. | Manhasset | 428 | 483,749(0.09%)#38 | 2,829,008(0.02%)#702 |
| 39. | Searingtown | 423 | 483,749(0.09%)#39 | 2,829,008(0.01%)#709 |
| 40. | Roslyn Heights | 414 | 483,749(0.09%)#40 | 2,829,008(0.01%)#726 |
| 41. | Great Neck Plaza | 411 | 483,749(0.08%)#41 | 2,829,008(0.01%)#730 |
| 42. | Westmere | 395 | 483,749(0.08%)#42 | 2,829,008(0.01%)#746 |
| 43. | Forest Home | 382 | 483,749(0.08%)#43 | 2,829,008(0.01%)#771 |
| 44. | New Rochelle | 377 | 483,749(0.08%)#44 | 2,829,008(0.01%)#777 |
| 45. | Thomaston | 359 | 483,749(0.07%)#45 | 2,829,008(0.01%)#809 |
| 46. | Lansing | 350 | 483,749(0.07%)#46 | 2,829,008(0.01%)#822 |
| 47. | Latham | 342 | 483,749(0.07%)#47 | 2,829,008(0.01%)#836 |
| 48. | Port Washington | 341 | 483,749(0.07%)#48 | 2,829,008(0.01%)#839 |
| 49. | Gang Mills | 323 | 483,749(0.07%)#49 | 2,829,008(0.01%)#873 |
| 50. | Eastchester | 319 | 483,749(0.07%)#50 | 2,829,008(0.01%)#882 |
| 51. | North Hills | 318 | 483,749(0.07%)#51 | 2,829,008(0.01%)#886 |
| 52. | Cayuga Heights | 318 | 483,749(0.07%)#52 | 2,829,008(0.01%)#887 |
| 53. | Commack | 313 | 483,749(0.06%)#53 | 2,829,008(0.01%)#897 |
| 54. | Brewster Hill | 306 | 483,749(0.06%)#54 | 2,829,008(0.01%)#911 |
| 55. | Herricks | 305 | 483,749(0.06%)#55 | 2,829,008(0.01%)#914 |
| 56. | Saratoga Springs | 303 | 483,749(0.06%)#56 | 2,829,008(0.01%)#916 |
| 57. | Utica | 302 | 483,749(0.06%)#57 | 2,829,008(0.01%)#917 |
| 58. | Middletown | 297 | 483,749(0.06%)#58 | 2,829,008(0.01%)#924 |
| 59. | Shirley | 277 | 483,749(0.06%)#59 | 2,829,008(0.01%)#973 |
| 60. | Rockville Centre | 274 | 483,749(0.06%)#60 | 2,829,008(0.01%)#982 |
| 61. | North Bellmore | 273 | 483,749(0.06%)#61 | 2,829,008(0.01%)#989 |
| 62. | Great Neck Estates | 273 | 483,749(0.06%)#62 | 2,829,008(0.01%)#991 |
| 63. | Manhasset Hills | 272 | 483,749(0.06%)#63 | 2,829,008(0.01%)#995 |
| 64. | Albertson | 270 | 483,749(0.06%)#64 | 2,829,008(0.01%)#1,006 |
| 65. | Harrison | 264 | 483,749(0.05%)#65 | 2,829,008(0.01%)#1,028 |
| 66. | Johnson City | 264 | 483,749(0.05%)#66 | 2,829,008(0.01%)#1,030 |
| 67. | Bethpage | 262 | 483,749(0.05%)#67 | 2,829,008(0.01%)#1,038 |
| 68. | Russell Gardens | 262 | 483,749(0.05%)#68 | 2,829,008(0.01%)#1,039 |
| 69. | Irvington | 261 | 483,749(0.05%)#69 | 2,829,008(0.01%)#1,040 |
| 70. | Salisbury | 260 | 483,749(0.05%)#70 | 2,829,008(0.01%)#1,042 |
| 71. | Huntington Station | 243 | 483,749(0.05%)#71 | 2,829,008(0.01%)#1,084 |
| 72. | North Babylon | 243 | 483,749(0.05%)#72 | 2,829,008(0.01%)#1,085 |
| 73. | Rye | 241 | 483,749(0.05%)#73 | 2,829,008(0.01%)#1,095 |
| 74. | Merrick | 238 | 483,749(0.05%)#74 | 2,829,008(0.01%)#1,112 |
| 75. | East Setauket | 236 | 483,749(0.05%)#75 | 2,829,008(0.01%)#1,121 |
| 76. | Williston Park | 232 | 483,749(0.05%)#76 | 2,829,008(0.01%)#1,137 |
| 77. | Greenlawn | 227 | 483,749(0.05%)#77 | 2,829,008(0.01%)#1,161 |
| 78. | Ossining | 225 | 483,749(0.05%)#78 | 2,829,008(0.01%)#1,172 |
| 79. | Westbury | 224 | 483,749(0.05%)#79 | 2,829,008(0.01%)#1,177 |
| 80. | South Farmingdale | 220 | 483,749(0.05%)#80 | 2,829,008(0.01%)#1,193 |
| 81. | Muttontown | 218 | 483,749(0.05%)#81 | 2,829,008(0.01%)#1,199 |
| 82. | University At Buffalo | 215 | 483,749(0.04%)#82 | 2,829,008(0.01%)#1,212 |
| 83. | Nesconset | 214 | 483,749(0.04%)#83 | 2,829,008(0.01%)#1,219 |
| 84. | Schenectady | 209 | 483,749(0.04%)#84 | 2,829,008(0.01%)#1,232 |
| 85. | Coram | 206 | 483,749(0.04%)#85 | 2,829,008(0.01%)#1,246 |
| 86. | Huntington | 206 | 483,749(0.04%)#86 | 2,829,008(0.01%)#1,249 |
| 87. | North Valley Stream | 206 | 483,749(0.04%)#87 | 2,829,008(0.01%)#1,251 |
| 88. | Nanuet | 205 | 483,749(0.04%)#88 | 2,829,008(0.01%)#1,258 |
| 89. | Elmont | 204 | 483,749(0.04%)#89 | 2,829,008(0.01%)#1,261 |
| 90. | Niskayuna | 200 | 483,749(0.04%)#90 | 2,829,008(0.01%)#1,279 |
| 91. | East Hills | 200 | 483,749(0.04%)#91 | 2,829,008(0.01%)#1,281 |
| 92. | Bellerose Terrace | 198 | 483,749(0.04%)#92 | 2,829,008(0.01%)#1,298 |
| 93. | New City | 196 | 483,749(0.04%)#93 | 2,829,008(0.01%)#1,302 |
| 94. | Woodbury | 194 | 483,749(0.04%)#94 | 2,829,008(0.01%)#1,309 |
| 95. | Sound Beach | 189 | 483,749(0.04%)#95 | 2,829,008(0.01%)#1,332 |
| 96. | East Ithaca | 185 | 483,749(0.04%)#96 | 2,829,008(0.01%)#1,358 |
| 97. | Rye Brook | 183 | 483,749(0.04%)#97 | 2,829,008(0.01%)#1,364 |
| 98. | Hewlett | 178 | 483,749(0.04%)#98 | 2,829,008(0.01%)#1,385 |
| 99. | Port Chester | 174 | 483,749(0.04%)#99 | 2,829,008(0.01%)#1,406 |
| 100. | Spackenkill | 174 | 483,749(0.04%)#100 | 2,829,008(0.01%)#1,410 |
Common Questions
What are the Top 10 Cities with the Most Immigrants from China in New York?
Top 10 Cities with the Most Immigrants from China in New York are:
#1
398,944
#2
2,027
#3
2,025
#4
1,556
#5
1,510
#6
1,442
#7
1,220
#8
1,127
#9
1,049
#10
1,011
What city has the Most Immigrants from China in New York?
New York has the Most Immigrants from China in New York with 398,944.
What is the Total Immigrants from China in the State of New York?
Total Immigrants from China in New York is 483,749.
What is the Total Immigrants from China in the United States?
Total Immigrants from China in the United States is 2,829,008.