Cities with the Most Immigrants from China in Oklahoma
RELATED REPORTS & OPTIONS
China
Oklahoma
Compare Cities
Map of Cities with the Most Immigrants from China in Oklahoma
0
2,000
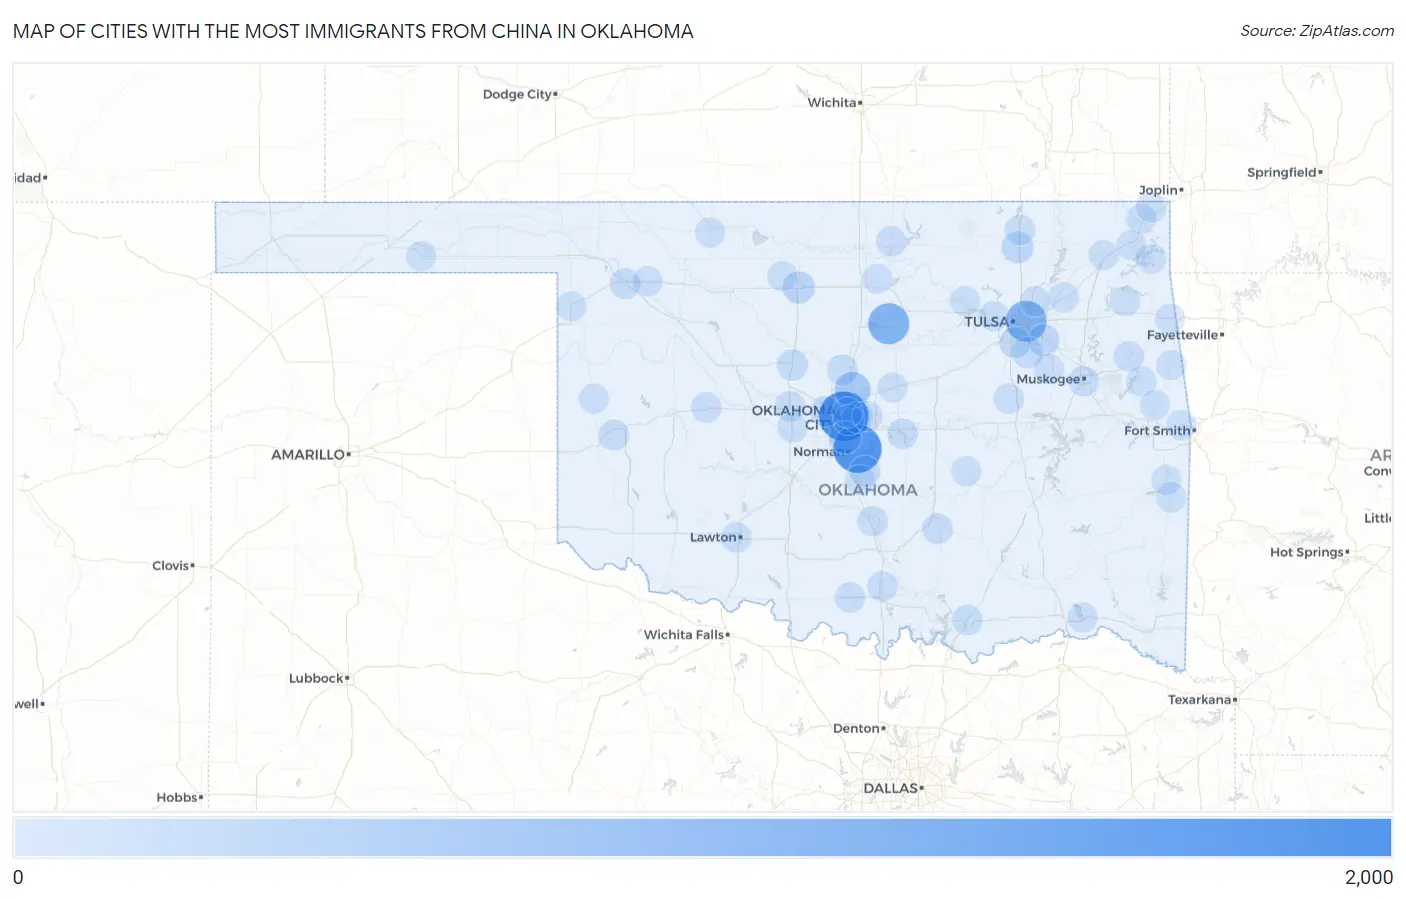
Cities with the Most Immigrants from China in Oklahoma
| City | China | vs State | vs National | |
| 1. | Oklahoma City | 1,951 | 9,099(21.44%)#1 | 2,829,008(0.07%)#173 |
| 2. | Norman | 1,825 | 9,099(20.06%)#2 | 2,829,008(0.06%)#188 |
| 3. | Stillwater | 1,080 | 9,099(11.87%)#3 | 2,829,008(0.04%)#322 |
| 4. | Tulsa | 1,061 | 9,099(11.66%)#4 | 2,829,008(0.04%)#329 |
| 5. | Edmond | 560 | 9,099(6.15%)#5 | 2,829,008(0.02%)#573 |
| 6. | Enid | 200 | 9,099(2.20%)#6 | 2,829,008(0.01%)#1,278 |
| 7. | Moore | 183 | 9,099(2.01%)#7 | 2,829,008(0.01%)#1,362 |
| 8. | Bartlesville | 159 | 9,099(1.75%)#8 | 2,829,008(0.01%)#1,503 |
| 9. | Broken Arrow | 148 | 9,099(1.63%)#9 | 2,829,008(0.01%)#1,578 |
| 10. | Bixby | 106 | 9,099(1.16%)#10 | 2,829,008(0.00%)#1,944 |
| 11. | Kingfisher | 104 | 9,099(1.14%)#11 | 2,829,008(0.00%)#1,972 |
| 12. | Jenks | 103 | 9,099(1.13%)#12 | 2,829,008(0.00%)#1,979 |
| 13. | Midwest City | 73 | 9,099(0.80%)#13 | 2,829,008(0.00%)#2,407 |
| 14. | Guthrie | 72 | 9,099(0.79%)#14 | 2,829,008(0.00%)#2,445 |
| 15. | Ada | 55 | 9,099(0.60%)#15 | 2,829,008(0.00%)#2,799 |
| 16. | Woodward | 55 | 9,099(0.60%)#16 | 2,829,008(0.00%)#2,804 |
| 17. | Elk City | 52 | 9,099(0.57%)#17 | 2,829,008(0.00%)#2,872 |
| 18. | Shawnee | 49 | 9,099(0.54%)#18 | 2,829,008(0.00%)#2,965 |
| 19. | Slaughterville | 49 | 9,099(0.54%)#19 | 2,829,008(0.00%)#2,987 |
| 20. | Lawton | 44 | 9,099(0.48%)#20 | 2,829,008(0.00%)#3,130 |
| 21. | Ardmore | 39 | 9,099(0.43%)#21 | 2,829,008(0.00%)#3,302 |
| 22. | Okmulgee | 39 | 9,099(0.43%)#22 | 2,829,008(0.00%)#3,310 |
| 23. | Durant | 37 | 9,099(0.41%)#23 | 2,829,008(0.00%)#3,372 |
| 24. | Bethany | 32 | 9,099(0.35%)#24 | 2,829,008(0.00%)#3,611 |
| 25. | Tahlequah | 32 | 9,099(0.35%)#25 | 2,829,008(0.00%)#3,614 |
| 26. | Weatherford | 32 | 9,099(0.35%)#26 | 2,829,008(0.00%)#3,619 |
| 27. | Muskogee | 31 | 9,099(0.34%)#27 | 2,829,008(0.00%)#3,651 |
| 28. | Ponca City | 31 | 9,099(0.34%)#28 | 2,829,008(0.00%)#3,657 |
| 29. | El Reno | 28 | 9,099(0.31%)#29 | 2,829,008(0.00%)#3,809 |
| 30. | Pauls Valley | 24 | 9,099(0.26%)#30 | 2,829,008(0.00%)#4,062 |
| 31. | Dewey | 20 | 9,099(0.22%)#31 | 2,829,008(0.00%)#4,317 |
| 32. | Owasso | 18 | 9,099(0.20%)#32 | 2,829,008(0.00%)#4,426 |
| 33. | Wilson | 17 | 9,099(0.19%)#33 | 2,829,008(0.00%)#4,572 |
| 34. | Kenwood | 15 | 9,099(0.16%)#34 | 2,829,008(0.00%)#4,751 |
| 35. | Baron | 15 | 9,099(0.16%)#35 | 2,829,008(0.00%)#4,760 |
| 36. | Del City | 12 | 9,099(0.13%)#36 | 2,829,008(0.00%)#4,975 |
| 37. | Holdenville | 11 | 9,099(0.12%)#37 | 2,829,008(0.00%)#5,108 |
| 38. | Choctaw | 10 | 9,099(0.11%)#38 | 2,829,008(0.00%)#5,187 |
| 39. | Sand Springs | 9 | 9,099(0.10%)#39 | 2,829,008(0.00%)#5,304 |
| 40. | Miami | 8 | 9,099(0.09%)#40 | 2,829,008(0.00%)#5,427 |
| 41. | Vinita | 7 | 9,099(0.08%)#41 | 2,829,008(0.00%)#5,584 |
| 42. | Dry Creek | 7 | 9,099(0.08%)#42 | 2,829,008(0.00%)#5,664 |
| 43. | Grove | 6 | 9,099(0.07%)#43 | 2,829,008(0.00%)#5,695 |
| 44. | Lexington | 6 | 9,099(0.07%)#44 | 2,829,008(0.00%)#5,757 |
| 45. | West Siloam Springs | 6 | 9,099(0.07%)#45 | 2,829,008(0.00%)#5,778 |
| 46. | Alva | 5 | 9,099(0.05%)#46 | 2,829,008(0.00%)#5,871 |
| 47. | Roland | 5 | 9,099(0.05%)#47 | 2,829,008(0.00%)#5,878 |
| 48. | Shattuck | 5 | 9,099(0.05%)#48 | 2,829,008(0.00%)#5,922 |
| 49. | Quapaw | 5 | 9,099(0.05%)#49 | 2,829,008(0.00%)#5,947 |
| 50. | Carrier | 5 | 9,099(0.05%)#50 | 2,829,008(0.00%)#5,972 |
| 51. | Heavener | 4 | 9,099(0.04%)#51 | 2,829,008(0.00%)#6,022 |
| 52. | Afton | 4 | 9,099(0.04%)#52 | 2,829,008(0.00%)#6,077 |
| 53. | Sawyer | 4 | 9,099(0.04%)#53 | 2,829,008(0.00%)#6,101 |
| 54. | Hardesty | 4 | 9,099(0.04%)#54 | 2,829,008(0.00%)#6,103 |
| 55. | Haskell | 3 | 9,099(0.03%)#55 | 2,829,008(0.00%)#6,173 |
| 56. | Forest Park | 3 | 9,099(0.03%)#56 | 2,829,008(0.00%)#6,211 |
| 57. | Cheyenne | 3 | 9,099(0.03%)#57 | 2,829,008(0.00%)#6,219 |
| 58. | Wellston | 3 | 9,099(0.03%)#58 | 2,829,008(0.00%)#6,221 |
| 59. | Claremore | 2 | 9,099(0.02%)#59 | 2,829,008(0.00%)#6,270 |
| 60. | Poteau | 2 | 9,099(0.02%)#60 | 2,829,008(0.00%)#6,285 |
| 61. | Mooreland | 2 | 9,099(0.02%)#61 | 2,829,008(0.00%)#6,336 |
| 62. | Brushy | 2 | 9,099(0.02%)#62 | 2,829,008(0.00%)#6,341 |
| 63. | Fairfield | 2 | 9,099(0.02%)#63 | 2,829,008(0.00%)#6,387 |
| 64. | Red Rock | 2 | 9,099(0.02%)#64 | 2,829,008(0.00%)#6,426 |
| 65. | Osage | 2 | 9,099(0.02%)#65 | 2,829,008(0.00%)#6,442 |
| 66. | Union City | 1 | 9,099(0.01%)#66 | 2,829,008(0.00%)#6,509 |
Common Questions
What are the Top 10 Cities with the Most Immigrants from China in Oklahoma?
Top 10 Cities with the Most Immigrants from China in Oklahoma are:
#1
1,951
#2
1,825
#3
1,080
#4
1,061
#5
560
#6
200
#7
183
#8
159
#9
148
#10
106
What city has the Most Immigrants from China in Oklahoma?
Oklahoma City has the Most Immigrants from China in Oklahoma with 1,951.
What is the Total Immigrants from China in the State of Oklahoma?
Total Immigrants from China in Oklahoma is 9,099.
What is the Total Immigrants from China in the United States?
Total Immigrants from China in the United States is 2,829,008.