Cities with the Most Immigrants from China in South Carolina
RELATED REPORTS & OPTIONS
China
South Carolina
Compare Cities
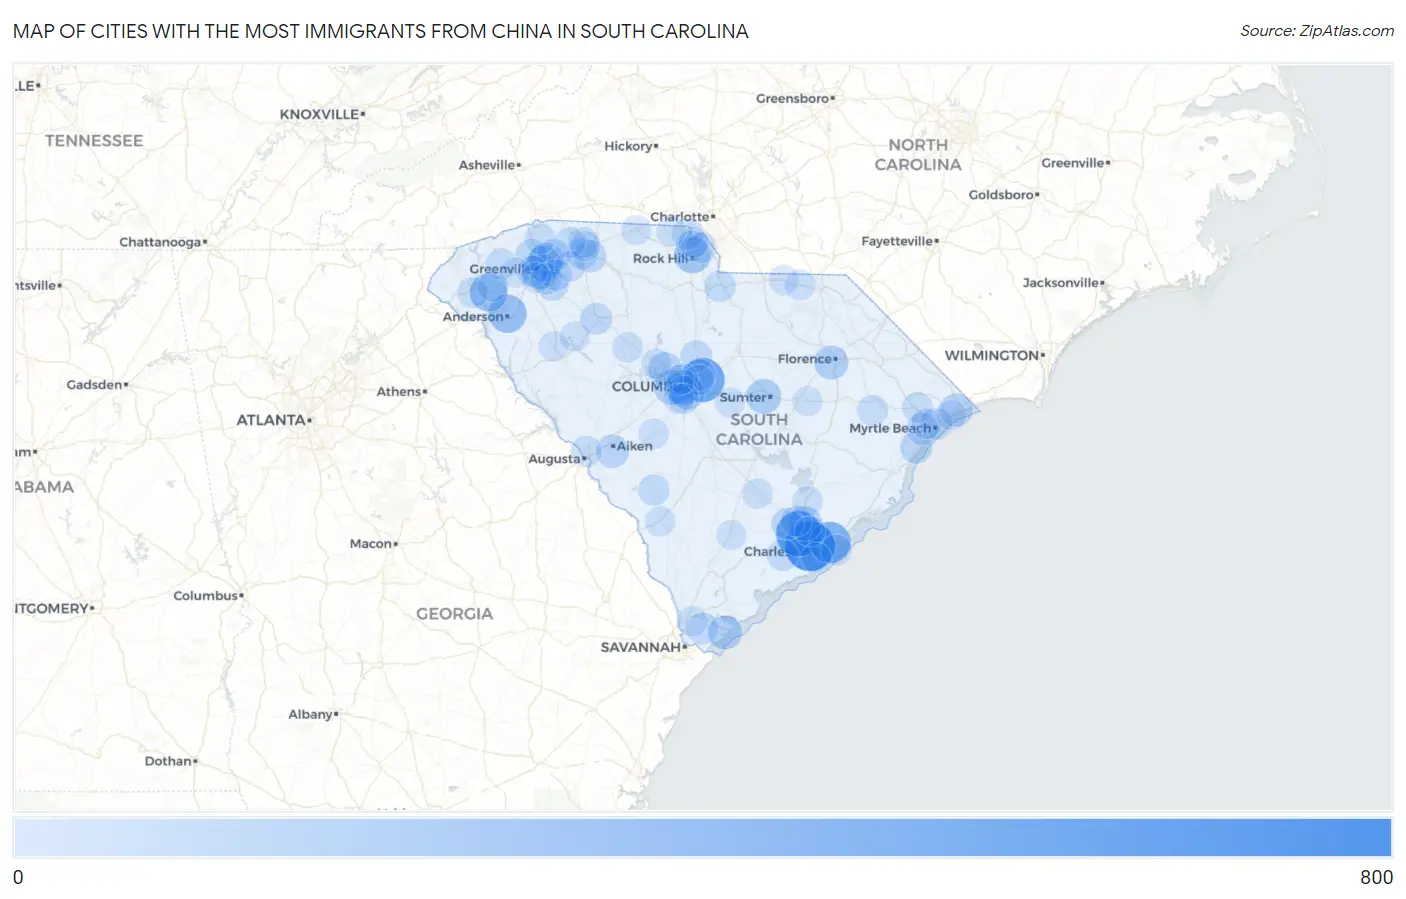
Map of Cities with the Most Immigrants from China in South Carolina
0
800
Cities with the Most Immigrants from China in South Carolina
| City | China | vs State | vs National | |
| 1. | Charleston | 759 | 10,513(7.22%)#1 | 2,829,008(0.03%)#442 |
| 2. | North Charleston | 599 | 10,513(5.70%)#2 | 2,829,008(0.02%)#545 |
| 3. | Columbia | 550 | 10,513(5.23%)#3 | 2,829,008(0.02%)#581 |
| 4. | Mount Pleasant | 436 | 10,513(4.15%)#4 | 2,829,008(0.02%)#693 |
| 5. | Anderson | 309 | 10,513(2.94%)#5 | 2,829,008(0.01%)#907 |
| 6. | Clemson | 294 | 10,513(2.80%)#6 | 2,829,008(0.01%)#937 |
| 7. | Rock Hill | 244 | 10,513(2.32%)#7 | 2,829,008(0.01%)#1,081 |
| 8. | Greenville | 203 | 10,513(1.93%)#8 | 2,829,008(0.01%)#1,263 |
| 9. | Wade Hampton | 201 | 10,513(1.91%)#9 | 2,829,008(0.01%)#1,277 |
| 10. | Sumter | 177 | 10,513(1.68%)#10 | 2,829,008(0.01%)#1,389 |
| 11. | West Columbia | 174 | 10,513(1.66%)#11 | 2,829,008(0.01%)#1,407 |
| 12. | Goose Creek | 163 | 10,513(1.55%)#12 | 2,829,008(0.01%)#1,469 |
| 13. | Taylors | 163 | 10,513(1.55%)#13 | 2,829,008(0.01%)#1,473 |
| 14. | Lexington | 161 | 10,513(1.53%)#14 | 2,829,008(0.01%)#1,492 |
| 15. | Cayce | 149 | 10,513(1.42%)#15 | 2,829,008(0.01%)#1,572 |
| 16. | Florence | 146 | 10,513(1.39%)#16 | 2,829,008(0.01%)#1,599 |
| 17. | Hilton Head Island | 146 | 10,513(1.39%)#17 | 2,829,008(0.01%)#1,600 |
| 18. | Lake Murray Of Richland | 128 | 10,513(1.22%)#18 | 2,829,008(0.00%)#1,739 |
| 19. | North Myrtle Beach | 119 | 10,513(1.13%)#19 | 2,829,008(0.00%)#1,817 |
| 20. | Aiken | 105 | 10,513(1.00%)#20 | 2,829,008(0.00%)#1,956 |
| 21. | Arthurtown | 105 | 10,513(1.00%)#21 | 2,829,008(0.00%)#1,961 |
| 22. | Spartanburg | 90 | 10,513(0.86%)#22 | 2,829,008(0.00%)#2,143 |
| 23. | Socastee | 80 | 10,513(0.76%)#23 | 2,829,008(0.00%)#2,298 |
| 24. | Summerville | 78 | 10,513(0.74%)#24 | 2,829,008(0.00%)#2,328 |
| 25. | Greer | 72 | 10,513(0.68%)#25 | 2,829,008(0.00%)#2,436 |
| 26. | Murrells Inlet | 72 | 10,513(0.68%)#26 | 2,829,008(0.00%)#2,446 |
| 27. | Myrtle Beach | 68 | 10,513(0.65%)#27 | 2,829,008(0.00%)#2,511 |
| 28. | Clinton | 68 | 10,513(0.65%)#28 | 2,829,008(0.00%)#2,519 |
| 29. | Travelers Rest | 65 | 10,513(0.62%)#29 | 2,829,008(0.00%)#2,578 |
| 30. | Blythewood | 64 | 10,513(0.61%)#30 | 2,829,008(0.00%)#2,602 |
| 31. | Simpsonville | 58 | 10,513(0.55%)#31 | 2,829,008(0.00%)#2,729 |
| 32. | Bluffton | 56 | 10,513(0.53%)#32 | 2,829,008(0.00%)#2,774 |
| 33. | Hollywood | 55 | 10,513(0.52%)#33 | 2,829,008(0.00%)#2,809 |
| 34. | Lancaster | 51 | 10,513(0.49%)#34 | 2,829,008(0.00%)#2,909 |
| 35. | Mauldin | 50 | 10,513(0.48%)#35 | 2,829,008(0.00%)#2,930 |
| 36. | Five Forks | 50 | 10,513(0.48%)#36 | 2,829,008(0.00%)#2,934 |
| 37. | Arcadia | 50 | 10,513(0.48%)#37 | 2,829,008(0.00%)#2,954 |
| 38. | Lake Wylie | 47 | 10,513(0.45%)#38 | 2,829,008(0.00%)#3,044 |
| 39. | Barnwell | 45 | 10,513(0.43%)#39 | 2,829,008(0.00%)#3,119 |
| 40. | Pickens | 44 | 10,513(0.42%)#40 | 2,829,008(0.00%)#3,151 |
| 41. | Dentsville | 43 | 10,513(0.41%)#41 | 2,829,008(0.00%)#3,168 |
| 42. | Judson | 38 | 10,513(0.36%)#42 | 2,829,008(0.00%)#3,358 |
| 43. | Boiling Springs | 37 | 10,513(0.35%)#43 | 2,829,008(0.00%)#3,383 |
| 44. | Baxter | 35 | 10,513(0.33%)#44 | 2,829,008(0.00%)#3,495 |
| 45. | Inman Mills | 34 | 10,513(0.32%)#45 | 2,829,008(0.00%)#3,549 |
| 46. | Seneca | 30 | 10,513(0.29%)#46 | 2,829,008(0.00%)#3,717 |
| 47. | India Hook | 28 | 10,513(0.27%)#47 | 2,829,008(0.00%)#3,841 |
| 48. | North Augusta | 26 | 10,513(0.25%)#48 | 2,829,008(0.00%)#3,924 |
| 49. | Johnsonville | 26 | 10,513(0.25%)#49 | 2,829,008(0.00%)#3,967 |
| 50. | Ladson | 24 | 10,513(0.23%)#50 | 2,829,008(0.00%)#4,034 |
| 51. | Oak Grove | 24 | 10,513(0.23%)#51 | 2,829,008(0.00%)#4,043 |
| 52. | Springdale | 24 | 10,513(0.23%)#52 | 2,829,008(0.00%)#4,075 |
| 53. | Isle Of Palms | 22 | 10,513(0.21%)#53 | 2,829,008(0.00%)#4,190 |
| 54. | Tigerville | 22 | 10,513(0.21%)#54 | 2,829,008(0.00%)#4,202 |
| 55. | St Andrews | 20 | 10,513(0.19%)#55 | 2,829,008(0.00%)#4,271 |
| 56. | Central | 20 | 10,513(0.19%)#56 | 2,829,008(0.00%)#4,304 |
| 57. | Fort Mill | 19 | 10,513(0.18%)#57 | 2,829,008(0.00%)#4,344 |
| 58. | Conway | 19 | 10,513(0.18%)#58 | 2,829,008(0.00%)#4,345 |
| 59. | Seven Oaks | 19 | 10,513(0.18%)#59 | 2,829,008(0.00%)#4,356 |
| 60. | Forest Acres | 18 | 10,513(0.17%)#60 | 2,829,008(0.00%)#4,446 |
| 61. | Capitol View | 18 | 10,513(0.17%)#61 | 2,829,008(0.00%)#4,475 |
| 62. | Wagener | 17 | 10,513(0.16%)#62 | 2,829,008(0.00%)#4,580 |
| 63. | Forestbrook | 16 | 10,513(0.15%)#63 | 2,829,008(0.00%)#4,621 |
| 64. | Hanahan | 14 | 10,513(0.13%)#64 | 2,829,008(0.00%)#4,771 |
| 65. | Gantt | 14 | 10,513(0.13%)#65 | 2,829,008(0.00%)#4,779 |
| 66. | Tega Cay | 14 | 10,513(0.13%)#66 | 2,829,008(0.00%)#4,782 |
| 67. | Reidville | 12 | 10,513(0.11%)#67 | 2,829,008(0.00%)#5,046 |
| 68. | Valley Falls | 11 | 10,513(0.10%)#68 | 2,829,008(0.00%)#5,100 |
| 69. | Hardeeville | 10 | 10,513(0.10%)#69 | 2,829,008(0.00%)#5,202 |
| 70. | Chapin | 10 | 10,513(0.10%)#70 | 2,829,008(0.00%)#5,267 |
| 71. | Chesterfield | 9 | 10,513(0.09%)#71 | 2,829,008(0.00%)#5,388 |
| 72. | Harleyville | 9 | 10,513(0.09%)#72 | 2,829,008(0.00%)#5,400 |
| 73. | Moncks Corner | 8 | 10,513(0.08%)#73 | 2,829,008(0.00%)#5,424 |
| 74. | Newberry | 8 | 10,513(0.08%)#74 | 2,829,008(0.00%)#5,433 |
| 75. | Allendale | 6 | 10,513(0.06%)#75 | 2,829,008(0.00%)#5,736 |
| 76. | South Congaree | 6 | 10,513(0.06%)#76 | 2,829,008(0.00%)#5,748 |
| 77. | Eastover | 6 | 10,513(0.06%)#77 | 2,829,008(0.00%)#5,810 |
| 78. | Fripp Island | 5 | 10,513(0.05%)#78 | 2,829,008(0.00%)#5,951 |
| 79. | Easley | 4 | 10,513(0.04%)#79 | 2,829,008(0.00%)#5,981 |
| 80. | Clover | 4 | 10,513(0.04%)#80 | 2,829,008(0.00%)#6,002 |
| 81. | Pine Ridge | 4 | 10,513(0.04%)#81 | 2,829,008(0.00%)#6,025 |
| 82. | Waterloo | 4 | 10,513(0.04%)#82 | 2,829,008(0.00%)#6,107 |
| 83. | Hodges | 3 | 10,513(0.03%)#83 | 2,829,008(0.00%)#6,259 |
| 84. | James Island | 2 | 10,513(0.02%)#84 | 2,829,008(0.00%)#6,280 |
| 85. | Blacksburg | 2 | 10,513(0.02%)#85 | 2,829,008(0.00%)#6,309 |
| 86. | Turbeville | 2 | 10,513(0.02%)#86 | 2,829,008(0.00%)#6,365 |
| 87. | Briarcliffe Acres | 2 | 10,513(0.02%)#87 | 2,829,008(0.00%)#6,381 |
| 88. | Mount Croghan | 2 | 10,513(0.02%)#88 | 2,829,008(0.00%)#6,432 |
| 89. | Clemson University | 1 | 10,513(0.01%)#89 | 2,829,008(0.00%)#6,467 |
| 90. | Walterboro | 1 | 10,513(0.01%)#90 | 2,829,008(0.00%)#6,468 |
Common Questions
What are the Top 10 Cities with the Most Immigrants from China in South Carolina?
Top 10 Cities with the Most Immigrants from China in South Carolina are:
#1
759
#2
599
#3
550
#4
436
#5
309
#6
294
#7
244
#8
203
#9
201
#10
177
What city has the Most Immigrants from China in South Carolina?
Charleston has the Most Immigrants from China in South Carolina with 759.
What is the Total Immigrants from China in the State of South Carolina?
Total Immigrants from China in South Carolina is 10,513.
What is the Total Immigrants from China in the United States?
Total Immigrants from China in the United States is 2,829,008.