Cities with the Most Immigrants from China in Georgia
RELATED REPORTS & OPTIONS
China
Georgia
Compare Cities
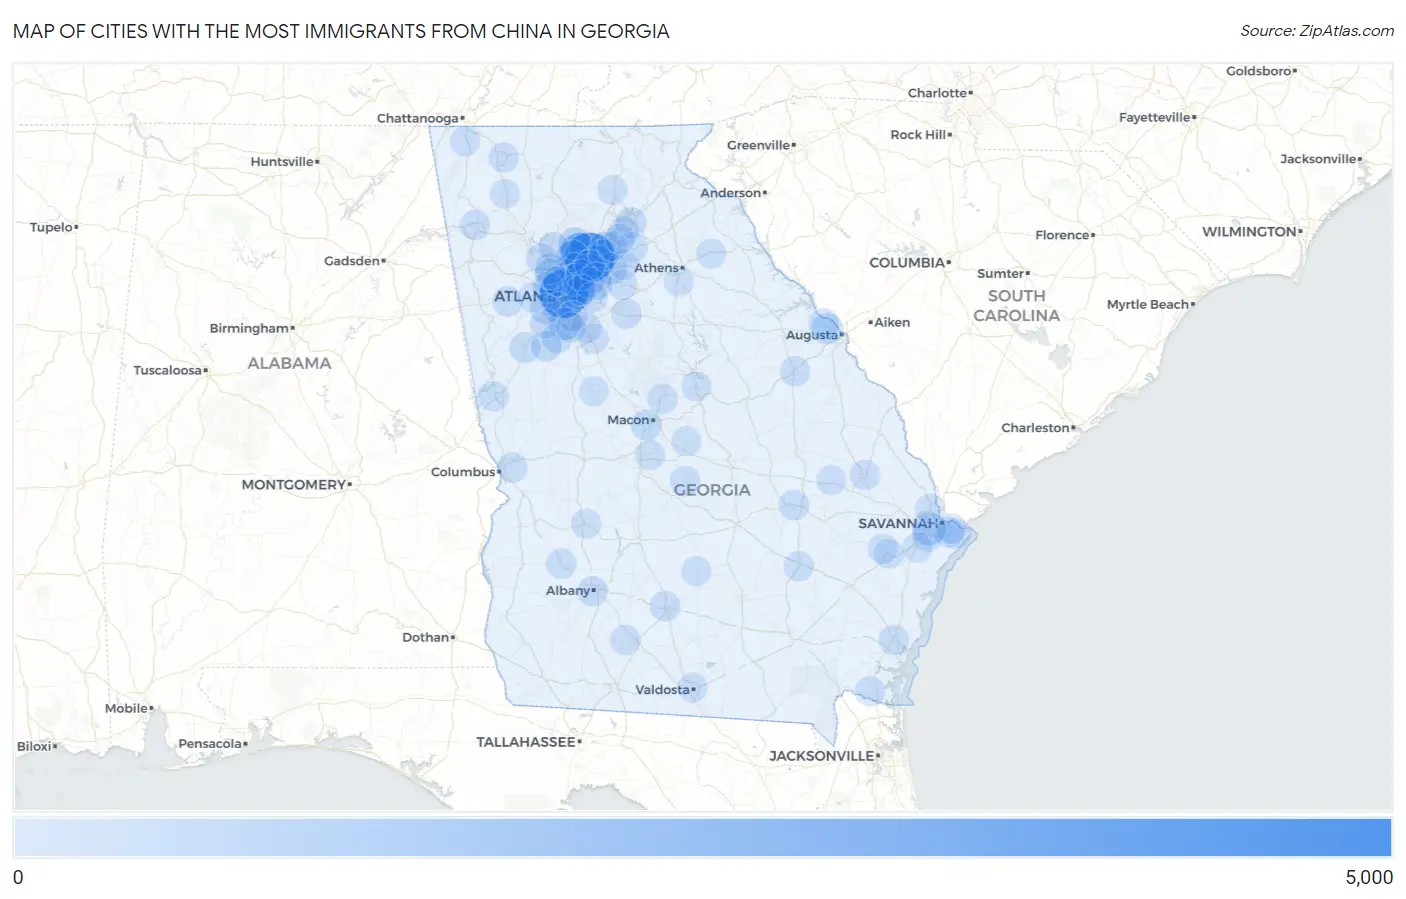
Map of Cities with the Most Immigrants from China in Georgia
0
5,000
Cities with the Most Immigrants from China in Georgia
| City | China | vs State | vs National | |
| 1. | Johns Creek | 4,103 | 47,601(8.62%)#1 | 2,829,008(0.15%)#89 |
| 2. | Atlanta | 3,809 | 47,601(8.00%)#2 | 2,829,008(0.13%)#98 |
| 3. | Alpharetta | 1,871 | 47,601(3.93%)#3 | 2,829,008(0.07%)#179 |
| 4. | Athens-Clarke County Unified Government (Balance) | 915 | 47,601(1.92%)#4 | 2,829,008(0.03%)#377 |
| 5. | Duluth | 914 | 47,601(1.92%)#5 | 2,829,008(0.03%)#378 |
| 6. | Peachtree Corners | 891 | 47,601(1.87%)#6 | 2,829,008(0.03%)#389 |
| 7. | Sandy Springs | 865 | 47,601(1.82%)#7 | 2,829,008(0.03%)#396 |
| 8. | Dunwoody | 796 | 47,601(1.67%)#8 | 2,829,008(0.03%)#424 |
| 9. | North Druid Hills | 670 | 47,601(1.41%)#9 | 2,829,008(0.02%)#500 |
| 10. | Savannah | 646 | 47,601(1.36%)#10 | 2,829,008(0.02%)#514 |
| 11. | Milton | 554 | 47,601(1.16%)#11 | 2,829,008(0.02%)#576 |
| 12. | North Decatur | 489 | 47,601(1.03%)#12 | 2,829,008(0.02%)#640 |
| 13. | Riverdale | 454 | 47,601(0.95%)#13 | 2,829,008(0.02%)#680 |
| 14. | Roswell | 426 | 47,601(0.89%)#14 | 2,829,008(0.02%)#703 |
| 15. | Brookhaven | 388 | 47,601(0.82%)#15 | 2,829,008(0.01%)#757 |
| 16. | Norcross | 361 | 47,601(0.76%)#16 | 2,829,008(0.01%)#803 |
| 17. | Lawrenceville | 359 | 47,601(0.75%)#17 | 2,829,008(0.01%)#808 |
| 18. | Chamblee | 349 | 47,601(0.73%)#18 | 2,829,008(0.01%)#825 |
| 19. | Mountain Park | 339 | 47,601(0.71%)#19 | 2,829,008(0.01%)#841 |
| 20. | Decatur | 311 | 47,601(0.65%)#20 | 2,829,008(0.01%)#904 |
| 21. | Smyrna | 301 | 47,601(0.63%)#21 | 2,829,008(0.01%)#918 |
| 22. | Augusta-Richmond County Consolidated Government (Balance) | 299 | 47,601(0.63%)#22 | 2,829,008(0.01%)#920 |
| 23. | Martinez | 295 | 47,601(0.62%)#23 | 2,829,008(0.01%)#931 |
| 24. | Sugar Hill | 271 | 47,601(0.57%)#24 | 2,829,008(0.01%)#999 |
| 25. | Newnan | 211 | 47,601(0.44%)#25 | 2,829,008(0.01%)#1,228 |
| 26. | Druid Hills | 206 | 47,601(0.43%)#26 | 2,829,008(0.01%)#1,254 |
| 27. | Macon Bibb County | 194 | 47,601(0.41%)#27 | 2,829,008(0.01%)#1,307 |
| 28. | Fayetteville | 181 | 47,601(0.38%)#28 | 2,829,008(0.01%)#1,373 |
| 29. | Suwanee | 177 | 47,601(0.37%)#29 | 2,829,008(0.01%)#1,393 |
| 30. | Peachtree City | 176 | 47,601(0.37%)#30 | 2,829,008(0.01%)#1,399 |
| 31. | Evans | 155 | 47,601(0.33%)#31 | 2,829,008(0.01%)#1,539 |
| 32. | Kennesaw | 148 | 47,601(0.31%)#32 | 2,829,008(0.01%)#1,580 |
| 33. | Tucker | 136 | 47,601(0.29%)#33 | 2,829,008(0.00%)#1,670 |
| 34. | Marietta | 135 | 47,601(0.28%)#34 | 2,829,008(0.00%)#1,678 |
| 35. | Doraville | 132 | 47,601(0.28%)#35 | 2,829,008(0.00%)#1,704 |
| 36. | Tifton | 126 | 47,601(0.26%)#36 | 2,829,008(0.00%)#1,753 |
| 37. | Gainesville | 124 | 47,601(0.26%)#37 | 2,829,008(0.00%)#1,767 |
| 38. | Stockbridge | 124 | 47,601(0.26%)#38 | 2,829,008(0.00%)#1,772 |
| 39. | Mableton | 117 | 47,601(0.25%)#39 | 2,829,008(0.00%)#1,830 |
| 40. | Albany | 105 | 47,601(0.22%)#40 | 2,829,008(0.00%)#1,953 |
| 41. | East Point | 98 | 47,601(0.21%)#41 | 2,829,008(0.00%)#2,043 |
| 42. | Oxford | 92 | 47,601(0.19%)#42 | 2,829,008(0.00%)#2,125 |
| 43. | South Fulton | 91 | 47,601(0.19%)#43 | 2,829,008(0.00%)#2,127 |
| 44. | Lilburn | 90 | 47,601(0.19%)#44 | 2,829,008(0.00%)#2,150 |
| 45. | Woodstock | 89 | 47,601(0.19%)#45 | 2,829,008(0.00%)#2,159 |
| 46. | Braselton | 83 | 47,601(0.17%)#46 | 2,829,008(0.00%)#2,248 |
| 47. | Fair Oaks | 83 | 47,601(0.17%)#47 | 2,829,008(0.00%)#2,254 |
| 48. | Vidalia | 80 | 47,601(0.17%)#48 | 2,829,008(0.00%)#2,302 |
| 49. | Baxley | 74 | 47,601(0.16%)#49 | 2,829,008(0.00%)#2,404 |
| 50. | Dacula | 65 | 47,601(0.14%)#50 | 2,829,008(0.00%)#2,579 |
| 51. | Columbus | 64 | 47,601(0.13%)#51 | 2,829,008(0.00%)#2,585 |
| 52. | Wilmington Island | 63 | 47,601(0.13%)#52 | 2,829,008(0.00%)#2,620 |
| 53. | Cochran | 63 | 47,601(0.13%)#53 | 2,829,008(0.00%)#2,627 |
| 54. | Wrens | 59 | 47,601(0.12%)#54 | 2,829,008(0.00%)#2,720 |
| 55. | Dalton | 58 | 47,601(0.12%)#55 | 2,829,008(0.00%)#2,727 |
| 56. | Villa Rica | 58 | 47,601(0.12%)#56 | 2,829,008(0.00%)#2,733 |
| 57. | Georgetown | 57 | 47,601(0.12%)#57 | 2,829,008(0.00%)#2,756 |
| 58. | Funston | 54 | 47,601(0.11%)#58 | 2,829,008(0.00%)#2,834 |
| 59. | Dawson | 52 | 47,601(0.11%)#59 | 2,829,008(0.00%)#2,879 |
| 60. | Berkeley Lake | 51 | 47,601(0.11%)#60 | 2,829,008(0.00%)#2,921 |
| 61. | Chickamauga | 49 | 47,601(0.10%)#61 | 2,829,008(0.00%)#2,992 |
| 62. | Redan | 48 | 47,601(0.10%)#62 | 2,829,008(0.00%)#3,004 |
| 63. | Kingsland | 45 | 47,601(0.09%)#63 | 2,829,008(0.00%)#3,103 |
| 64. | Dock Junction | 45 | 47,601(0.09%)#64 | 2,829,008(0.00%)#3,111 |
| 65. | Rome | 44 | 47,601(0.09%)#65 | 2,829,008(0.00%)#3,131 |
| 66. | Statesboro | 44 | 47,601(0.09%)#66 | 2,829,008(0.00%)#3,133 |
| 67. | Scottdale | 43 | 47,601(0.09%)#67 | 2,829,008(0.00%)#3,174 |
| 68. | Lagrange | 39 | 47,601(0.08%)#68 | 2,829,008(0.00%)#3,294 |
| 69. | Kennesaw State University | 37 | 47,601(0.08%)#69 | 2,829,008(0.00%)#3,408 |
| 70. | Lake City | 36 | 47,601(0.08%)#70 | 2,829,008(0.00%)#3,452 |
| 71. | Fairburn | 35 | 47,601(0.07%)#71 | 2,829,008(0.00%)#3,476 |
| 72. | Metter | 34 | 47,601(0.07%)#72 | 2,829,008(0.00%)#3,540 |
| 73. | Mcdonough | 33 | 47,601(0.07%)#73 | 2,829,008(0.00%)#3,554 |
| 74. | Dutch Island | 31 | 47,601(0.07%)#74 | 2,829,008(0.00%)#3,689 |
| 75. | Vinings | 29 | 47,601(0.06%)#75 | 2,829,008(0.00%)#3,762 |
| 76. | Fairfield Plantation | 27 | 47,601(0.06%)#76 | 2,829,008(0.00%)#3,895 |
| 77. | Oakwood | 27 | 47,601(0.06%)#77 | 2,829,008(0.00%)#3,899 |
| 78. | Warner Robins | 25 | 47,601(0.05%)#78 | 2,829,008(0.00%)#3,970 |
| 79. | Calhoun | 25 | 47,601(0.05%)#79 | 2,829,008(0.00%)#3,982 |
| 80. | Richmond Hill | 25 | 47,601(0.05%)#80 | 2,829,008(0.00%)#3,983 |
| 81. | Jonesboro | 25 | 47,601(0.05%)#81 | 2,829,008(0.00%)#4,004 |
| 82. | Douglasville | 24 | 47,601(0.05%)#82 | 2,829,008(0.00%)#4,028 |
| 83. | Americus | 24 | 47,601(0.05%)#83 | 2,829,008(0.00%)#4,032 |
| 84. | Port Wentworth | 23 | 47,601(0.05%)#84 | 2,829,008(0.00%)#4,110 |
| 85. | Loganville | 21 | 47,601(0.04%)#85 | 2,829,008(0.00%)#4,217 |
| 86. | Buford | 20 | 47,601(0.04%)#86 | 2,829,008(0.00%)#4,276 |
| 87. | Berry College | 20 | 47,601(0.04%)#87 | 2,829,008(0.00%)#4,330 |
| 88. | Fort Stewart | 19 | 47,601(0.04%)#88 | 2,829,008(0.00%)#4,372 |
| 89. | Dahlonega | 19 | 47,601(0.04%)#89 | 2,829,008(0.00%)#4,381 |
| 90. | Whitemarsh Island | 19 | 47,601(0.04%)#90 | 2,829,008(0.00%)#4,382 |
| 91. | Comer | 19 | 47,601(0.04%)#91 | 2,829,008(0.00%)#4,410 |
| 92. | Milledgeville | 18 | 47,601(0.04%)#92 | 2,829,008(0.00%)#4,436 |
| 93. | Flowery Branch | 17 | 47,601(0.04%)#93 | 2,829,008(0.00%)#4,521 |
| 94. | Barnesville | 17 | 47,601(0.04%)#94 | 2,829,008(0.00%)#4,537 |
| 95. | Gray | 17 | 47,601(0.04%)#95 | 2,829,008(0.00%)#4,557 |
| 96. | Flemington | 16 | 47,601(0.03%)#96 | 2,829,008(0.00%)#4,673 |
| 97. | Valdosta | 15 | 47,601(0.03%)#97 | 2,829,008(0.00%)#4,681 |
| 98. | Watkinsville | 15 | 47,601(0.03%)#98 | 2,829,008(0.00%)#4,736 |
| 99. | Jeffersonville | 15 | 47,601(0.03%)#99 | 2,829,008(0.00%)#4,755 |
| 100. | Fitzgerald | 14 | 47,601(0.03%)#100 | 2,829,008(0.00%)#4,793 |
Common Questions
What are the Top 10 Cities with the Most Immigrants from China in Georgia?
Top 10 Cities with the Most Immigrants from China in Georgia are:
#1
4,103
#2
3,809
#3
1,871
#4
914
#5
891
#6
865
#7
796
#8
670
#9
646
#10
554
What city has the Most Immigrants from China in Georgia?
Johns Creek has the Most Immigrants from China in Georgia with 4,103.
What is the Total Immigrants from China in the State of Georgia?
Total Immigrants from China in Georgia is 47,601.
What is the Total Immigrants from China in the United States?
Total Immigrants from China in the United States is 2,829,008.