Cities with the Highest Percentage of Immigrants from Latin America in Minnesota
RELATED REPORTS & OPTIONS
Latin America
Minnesota
Compare Cities
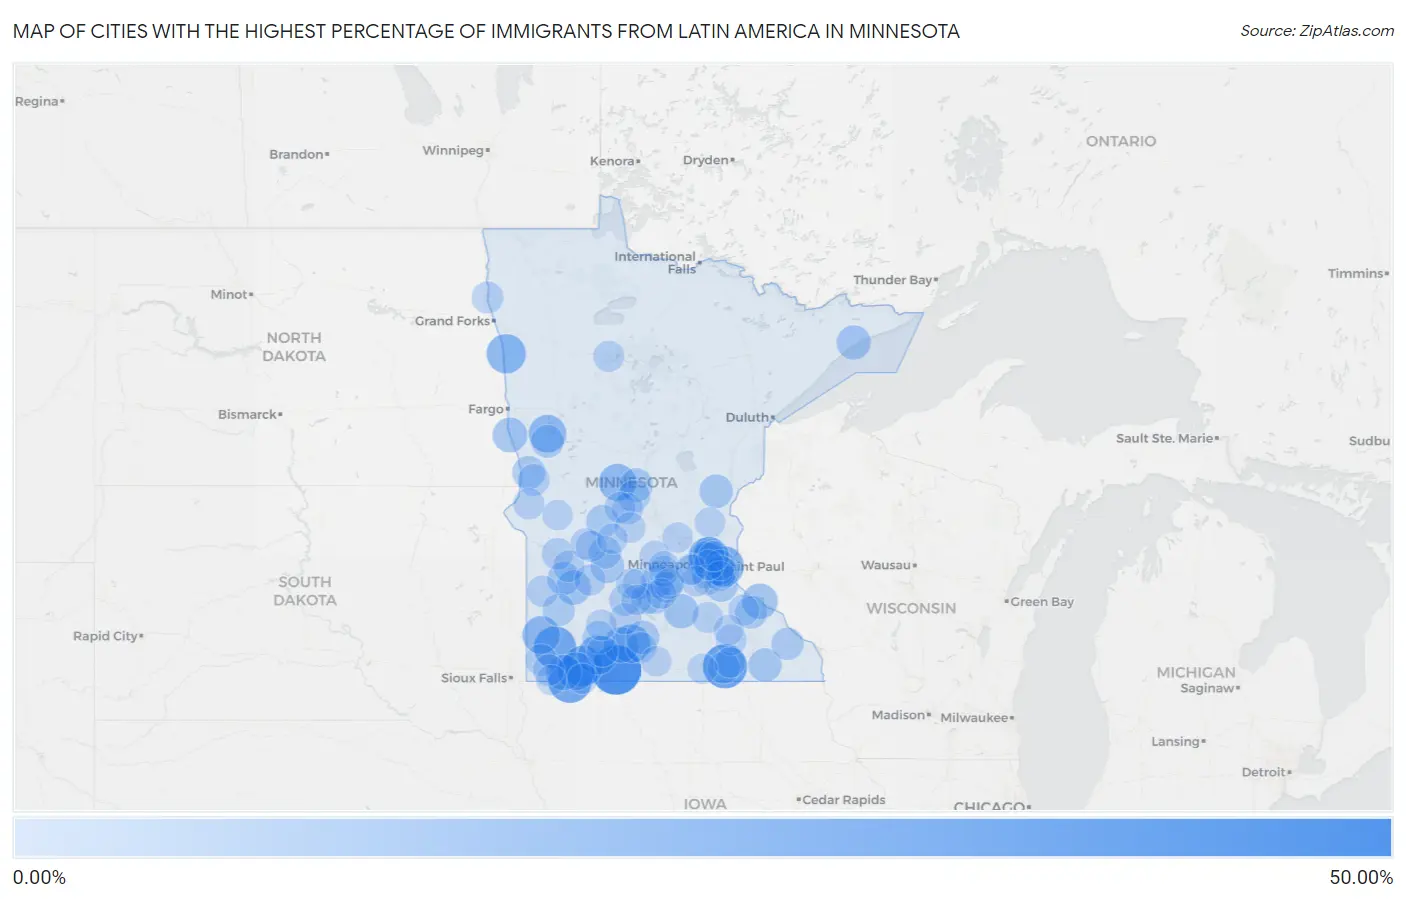
Map of Cities with the Highest Percentage of Immigrants from Latin America in Minnesota
0.00%
50.00%
Cities with the Highest Percentage of Immigrants from Latin America in Minnesota
| City | Latin America | vs State | vs National | |
| 1. | Alpha | 42.98% | 1.94%(+41.0)#-1 | 6.84%(+36.1)#0 |
| 2. | Mapleview | 31.90% | 1.94%(+30.0)#0 | 6.84%(+25.1)#1 |
| 3. | Bigelow | 30.27% | 1.94%(+28.3)#1 | 6.84%(+23.4)#2 |
| 4. | Chandler | 27.86% | 1.94%(+25.9)#2 | 6.84%(+21.0)#3 |
| 5. | Hilltop | 25.47% | 1.94%(+23.5)#3 | 6.84%(+18.6)#4 |
| 6. | Brewster | 24.63% | 1.94%(+22.7)#4 | 6.84%(+17.8)#5 |
| 7. | Landfall | 23.93% | 1.94%(+22.0)#5 | 6.84%(+17.1)#6 |
| 8. | Nielsville | 21.59% | 1.94%(+19.6)#6 | 6.84%(+14.8)#7 |
| 9. | Wilder | 21.43% | 1.94%(+19.5)#7 | 6.84%(+14.6)#8 |
| 10. | St James | 20.03% | 1.94%(+18.1)#8 | 6.84%(+13.2)#9 |
| 11. | Holland | 18.77% | 1.94%(+16.8)#9 | 6.84%(+11.9)#10 |
| 12. | Worthington | 18.64% | 1.94%(+16.7)#10 | 6.84%(+11.8)#11 |
| 13. | Pelican Rapids | 18.39% | 1.94%(+16.4)#11 | 6.84%(+11.5)#12 |
| 14. | Long Prairie | 17.86% | 1.94%(+15.9)#19 | 6.84%(+11.0)#1,184 |
| 15. | Rushmore | 14.24% | 1.94%(+12.3)#20 | 6.84%(+7.40)#1,185 |
| 16. | Butterfield | 14.04% | 1.94%(+12.1)#21 | 6.84%(+7.20)#1,186 |
| 17. | Frontenac | 14.02% | 1.94%(+12.1)#22 | 6.84%(+7.18)#1,187 |
| 18. | Wolverton | 12.77% | 1.94%(+10.8)#23 | 6.84%(+5.93)#1,188 |
| 19. | Hanley Falls | 12.21% | 1.94%(+10.3)#24 | 6.84%(+5.37)#1,189 |
| 20. | Le Center | 11.91% | 1.94%(+9.97)#25 | 6.84%(+5.07)#1,190 |
| 21. | Lutsen | 11.56% | 1.94%(+9.61)#26 | 6.84%(+4.71)#1,191 |
| 22. | Blomkest | 10.34% | 1.94%(+8.40)#27 | 6.84%(+3.50)#1,192 |
| 23. | Madelia | 10.20% | 1.94%(+8.26)#28 | 6.84%(+3.36)#1,193 |
| 24. | Coates | 10.00% | 1.94%(+8.06)#29 | 6.84%(+3.16)#1,194 |
| 25. | Henriette | 10.00% | 1.94%(+8.06)#30 | 6.84%(+3.16)#1,195 |
| 26. | Wykoff | 9.77% | 1.94%(+7.83)#31 | 6.84%(+2.93)#1,196 |
| 27. | Flensburg | 9.76% | 1.94%(+7.81)#32 | 6.84%(+2.92)#1,197 |
| 28. | Clarkfield | 9.59% | 1.94%(+7.65)#33 | 6.84%(+2.75)#1,198 |
| 29. | Campbell | 9.39% | 1.94%(+7.45)#34 | 6.84%(+2.55)#1,199 |
| 30. | Gaylord | 9.32% | 1.94%(+7.38)#35 | 6.84%(+2.48)#1,200 |
| 31. | Erhard | 8.92% | 1.94%(+6.98)#36 | 6.84%(+2.08)#1,201 |
| 32. | Brooten | 8.48% | 1.94%(+6.54)#37 | 6.84%(+1.64)#1,202 |
| 33. | Jeffers | 8.02% | 1.94%(+6.08)#38 | 6.84%(+1.18)#1,203 |
| 34. | Richfield | 7.98% | 1.94%(+6.04)#39 | 6.84%(+1.14)#1,204 |
| 35. | Glencoe | 7.98% | 1.94%(+6.04)#40 | 6.84%(+1.14)#1,205 |
| 36. | Columbia Heights | 7.88% | 1.94%(+5.94)#41 | 6.84%(+1.04)#1,206 |
| 37. | Willmar | 7.84% | 1.94%(+5.90)#42 | 6.84%(+1.000)#1,207 |
| 38. | Lynd | 7.78% | 1.94%(+5.84)#43 | 6.84%(+0.939)#1,208 |
| 39. | Lewiston | 7.69% | 1.94%(+5.75)#44 | 6.84%(+0.852)#1,209 |
| 40. | Bellechester | 7.54% | 1.94%(+5.60)#45 | 6.84%(+0.697)#1,210 |
| 41. | Austin | 7.39% | 1.94%(+5.44)#46 | 6.84%(+0.546)#1,286 |
| 42. | Upsala | 7.29% | 1.94%(+5.35)#47 | 6.84%(+0.453)#1,287 |
| 43. | Fairfax | 6.93% | 1.94%(+4.99)#48 | 6.84%(+0.088)#1,288 |
| 44. | Brooklyn Center | 6.86% | 1.94%(+4.92)#49 | 6.84%(+0.021)#1,289 |
| 45. | Oslo | 6.73% | 1.94%(+4.79)#50 | 6.84%(-0.113)#1,290 |
| 46. | Tintah | 6.67% | 1.94%(+4.73)#51 | 6.84%(-0.174)#1,291 |
| 47. | Hardwick | 6.43% | 1.94%(+4.49)#52 | 6.84%(-0.408)#1,292 |
| 48. | Stewart | 6.32% | 1.94%(+4.38)#53 | 6.84%(-0.523)#1,293 |
| 49. | Milan | 6.28% | 1.94%(+4.34)#54 | 6.84%(-0.559)#1,294 |
| 50. | Fridley | 6.24% | 1.94%(+4.30)#55 | 6.84%(-0.598)#1,295 |
| 51. | Montevideo | 6.09% | 1.94%(+4.15)#56 | 6.84%(-0.747)#1,296 |
| 52. | Magnolia | 6.06% | 1.94%(+4.12)#57 | 6.84%(-0.780)#1,297 |
| 53. | Murdock | 5.96% | 1.94%(+4.02)#58 | 6.84%(-0.876)#1,298 |
| 54. | Dumont | 5.76% | 1.94%(+3.81)#59 | 6.84%(-1.09)#1,299 |
| 55. | Freeport | 5.72% | 1.94%(+3.78)#60 | 6.84%(-1.12)#1,300 |
| 56. | Winthrop | 5.71% | 1.94%(+3.77)#61 | 6.84%(-1.13)#1,301 |
| 57. | Spring Lake Park | 5.70% | 1.94%(+3.76)#62 | 6.84%(-1.14)#1,302 |
| 58. | Sacred Heart | 5.70% | 1.94%(+3.75)#63 | 6.84%(-1.15)#1,303 |
| 59. | Windom | 5.64% | 1.94%(+3.70)#64 | 6.84%(-1.20)#1,304 |
| 60. | Kerkhoven | 5.62% | 1.94%(+3.67)#65 | 6.84%(-1.23)#1,305 |
| 61. | Sleepy Eye | 5.50% | 1.94%(+3.56)#66 | 6.84%(-1.34)#1,306 |
| 62. | Melrose | 5.46% | 1.94%(+3.52)#67 | 6.84%(-1.38)#1,307 |
| 63. | Cokato | 5.41% | 1.94%(+3.47)#68 | 6.84%(-1.43)#1,308 |
| 64. | Porter | 5.41% | 1.94%(+3.46)#69 | 6.84%(-1.44)#1,309 |
| 65. | Wilton | 5.37% | 1.94%(+3.43)#70 | 6.84%(-1.47)#1,310 |
| 66. | Green Isle | 5.01% | 1.94%(+3.07)#71 | 6.84%(-1.83)#1,311 |
| 67. | Newport | 5.00% | 1.94%(+3.05)#72 | 6.84%(-1.84)#1,312 |
| 68. | Goodhue | 4.96% | 1.94%(+3.02)#73 | 6.84%(-1.88)#1,313 |
| 69. | Dodge Center | 4.95% | 1.94%(+3.00)#74 | 6.84%(-1.90)#1,314 |
| 70. | Faribault | 4.88% | 1.94%(+2.94)#75 | 6.84%(-1.96)#1,315 |
| 71. | Sanborn | 4.86% | 1.94%(+2.92)#76 | 6.84%(-1.98)#1,316 |
| 72. | Roscoe | 4.81% | 1.94%(+2.87)#77 | 6.84%(-2.03)#1,317 |
| 73. | Lewisville | 4.76% | 1.94%(+2.82)#78 | 6.84%(-2.08)#1,318 |
| 74. | Greenwood | 4.72% | 1.94%(+2.78)#79 | 6.84%(-2.12)#1,319 |
| 75. | West St Paul | 4.63% | 1.94%(+2.68)#80 | 6.84%(-2.22)#1,320 |
| 76. | South St Paul | 4.59% | 1.94%(+2.65)#81 | 6.84%(-2.25)#1,321 |
| 77. | Norwood Young America | 4.44% | 1.94%(+2.50)#82 | 6.84%(-2.40)#1,322 |
| 78. | Burnsville | 4.39% | 1.94%(+2.44)#83 | 6.84%(-2.46)#1,323 |
| 79. | Lester Prairie | 4.38% | 1.94%(+2.44)#84 | 6.84%(-2.46)#1,324 |
| 80. | Morris | 4.28% | 1.94%(+2.34)#85 | 6.84%(-2.56)#1,325 |
| 81. | Shakopee | 4.23% | 1.94%(+2.29)#86 | 6.84%(-2.61)#1,326 |
| 82. | Buffalo Lake | 4.23% | 1.94%(+2.28)#87 | 6.84%(-2.62)#1,327 |
| 83. | Round Lake | 4.21% | 1.94%(+2.27)#88 | 6.84%(-2.63)#1,328 |
| 84. | New London | 4.19% | 1.94%(+2.25)#89 | 6.84%(-2.65)#1,329 |
| 85. | Winsted | 4.18% | 1.94%(+2.24)#90 | 6.84%(-2.66)#1,330 |
| 86. | Brownsdale | 4.14% | 1.94%(+2.20)#91 | 6.84%(-2.70)#1,331 |
| 87. | Maplewood | 4.13% | 1.94%(+2.18)#92 | 6.84%(-2.72)#2,936 |
| 88. | Excelsior | 4.08% | 1.94%(+2.13)#93 | 6.84%(-2.76)#2,937 |
| 89. | Monticello | 4.06% | 1.94%(+2.12)#94 | 6.84%(-2.78)#2,938 |
| 90. | Ellsworth | 4.05% | 1.94%(+2.11)#95 | 6.84%(-2.79)#2,939 |
| 91. | Arlington | 4.04% | 1.94%(+2.09)#96 | 6.84%(-2.80)#2,940 |
| 92. | Isanti | 4.03% | 1.94%(+2.09)#97 | 6.84%(-2.81)#2,941 |
| 93. | Winnebago | 4.02% | 1.94%(+2.07)#98 | 6.84%(-2.82)#2,942 |
| 94. | West Concord | 4.01% | 1.94%(+2.07)#99 | 6.84%(-2.83)#2,943 |
| 95. | Gibbon | 4.00% | 1.94%(+2.06)#100 | 6.84%(-2.84)#2,944 |
| 96. | Inver Grove Heights | 3.79% | 1.94%(+1.85)#101 | 6.84%(-3.05)#2,945 |
| 97. | Minneapolis | 3.77% | 1.94%(+1.83)#102 | 6.84%(-3.07)#2,946 |
| 98. | Albert Lea | 3.74% | 1.94%(+1.80)#103 | 6.84%(-3.10)#2,947 |
| 99. | Hamburg | 3.64% | 1.94%(+1.70)#104 | 6.84%(-3.20)#2,948 |
| 100. | Arden Hills | 3.60% | 1.94%(+1.66)#105 | 6.84%(-3.24)#2,949 |
Common Questions
What are the Top 10 Cities with the Highest Percentage of Immigrants from Latin America in Minnesota?
Top 10 Cities with the Highest Percentage of Immigrants from Latin America in Minnesota are:
What city has the Highest Percentage of Immigrants from Latin America in Minnesota?
Alpha has the Highest Percentage of Immigrants from Latin America in Minnesota with 42.98%.
What is the Percentage of Immigrants from Latin America in the State of Minnesota?
Percentage of Immigrants from Latin America in Minnesota is 1.94%.
What is the Percentage of Immigrants from Latin America in the United States?
Percentage of Immigrants from Latin America in the United States is 6.84%.