Cities with the Highest Percentage of Immigrants from Latin America in Connecticut
RELATED REPORTS & OPTIONS
Latin America
Connecticut
Compare Cities
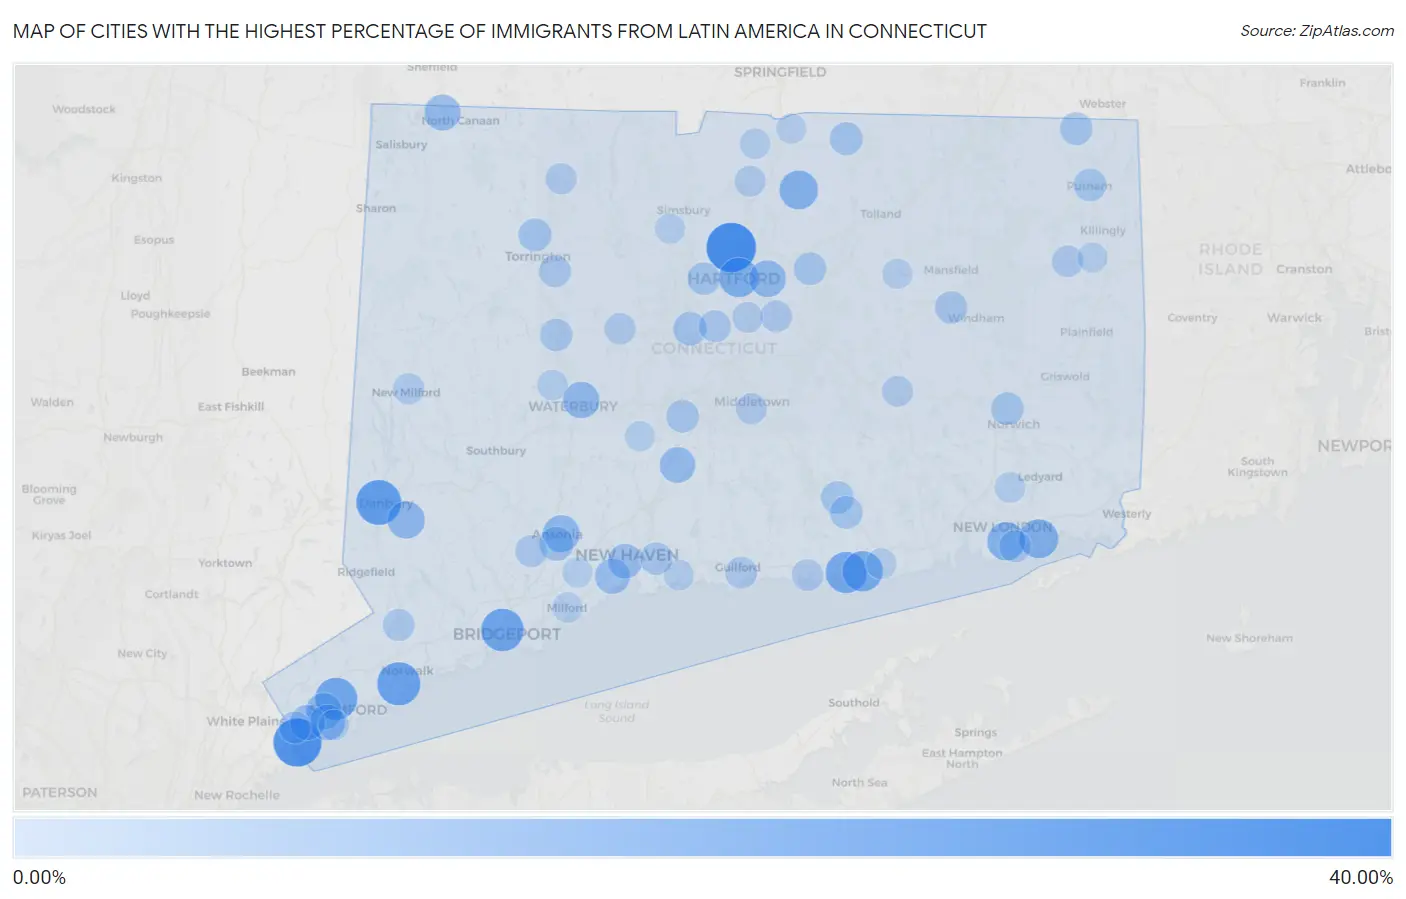
Map of Cities with the Highest Percentage of Immigrants from Latin America in Connecticut
0.00%
40.00%
Cities with the Highest Percentage of Immigrants from Latin America in Connecticut
| City | Latin America | vs State | vs National | |
| 1. | Blue Hills | 32.06% | 7.00%(+25.1)#-1 | 6.84%(+25.2)#0 |
| 2. | Byram | 29.90% | 7.00%(+22.9)#19 | 6.84%(+23.1)#1,719 |
| 3. | Danbury | 24.74% | 7.00%(+17.7)#24 | 6.84%(+17.9)#2,243 |
| 4. | Cornwall | 24.10% | 7.00%(+17.1)#25 | 6.84%(+17.3)#2,244 |
| 5. | Norwalk | 21.94% | 7.00%(+14.9)#26 | 6.84%(+15.1)#2,354 |
| 6. | Bridgeport | 21.10% | 7.00%(+14.1)#27 | 6.84%(+14.3)#2,355 |
| 7. | Stamford | 20.30% | 7.00%(+13.3)#31 | 6.84%(+13.5)#2,824 |
| 8. | Westbrook Center | 18.90% | 7.00%(+11.9)#32 | 6.84%(+12.1)#2,825 |
| 9. | Saybrook Manor | 17.63% | 7.00%(+10.6)#33 | 6.84%(+10.8)#2,826 |
| 10. | Hartford | 16.16% | 7.00%(+9.16)#34 | 6.84%(+9.32)#2,827 |
| 11. | Poquonock Bridge | 15.47% | 7.00%(+8.47)#35 | 6.84%(+8.63)#2,828 |
| 12. | Broad Brook | 14.88% | 7.00%(+7.88)#36 | 6.84%(+8.04)#2,829 |
| 13. | New London | 14.19% | 7.00%(+7.19)#37 | 6.84%(+7.35)#2,830 |
| 14. | Botsford | 14.19% | 7.00%(+7.19)#38 | 6.84%(+7.34)#2,831 |
| 15. | Bethel | 12.88% | 7.00%(+5.88)#39 | 6.84%(+6.04)#2,832 |
| 16. | Ansonia | 12.26% | 7.00%(+5.26)#40 | 6.84%(+5.42)#2,833 |
| 17. | East Hartford | 11.94% | 7.00%(+4.94)#41 | 6.84%(+5.10)#2,834 |
| 18. | Waterbury | 11.57% | 7.00%(+4.57)#42 | 6.84%(+4.73)#2,835 |
| 19. | Cos Cob | 11.42% | 7.00%(+4.42)#43 | 6.84%(+4.58)#2,836 |
| 20. | Sail Harbor | 11.19% | 7.00%(+4.19)#44 | 6.84%(+4.35)#2,837 |
| 21. | South Wilton | 11.06% | 7.00%(+4.07)#45 | 6.84%(+4.22)#2,838 |
| 22. | Canaan | 10.86% | 7.00%(+3.87)#46 | 6.84%(+4.02)#2,839 |
| 23. | Wallingford Center | 10.48% | 7.00%(+3.48)#47 | 6.84%(+3.64)#2,840 |
| 24. | Riverside | 10.44% | 7.00%(+3.44)#48 | 6.84%(+3.60)#2,841 |
| 25. | West Haven | 9.74% | 7.00%(+2.74)#49 | 6.84%(+2.90)#2,842 |
| 26. | Greenwich | 9.73% | 7.00%(+2.73)#50 | 6.84%(+2.89)#2,843 |
| 27. | New Haven | 8.70% | 7.00%(+1.70)#51 | 6.84%(+1.86)#2,844 |
| 28. | Naugatuck Borough | 8.31% | 7.00%(+1.31)#52 | 6.84%(+1.47)#2,845 |
| 29. | Trumbull Center | 8.09% | 7.00%(+1.09)#53 | 6.84%(+1.25)#2,846 |
| 30. | Derby | 8.00% | 7.00%(+1.00)#54 | 6.84%(+1.16)#2,847 |
| 31. | Pleasant Valley | 7.49% | 7.00%(+0.492)#55 | 6.84%(+0.651)#2,848 |
| 32. | New Britain | 7.15% | 7.00%(+0.148)#56 | 6.84%(+0.306)#2,849 |
| 33. | Torrington | 6.44% | 7.00%(-0.559)#57 | 6.84%(-0.400)#2,850 |
| 34. | Somers | 6.36% | 7.00%(-0.635)#58 | 6.84%(-0.476)#2,851 |
| 35. | Route 7 Gateway | 6.14% | 7.00%(-0.855)#59 | 6.84%(-0.696)#2,852 |
| 36. | Quinebaug | 6.13% | 7.00%(-0.868)#60 | 6.84%(-0.710)#2,853 |
| 37. | Chester Center | 6.07% | 7.00%(-0.927)#61 | 6.84%(-0.768)#2,854 |
| 38. | Putnam | 6.04% | 7.00%(-0.964)#62 | 6.84%(-0.805)#2,855 |
| 39. | Lakes East | 5.97% | 7.00%(-1.03)#63 | 6.84%(-0.870)#2,856 |
| 40. | Compo | 5.96% | 7.00%(-1.03)#64 | 6.84%(-0.876)#2,857 |
| 41. | Norwich | 5.94% | 7.00%(-1.06)#65 | 6.84%(-0.904)#2,888 |
| 42. | Deep River Center | 5.93% | 7.00%(-1.07)#66 | 6.84%(-0.915)#2,889 |
| 43. | West Hartford | 5.92% | 7.00%(-1.08)#67 | 6.84%(-0.921)#2,890 |
| 44. | Manchester | 5.87% | 7.00%(-1.13)#68 | 6.84%(-0.967)#2,891 |
| 45. | Willimantic | 5.58% | 7.00%(-1.42)#69 | 6.84%(-1.26)#2,892 |
| 46. | Meriden | 5.56% | 7.00%(-1.44)#70 | 6.84%(-1.28)#2,893 |
| 47. | East Haven | 5.54% | 7.00%(-1.46)#71 | 6.84%(-1.30)#2,894 |
| 48. | Thomaston | 5.46% | 7.00%(-1.54)#72 | 6.84%(-1.38)#2,895 |
| 49. | Old Hill | 5.15% | 7.00%(-1.85)#73 | 6.84%(-1.69)#2,896 |
| 50. | Shelton | 4.93% | 7.00%(-2.07)#74 | 6.84%(-1.91)#2,897 |
| 51. | Newington | 4.91% | 7.00%(-2.09)#75 | 6.84%(-1.93)#2,898 |
| 52. | Northwest Harwinton | 4.78% | 7.00%(-2.22)#76 | 6.84%(-2.06)#2,899 |
| 53. | Wilton Center | 4.75% | 7.00%(-2.25)#77 | 6.84%(-2.09)#2,900 |
| 54. | Groton | 4.71% | 7.00%(-2.29)#78 | 6.84%(-2.13)#2,901 |
| 55. | Pemberwick | 4.64% | 7.00%(-2.36)#79 | 6.84%(-2.20)#2,902 |
| 56. | Glastonbury Center | 4.45% | 7.00%(-2.55)#80 | 6.84%(-2.39)#2,903 |
| 57. | Guilford Center | 4.41% | 7.00%(-2.59)#81 | 6.84%(-2.43)#2,904 |
| 58. | Coleytown | 4.31% | 7.00%(-2.69)#82 | 6.84%(-2.53)#2,905 |
| 59. | Candlewood Orchards | 4.27% | 7.00%(-2.72)#83 | 6.84%(-2.57)#2,906 |
| 60. | Bridgewater | 4.23% | 7.00%(-2.77)#84 | 6.84%(-2.62)#2,907 |
| 61. | Brooklyn | 4.18% | 7.00%(-2.82)#85 | 6.84%(-2.66)#2,908 |
| 62. | Staples | 4.15% | 7.00%(-2.85)#86 | 6.84%(-2.69)#2,909 |
| 63. | Clinton | 4.08% | 7.00%(-2.92)#87 | 6.84%(-2.76)#2,910 |
| 64. | Bristol | 3.99% | 7.00%(-3.01)#88 | 6.84%(-2.85)#2,911 |
| 65. | New Milford | 3.85% | 7.00%(-3.15)#89 | 6.84%(-2.99)#2,912 |
| 66. | Lakes West | 3.83% | 7.00%(-3.17)#90 | 6.84%(-3.01)#2,913 |
| 67. | Winsted | 3.52% | 7.00%(-3.48)#91 | 6.84%(-3.32)#2,914 |
| 68. | Colchester | 3.43% | 7.00%(-3.57)#92 | 6.84%(-3.41)#2,915 |
| 69. | Middletown | 3.39% | 7.00%(-3.61)#93 | 6.84%(-3.45)#2,916 |
| 70. | Ball Pond | 3.36% | 7.00%(-3.64)#94 | 6.84%(-3.48)#2,917 |
| 71. | Taylor Corners | 3.36% | 7.00%(-3.64)#95 | 6.84%(-3.48)#2,918 |
| 72. | Noroton Heights | 3.29% | 7.00%(-3.71)#96 | 6.84%(-3.55)#2,919 |
| 73. | Windsor Locks | 3.22% | 7.00%(-3.78)#97 | 6.84%(-3.62)#2,920 |
| 74. | Murray | 3.11% | 7.00%(-3.89)#98 | 6.84%(-3.73)#2,921 |
| 75. | Oronoque | 3.05% | 7.00%(-3.95)#99 | 6.84%(-3.79)#2,922 |
| 76. | Danielson Borough | 2.98% | 7.00%(-4.02)#100 | 6.84%(-3.86)#2,923 |
| 77. | Wethersfield | 2.94% | 7.00%(-4.06)#101 | 6.84%(-3.90)#2,924 |
| 78. | Candlewood Shores | 2.90% | 7.00%(-4.10)#102 | 6.84%(-3.94)#2,925 |
| 79. | Weston | 2.89% | 7.00%(-4.11)#103 | 6.84%(-3.95)#2,926 |
| 80. | Gales Ferry | 2.88% | 7.00%(-4.12)#104 | 6.84%(-3.97)#2,927 |
| 81. | Newtown Borough | 2.86% | 7.00%(-4.14)#105 | 6.84%(-3.98)#2,928 |
| 82. | Old Saybrook Center | 2.73% | 7.00%(-4.27)#106 | 6.84%(-4.11)#2,929 |
| 83. | Old Greenwich | 2.69% | 7.00%(-4.31)#107 | 6.84%(-4.15)#2,930 |
| 84. | Greens Farms | 2.69% | 7.00%(-4.31)#108 | 6.84%(-4.15)#2,931 |
| 85. | Noroton | 2.55% | 7.00%(-4.45)#109 | 6.84%(-4.29)#2,932 |
| 86. | Oakville | 2.55% | 7.00%(-4.45)#110 | 6.84%(-4.29)#2,933 |
| 87. | Saugatuck | 2.53% | 7.00%(-4.47)#111 | 6.84%(-4.31)#2,934 |
| 88. | Branford Center | 2.53% | 7.00%(-4.47)#112 | 6.84%(-4.31)#2,935 |
| 89. | Suffield Depot | 2.44% | 7.00%(-4.56)#113 | 6.84%(-4.40)#2,936 |
| 90. | Bigelow Corners | 2.35% | 7.00%(-4.65)#114 | 6.84%(-4.49)#2,937 |
| 91. | Milford City Balance | 2.25% | 7.00%(-4.75)#115 | 6.84%(-4.59)#2,938 |
| 92. | Cheshire Village | 2.23% | 7.00%(-4.77)#116 | 6.84%(-4.61)#2,939 |
| 93. | Weatogue | 2.17% | 7.00%(-4.83)#117 | 6.84%(-4.67)#2,940 |
| 94. | East Brooklyn | 2.15% | 7.00%(-4.85)#118 | 6.84%(-4.70)#2,941 |
| 95. | Candlewood Isle | 2.14% | 7.00%(-4.86)#119 | 6.84%(-4.70)#2,942 |
| 96. | Orange | 2.11% | 7.00%(-4.89)#120 | 6.84%(-4.73)#2,943 |
| 97. | Stratford Downtown | 2.05% | 7.00%(-4.95)#121 | 6.84%(-4.79)#2,944 |
| 98. | Lordship | 2.00% | 7.00%(-5.00)#122 | 6.84%(-4.84)#2,945 |
| 99. | Sherwood Manor | 1.94% | 7.00%(-5.06)#123 | 6.84%(-4.90)#2,946 |
| 100. | Coventry Lake | 1.93% | 7.00%(-5.07)#124 | 6.84%(-4.91)#2,947 |
1
2Common Questions
What are the Top 10 Cities with the Highest Percentage of Immigrants from Latin America in Connecticut?
Top 10 Cities with the Highest Percentage of Immigrants from Latin America in Connecticut are:
#1
32.06%
#2
29.90%
#3
24.74%
#4
21.94%
#5
21.10%
#6
20.30%
#7
18.90%
#8
17.63%
#9
16.16%
#10
15.47%
What city has the Highest Percentage of Immigrants from Latin America in Connecticut?
Blue Hills has the Highest Percentage of Immigrants from Latin America in Connecticut with 32.06%.
What is the Percentage of Immigrants from Latin America in the State of Connecticut?
Percentage of Immigrants from Latin America in Connecticut is 7.00%.
What is the Percentage of Immigrants from Latin America in the United States?
Percentage of Immigrants from Latin America in the United States is 6.84%.