Cities with the Highest Percentage of Immigrants from Latin America in Ohio
RELATED REPORTS & OPTIONS
Latin America
Ohio
Compare Cities
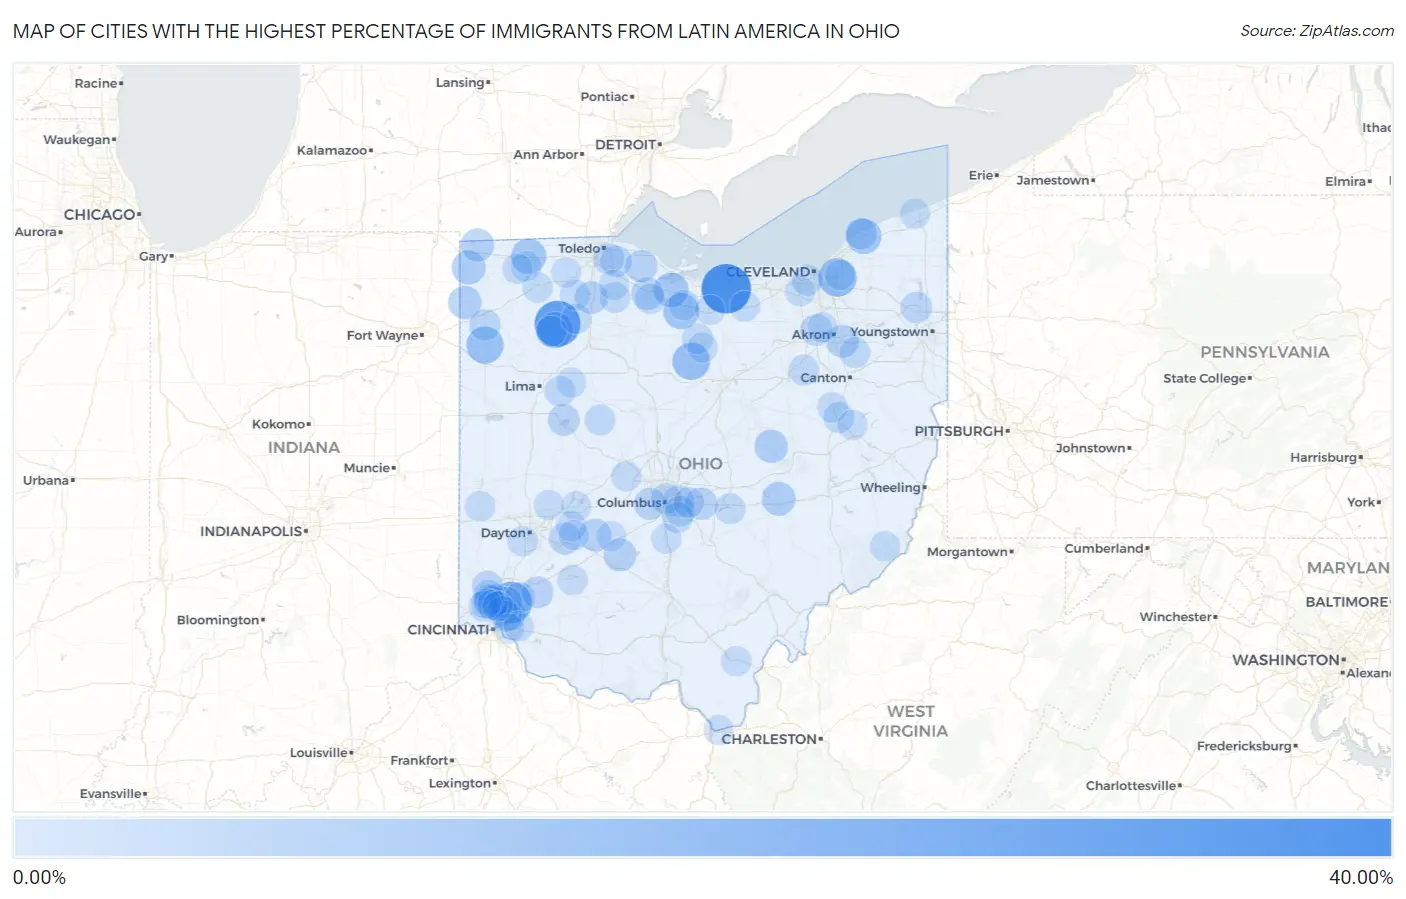
Map of Cities with the Highest Percentage of Immigrants from Latin America in Ohio
0.00%
40.00%
Cities with the Highest Percentage of Immigrants from Latin America in Ohio
| City | Latin America | vs State | vs National | |
| 1. | Mitiwanga | 36.55% | 0.97%(+35.6)#-1 | 6.84%(+29.7)#0 |
| 2. | Belmore | 29.79% | 0.97%(+28.8)#0 | 6.84%(+22.9)#1 |
| 3. | Brecon | 21.82% | 0.97%(+20.9)#1 | 6.84%(+15.0)#2 |
| 4. | Woodmere | 16.25% | 0.97%(+15.3)#2 | 6.84%(+9.41)#3 |
| 5. | Tiro | 14.46% | 0.97%(+13.5)#3 | 6.84%(+7.62)#4 |
| 6. | Haviland | 13.89% | 0.97%(+12.9)#4 | 6.84%(+7.05)#5 |
| 7. | Leipsic | 12.46% | 0.97%(+11.5)#5 | 6.84%(+5.62)#6 |
| 8. | Flat Rock | 11.95% | 0.97%(+11.0)#6 | 6.84%(+5.10)#7 |
| 9. | Painesville | 10.81% | 0.97%(+9.84)#47 | 6.84%(+3.97)#2,245 |
| 10. | Tedrow | 10.40% | 0.97%(+9.43)#48 | 6.84%(+3.56)#2,246 |
| 11. | Vickery | 9.66% | 0.97%(+8.70)#49 | 6.84%(+2.82)#2,247 |
| 12. | Blakeslee | 8.33% | 0.97%(+7.37)#50 | 6.84%(+1.49)#2,248 |
| 13. | North Zanesville | 8.20% | 0.97%(+7.24)#51 | 6.84%(+1.36)#2,249 |
| 14. | Springdale | 8.16% | 0.97%(+7.19)#52 | 6.84%(+1.32)#2,250 |
| 15. | Kenwood | 7.75% | 0.97%(+6.78)#53 | 6.84%(+0.906)#2,251 |
| 16. | Nellie | 7.41% | 0.97%(+6.44)#54 | 6.84%(+0.567)#2,252 |
| 17. | Forest Park | 7.10% | 0.97%(+6.14)#55 | 6.84%(+0.262)#2,253 |
| 18. | Hicksville | 7.06% | 0.97%(+6.10)#56 | 6.84%(+0.224)#2,254 |
| 19. | Lake Seneca | 6.79% | 0.97%(+5.83)#57 | 6.84%(-0.048)#2,255 |
| 20. | Bloomingburg | 6.39% | 0.97%(+5.43)#58 | 6.84%(-0.447)#2,256 |
| 21. | Sawyerwood | 6.37% | 0.97%(+5.41)#59 | 6.84%(-0.469)#2,257 |
| 22. | Ai | 6.37% | 0.97%(+5.40)#60 | 6.84%(-0.474)#2,258 |
| 23. | Portage | 6.29% | 0.97%(+5.33)#61 | 6.84%(-0.549)#2,259 |
| 24. | South Solon | 5.97% | 0.97%(+5.01)#62 | 6.84%(-0.867)#2,260 |
| 25. | Stony Prairie | 5.80% | 0.97%(+4.83)#63 | 6.84%(-1.04)#2,261 |
| 26. | Etna | 5.43% | 0.97%(+4.46)#64 | 6.84%(-1.41)#2,262 |
| 27. | Lincoln Village | 5.32% | 0.97%(+4.35)#65 | 6.84%(-1.52)#2,263 |
| 28. | Rocky Ridge | 5.26% | 0.97%(+4.30)#66 | 6.84%(-1.58)#2,264 |
| 29. | Wilberforce | 5.16% | 0.97%(+4.19)#67 | 6.84%(-1.68)#2,265 |
| 30. | Chippewa Park | 4.62% | 0.97%(+3.65)#68 | 6.84%(-2.23)#2,266 |
| 31. | Morrow | 4.58% | 0.97%(+3.61)#69 | 6.84%(-2.26)#2,267 |
| 32. | Pigeon Creek | 4.56% | 0.97%(+3.60)#70 | 6.84%(-2.28)#2,268 |
| 33. | Fairport Harbor | 4.19% | 0.97%(+3.23)#71 | 6.84%(-2.65)#2,269 |
| 34. | Madison Place | 4.18% | 0.97%(+3.22)#72 | 6.84%(-2.66)#2,270 |
| 35. | Millbury | 4.17% | 0.97%(+3.20)#73 | 6.84%(-2.67)#2,271 |
| 36. | Whitehall | 4.14% | 0.97%(+3.18)#74 | 6.84%(-2.70)#2,272 |
| 37. | Paulding | 4.01% | 0.97%(+3.05)#75 | 6.84%(-2.83)#2,273 |
| 38. | Morgandale | 3.97% | 0.97%(+3.00)#76 | 6.84%(-2.87)#2,274 |
| 39. | Sharonville | 3.94% | 0.97%(+2.97)#77 | 6.84%(-2.90)#2,275 |
| 40. | Walbridge | 3.84% | 0.97%(+2.87)#78 | 6.84%(-3.00)#2,276 |
| 41. | Hamilton | 3.39% | 0.97%(+2.42)#79 | 6.84%(-3.45)#2,277 |
| 42. | Willard | 3.33% | 0.97%(+2.36)#80 | 6.84%(-3.51)#2,278 |
| 43. | West Leipsic | 3.24% | 0.97%(+2.27)#81 | 6.84%(-3.60)#2,279 |
| 44. | Silverton | 3.17% | 0.97%(+2.21)#82 | 6.84%(-3.67)#2,280 |
| 45. | Thornport | 3.17% | 0.97%(+2.21)#83 | 6.84%(-3.67)#2,281 |
| 46. | Pleasant Run Farm | 3.16% | 0.97%(+2.20)#84 | 6.84%(-3.68)#2,282 |
| 47. | Brooklyn | 3.12% | 0.97%(+2.15)#85 | 6.84%(-3.72)#2,283 |
| 48. | Fairfield | 3.11% | 0.97%(+2.14)#86 | 6.84%(-3.73)#2,640 |
| 49. | Hartville | 3.10% | 0.97%(+2.14)#87 | 6.84%(-3.74)#2,641 |
| 50. | Miller | 2.99% | 0.97%(+2.02)#88 | 6.84%(-3.85)#2,642 |
| 51. | Columbus | 2.94% | 0.97%(+1.97)#89 | 6.84%(-3.90)#2,643 |
| 52. | Harrod | 2.89% | 0.97%(+1.93)#90 | 6.84%(-3.95)#2,644 |
| 53. | Orrville | 2.89% | 0.97%(+1.92)#91 | 6.84%(-3.95)#2,645 |
| 54. | Bradner | 2.83% | 0.97%(+1.86)#92 | 6.84%(-4.01)#2,646 |
| 55. | Groveport | 2.80% | 0.97%(+1.83)#93 | 6.84%(-4.04)#2,647 |
| 56. | Ridgeway | 2.75% | 0.97%(+1.78)#94 | 6.84%(-4.09)#2,648 |
| 57. | Dover | 2.74% | 0.97%(+1.78)#95 | 6.84%(-4.10)#2,649 |
| 58. | Blacklick Estates | 2.70% | 0.97%(+1.73)#96 | 6.84%(-4.14)#2,650 |
| 59. | Kipton | 2.63% | 0.97%(+1.67)#97 | 6.84%(-4.21)#2,651 |
| 60. | Landen | 2.60% | 0.97%(+1.64)#98 | 6.84%(-4.24)#2,652 |
| 61. | Reynoldsburg | 2.59% | 0.97%(+1.63)#99 | 6.84%(-4.25)#2,932 |
| 62. | Northgate | 2.55% | 0.97%(+1.59)#100 | 6.84%(-4.29)#2,933 |
| 63. | Strasburg | 2.52% | 0.97%(+1.55)#101 | 6.84%(-4.32)#2,934 |
| 64. | Reading | 2.52% | 0.97%(+1.55)#102 | 6.84%(-4.32)#2,935 |
| 65. | Castine | 2.48% | 0.97%(+1.51)#103 | 6.84%(-4.36)#2,936 |
| 66. | Ballville | 2.45% | 0.97%(+1.48)#104 | 6.84%(-4.39)#2,937 |
| 67. | Napoleon | 2.44% | 0.97%(+1.47)#105 | 6.84%(-4.40)#2,938 |
| 68. | Bellevue | 2.31% | 0.97%(+1.35)#106 | 6.84%(-4.53)#2,939 |
| 69. | Weston | 2.28% | 0.97%(+1.31)#107 | 6.84%(-4.56)#2,940 |
| 70. | Pettisville | 2.27% | 0.97%(+1.31)#108 | 6.84%(-4.57)#2,941 |
| 71. | Greenhills | 2.27% | 0.97%(+1.30)#109 | 6.84%(-4.57)#2,942 |
| 72. | Pepper Pike | 2.21% | 0.97%(+1.25)#110 | 6.84%(-4.63)#2,943 |
| 73. | Hoytville | 2.17% | 0.97%(+1.21)#111 | 6.84%(-4.67)#2,944 |
| 74. | Unionville Center | 2.17% | 0.97%(+1.20)#112 | 6.84%(-4.67)#2,945 |
| 75. | Archbold | 2.14% | 0.97%(+1.17)#113 | 6.84%(-4.70)#2,946 |
| 76. | Clifton | 2.13% | 0.97%(+1.16)#114 | 6.84%(-4.71)#2,947 |
| 77. | Antioch | 2.13% | 0.97%(+1.16)#115 | 6.84%(-4.71)#2,948 |
| 78. | Ada | 2.12% | 0.97%(+1.16)#116 | 6.84%(-4.72)#2,949 |
| 79. | Rio Grande | 2.10% | 0.97%(+1.14)#117 | 6.84%(-4.74)#2,950 |
| 80. | Ashtabula | 2.09% | 0.97%(+1.13)#118 | 6.84%(-4.75)#2,951 |
| 81. | Neapolis | 2.07% | 0.97%(+1.11)#119 | 6.84%(-4.77)#2,952 |
| 82. | Mount Healthy Heights | 2.04% | 0.97%(+1.07)#120 | 6.84%(-4.80)#2,953 |
| 83. | Turpin Hills | 2.04% | 0.97%(+1.07)#121 | 6.84%(-4.80)#2,954 |
| 84. | Norwalk | 2.02% | 0.97%(+1.05)#122 | 6.84%(-4.82)#2,955 |
| 85. | Wilmington | 1.98% | 0.97%(+1.01)#123 | 6.84%(-4.86)#2,956 |
| 86. | New Carlisle | 1.97% | 0.97%(+1.01)#124 | 6.84%(-4.87)#2,957 |
| 87. | Springfield | 1.96% | 0.97%(+0.989)#125 | 6.84%(-4.88)#2,958 |
| 88. | Midway | 1.95% | 0.97%(+0.979)#126 | 6.84%(-4.90)#2,959 |
| 89. | Cedarville | 1.94% | 0.97%(+0.975)#127 | 6.84%(-4.90)#2,960 |
| 90. | Pemberville | 1.91% | 0.97%(+0.948)#128 | 6.84%(-4.93)#2,961 |
| 91. | Summerside | 1.90% | 0.97%(+0.938)#129 | 6.84%(-4.94)#2,962 |
| 92. | Fairlawn | 1.88% | 0.97%(+0.917)#130 | 6.84%(-4.96)#2,963 |
| 93. | Moraine | 1.88% | 0.97%(+0.915)#131 | 6.84%(-4.96)#2,964 |
| 94. | Bass Lake | 1.85% | 0.97%(+0.888)#132 | 6.84%(-4.99)#2,965 |
| 95. | Roswell | 1.84% | 0.97%(+0.877)#133 | 6.84%(-5.00)#2,966 |
| 96. | South Bloomfield | 1.83% | 0.97%(+0.864)#134 | 6.84%(-5.01)#2,967 |
| 97. | Middleburg Heights | 1.82% | 0.97%(+0.849)#135 | 6.84%(-5.03)#2,968 |
| 98. | Woodlawn | 1.81% | 0.97%(+0.846)#136 | 6.84%(-5.03)#2,969 |
| 99. | Plymouth | 1.79% | 0.97%(+0.823)#137 | 6.84%(-5.05)#2,970 |
| 100. | Burlington | 1.76% | 0.97%(+0.796)#138 | 6.84%(-5.08)#2,971 |
Common Questions
What are the Top 10 Cities with the Highest Percentage of Immigrants from Latin America in Ohio?
Top 10 Cities with the Highest Percentage of Immigrants from Latin America in Ohio are:
What city has the Highest Percentage of Immigrants from Latin America in Ohio?
Mitiwanga has the Highest Percentage of Immigrants from Latin America in Ohio with 36.55%.
What is the Percentage of Immigrants from Latin America in the State of Ohio?
Percentage of Immigrants from Latin America in Ohio is 0.97%.
What is the Percentage of Immigrants from Latin America in the United States?
Percentage of Immigrants from Latin America in the United States is 6.84%.