Cities with the Highest Percentage of Immigrants from Latin America in Oklahoma
RELATED REPORTS & OPTIONS
Latin America
Oklahoma
Compare Cities
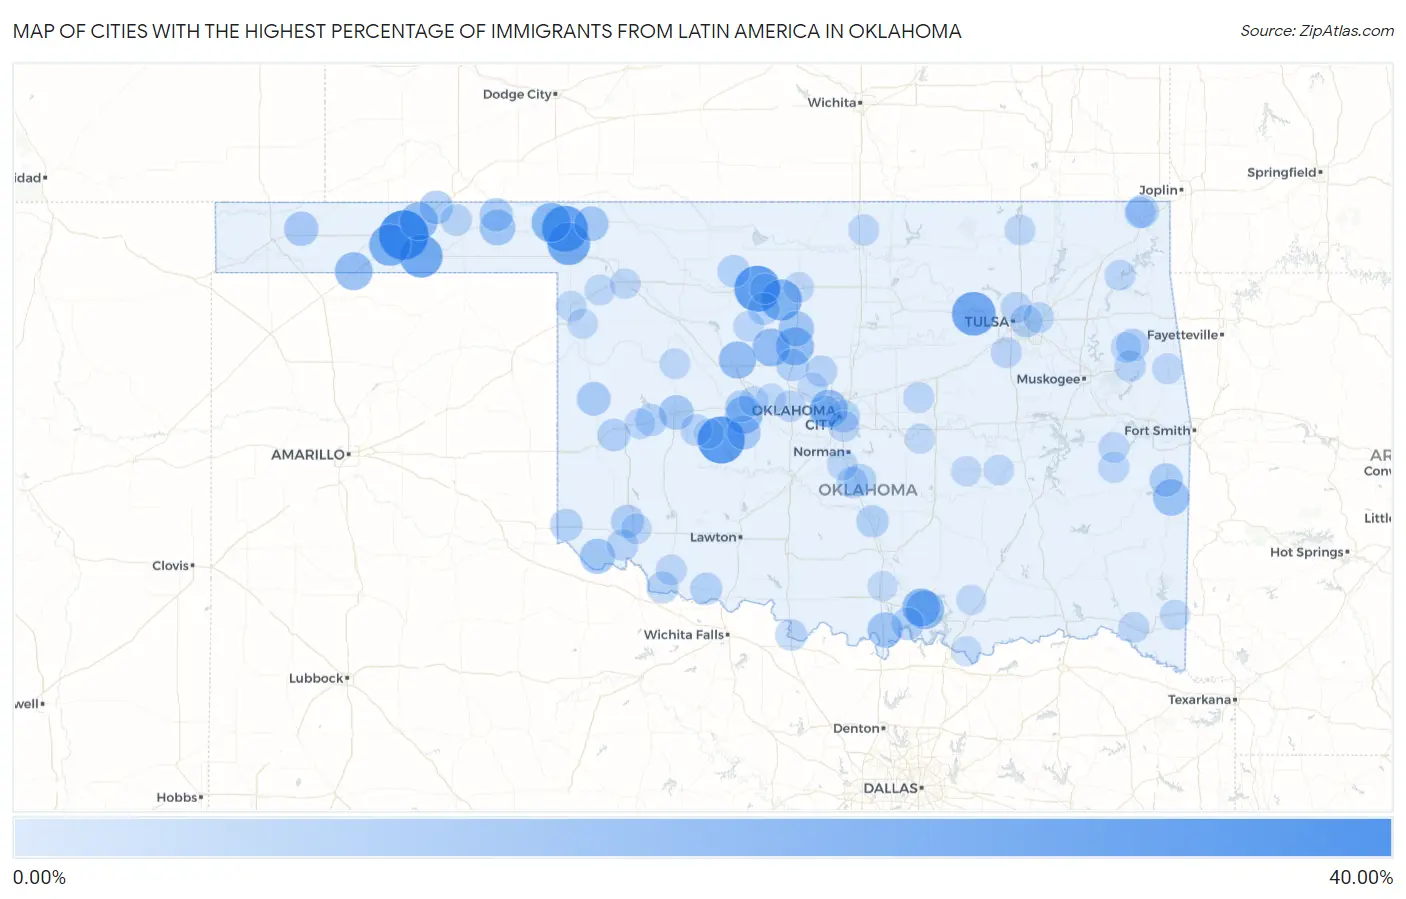
Map of Cities with the Highest Percentage of Immigrants from Latin America in Oklahoma
0.00%
40.00%
Cities with the Highest Percentage of Immigrants from Latin America in Oklahoma
| City | Latin America | vs State | vs National | |
| 1. | Optima | 39.24% | 3.45%(+35.8)#-1 | 6.84%(+32.4)#0 |
| 2. | Baker | 35.05% | 3.45%(+31.6)#0 | 6.84%(+28.2)#1 |
| 3. | Eakly | 34.57% | 3.45%(+31.1)#1 | 6.84%(+27.7)#2 |
| 4. | Ringwood | 32.71% | 3.45%(+29.3)#2 | 6.84%(+25.9)#3 |
| 5. | Rosston | 32.26% | 3.45%(+28.8)#3 | 6.84%(+25.4)#4 |
| 6. | Oak Grove | 28.12% | 3.45%(+24.7)#4 | 6.84%(+21.3)#5 |
| 7. | Hardesty | 26.54% | 3.45%(+23.1)#5 | 6.84%(+19.7)#6 |
| 8. | Little Ponderosa | 26.02% | 3.45%(+22.6)#6 | 6.84%(+19.2)#7 |
| 9. | Laverne | 25.99% | 3.45%(+22.5)#7 | 6.84%(+19.1)#8 |
| 10. | Guymon | 24.23% | 3.45%(+20.8)#8 | 6.84%(+17.4)#9 |
| 11. | Drummond | 23.54% | 3.45%(+20.1)#9 | 6.84%(+16.7)#10 |
| 12. | Adams | 21.29% | 3.45%(+17.8)#10 | 6.84%(+14.4)#11 |
| 13. | Gate | 20.00% | 3.45%(+16.5)#11 | 6.84%(+13.2)#12 |
| 14. | Dixon | 18.45% | 3.45%(+15.0)#12 | 6.84%(+11.6)#13 |
| 15. | Madill | 18.35% | 3.45%(+14.9)#13 | 6.84%(+11.5)#14 |
| 16. | Hooker | 17.55% | 3.45%(+14.1)#14 | 6.84%(+10.7)#15 |
| 17. | Oakland | 17.37% | 3.45%(+13.9)#15 | 6.84%(+10.5)#16 |
| 18. | Dover | 17.36% | 3.45%(+13.9)#16 | 6.84%(+10.5)#17 |
| 19. | Warr Acres | 17.27% | 3.45%(+13.8)#27 | 6.84%(+10.4)#1,886 |
| 20. | Texhoma | 17.22% | 3.45%(+13.8)#28 | 6.84%(+10.4)#1,887 |
| 21. | Loyal | 16.96% | 3.45%(+13.5)#29 | 6.84%(+10.1)#1,888 |
| 22. | Hinton | 16.73% | 3.45%(+13.3)#30 | 6.84%(+9.89)#1,889 |
| 23. | Watonga | 16.14% | 3.45%(+12.7)#31 | 6.84%(+9.30)#1,890 |
| 24. | Heavener | 14.48% | 3.45%(+11.0)#32 | 6.84%(+7.63)#1,891 |
| 25. | Beaver | 13.39% | 3.45%(+9.93)#33 | 6.84%(+6.55)#1,892 |
| 26. | Hennessey | 12.63% | 3.45%(+9.17)#34 | 6.84%(+5.79)#1,893 |
| 27. | Marietta | 12.41% | 3.45%(+8.96)#35 | 6.84%(+5.57)#1,894 |
| 28. | Eldorado | 12.20% | 3.45%(+8.75)#36 | 6.84%(+5.36)#1,895 |
| 29. | Buffalo | 11.55% | 3.45%(+8.09)#37 | 6.84%(+4.71)#1,896 |
| 30. | Clinton | 11.28% | 3.45%(+7.83)#38 | 6.84%(+4.44)#1,897 |
| 31. | Durham | 10.81% | 3.45%(+7.36)#39 | 6.84%(+3.97)#1,898 |
| 32. | Keyes | 10.75% | 3.45%(+7.30)#40 | 6.84%(+3.91)#1,899 |
| 33. | Lookeba | 10.23% | 3.45%(+6.77)#41 | 6.84%(+3.39)#1,900 |
| 34. | Cheyenne | 9.67% | 3.45%(+6.22)#42 | 6.84%(+2.83)#1,901 |
| 35. | Tyrone | 9.52% | 3.45%(+6.07)#43 | 6.84%(+2.68)#1,902 |
| 36. | Forgan | 9.09% | 3.45%(+5.64)#44 | 6.84%(+2.25)#1,903 |
| 37. | Poteau | 8.83% | 3.45%(+5.38)#45 | 6.84%(+1.99)#1,904 |
| 38. | Martha | 8.66% | 3.45%(+5.21)#46 | 6.84%(+1.82)#1,905 |
| 39. | Commerce | 8.17% | 3.45%(+4.71)#47 | 6.84%(+1.33)#1,906 |
| 40. | Lebanon | 8.02% | 3.45%(+4.56)#48 | 6.84%(+1.18)#1,907 |
| 41. | Steely Hollow | 7.75% | 3.45%(+4.30)#49 | 6.84%(+0.911)#1,908 |
| 42. | Kingfisher | 7.72% | 3.45%(+4.27)#50 | 6.84%(+0.881)#1,909 |
| 43. | Elk City | 7.72% | 3.45%(+4.26)#51 | 6.84%(+0.876)#1,910 |
| 44. | Pauls Valley | 7.49% | 3.45%(+4.04)#52 | 6.84%(+0.654)#1,911 |
| 45. | Aline | 7.39% | 3.45%(+3.93)#53 | 6.84%(+0.548)#1,912 |
| 46. | Hollis | 7.22% | 3.45%(+3.76)#54 | 6.84%(+0.376)#1,913 |
| 47. | Oklahoma City | 7.11% | 3.45%(+3.66)#55 | 6.84%(+0.273)#2,951 |
| 48. | Lexington | 7.02% | 3.45%(+3.57)#56 | 6.84%(+0.179)#2,952 |
| 49. | Foss | 7.01% | 3.45%(+3.55)#57 | 6.84%(+0.166)#2,953 |
| 50. | Tulsa | 6.94% | 3.45%(+3.48)#58 | 6.84%(+0.095)#2,954 |
| 51. | Grandfield | 6.91% | 3.45%(+3.45)#59 | 6.84%(+0.067)#2,955 |
| 52. | Ames | 6.90% | 3.45%(+3.44)#60 | 6.84%(+0.056)#2,956 |
| 53. | Bethany | 6.79% | 3.45%(+3.34)#61 | 6.84%(-0.046)#2,957 |
| 54. | Davidson | 6.48% | 3.45%(+3.02)#62 | 6.84%(-0.363)#2,958 |
| 55. | Bridgeport | 6.40% | 3.45%(+2.95)#63 | 6.84%(-0.441)#2,959 |
| 56. | Terral | 6.13% | 3.45%(+2.68)#64 | 6.84%(-0.706)#2,960 |
| 57. | Purcell | 6.05% | 3.45%(+2.59)#65 | 6.84%(-0.794)#2,961 |
| 58. | Corn | 5.99% | 3.45%(+2.54)#66 | 6.84%(-0.851)#2,962 |
| 59. | Olustee | 5.92% | 3.45%(+2.46)#67 | 6.84%(-0.923)#2,963 |
| 60. | Cashion | 5.91% | 3.45%(+2.46)#68 | 6.84%(-0.927)#2,964 |
| 61. | Park Hill | 5.88% | 3.45%(+2.43)#69 | 6.84%(-0.958)#2,965 |
| 62. | Turpin | 5.84% | 3.45%(+2.38)#70 | 6.84%(-1.01)#2,966 |
| 63. | North Miami | 5.52% | 3.45%(+2.06)#71 | 6.84%(-1.32)#2,967 |
| 64. | El Reno | 5.43% | 3.45%(+1.98)#72 | 6.84%(-1.41)#2,968 |
| 65. | Valley Brook | 5.21% | 3.45%(+1.76)#73 | 6.84%(-1.63)#2,969 |
| 66. | Turley | 5.11% | 3.45%(+1.65)#74 | 6.84%(-1.73)#2,970 |
| 67. | Kiefer | 4.90% | 3.45%(+1.45)#75 | 6.84%(-1.94)#2,971 |
| 68. | Blackwell | 4.89% | 3.45%(+1.44)#76 | 6.84%(-1.95)#2,972 |
| 69. | Sparks | 4.84% | 3.45%(+1.38)#77 | 6.84%(-2.00)#2,973 |
| 70. | Frederick | 4.68% | 3.45%(+1.22)#78 | 6.84%(-2.16)#2,974 |
| 71. | Lequire | 4.58% | 3.45%(+1.13)#79 | 6.84%(-2.26)#2,975 |
| 72. | Catoosa | 4.57% | 3.45%(+1.12)#80 | 6.84%(-2.27)#2,976 |
| 73. | Stilwell | 4.56% | 3.45%(+1.10)#81 | 6.84%(-2.29)#2,977 |
| 74. | Garvin | 4.55% | 3.45%(+1.09)#82 | 6.84%(-2.30)#2,978 |
| 75. | Fargo | 4.50% | 3.45%(+1.05)#83 | 6.84%(-2.34)#2,979 |
| 76. | Stigler | 4.47% | 3.45%(+1.01)#84 | 6.84%(-2.37)#2,980 |
| 77. | Langley | 4.38% | 3.45%(+0.924)#85 | 6.84%(-2.46)#2,981 |
| 78. | Goldsby | 4.37% | 3.45%(+0.919)#86 | 6.84%(-2.47)#2,982 |
| 79. | Putnam | 4.35% | 3.45%(+0.893)#87 | 6.84%(-2.49)#2,983 |
| 80. | Grandview | 4.25% | 3.45%(+0.795)#88 | 6.84%(-2.59)#2,984 |
| 81. | Altus | 4.23% | 3.45%(+0.778)#89 | 6.84%(-2.61)#2,985 |
| 82. | Okeene | 4.21% | 3.45%(+0.760)#90 | 6.84%(-2.63)#2,986 |
| 83. | Dewey | 4.20% | 3.45%(+0.748)#91 | 6.84%(-2.64)#2,987 |
| 84. | Shattuck | 4.12% | 3.45%(+0.666)#92 | 6.84%(-2.72)#2,988 |
| 85. | Woodward | 4.04% | 3.45%(+0.581)#93 | 6.84%(-2.80)#2,989 |
| 86. | Canute | 4.02% | 3.45%(+0.562)#94 | 6.84%(-2.82)#2,990 |
| 87. | Lamar | 4.00% | 3.45%(+0.546)#95 | 6.84%(-2.84)#2,991 |
| 88. | Enid | 4.00% | 3.45%(+0.543)#96 | 6.84%(-2.84)#2,992 |
| 89. | Meno | 3.98% | 3.45%(+0.528)#97 | 6.84%(-2.86)#2,993 |
| 90. | Arnett | 3.75% | 3.45%(+0.298)#98 | 6.84%(-3.09)#2,994 |
| 91. | Eagletown | 3.75% | 3.45%(+0.296)#99 | 6.84%(-3.09)#2,995 |
| 92. | Holdenville | 3.73% | 3.45%(+0.274)#100 | 6.84%(-3.11)#2,996 |
| 93. | Piedmont | 3.53% | 3.45%(+0.072)#101 | 6.84%(-3.31)#2,997 |
| 94. | Calumet | 3.45% | 3.45%(-0.006)#102 | 6.84%(-3.39)#2,998 |
| 95. | Earlsboro | 3.43% | 3.45%(-0.020)#103 | 6.84%(-3.41)#2,999 |
| 96. | Kenefic | 3.42% | 3.45%(-0.030)#104 | 6.84%(-3.42)#3,000 |
| 97. | Geary | 3.40% | 3.45%(-0.055)#105 | 6.84%(-3.44)#3,001 |
| 98. | Ardmore | 3.36% | 3.45%(-0.093)#106 | 6.84%(-3.48)#3,002 |
| 99. | Hendrix | 3.33% | 3.45%(-0.121)#107 | 6.84%(-3.51)#3,003 |
| 100. | Colony | 3.31% | 3.45%(-0.143)#108 | 6.84%(-3.53)#3,004 |
Common Questions
What are the Top 10 Cities with the Highest Percentage of Immigrants from Latin America in Oklahoma?
Top 10 Cities with the Highest Percentage of Immigrants from Latin America in Oklahoma are:
What city has the Highest Percentage of Immigrants from Latin America in Oklahoma?
Optima has the Highest Percentage of Immigrants from Latin America in Oklahoma with 39.24%.
What is the Percentage of Immigrants from Latin America in the State of Oklahoma?
Percentage of Immigrants from Latin America in Oklahoma is 3.45%.
What is the Percentage of Immigrants from Latin America in the United States?
Percentage of Immigrants from Latin America in the United States is 6.84%.