Cities with the Highest Percentage of Immigrants from Latin America in New York
RELATED REPORTS & OPTIONS
Latin America
New York
Compare Cities
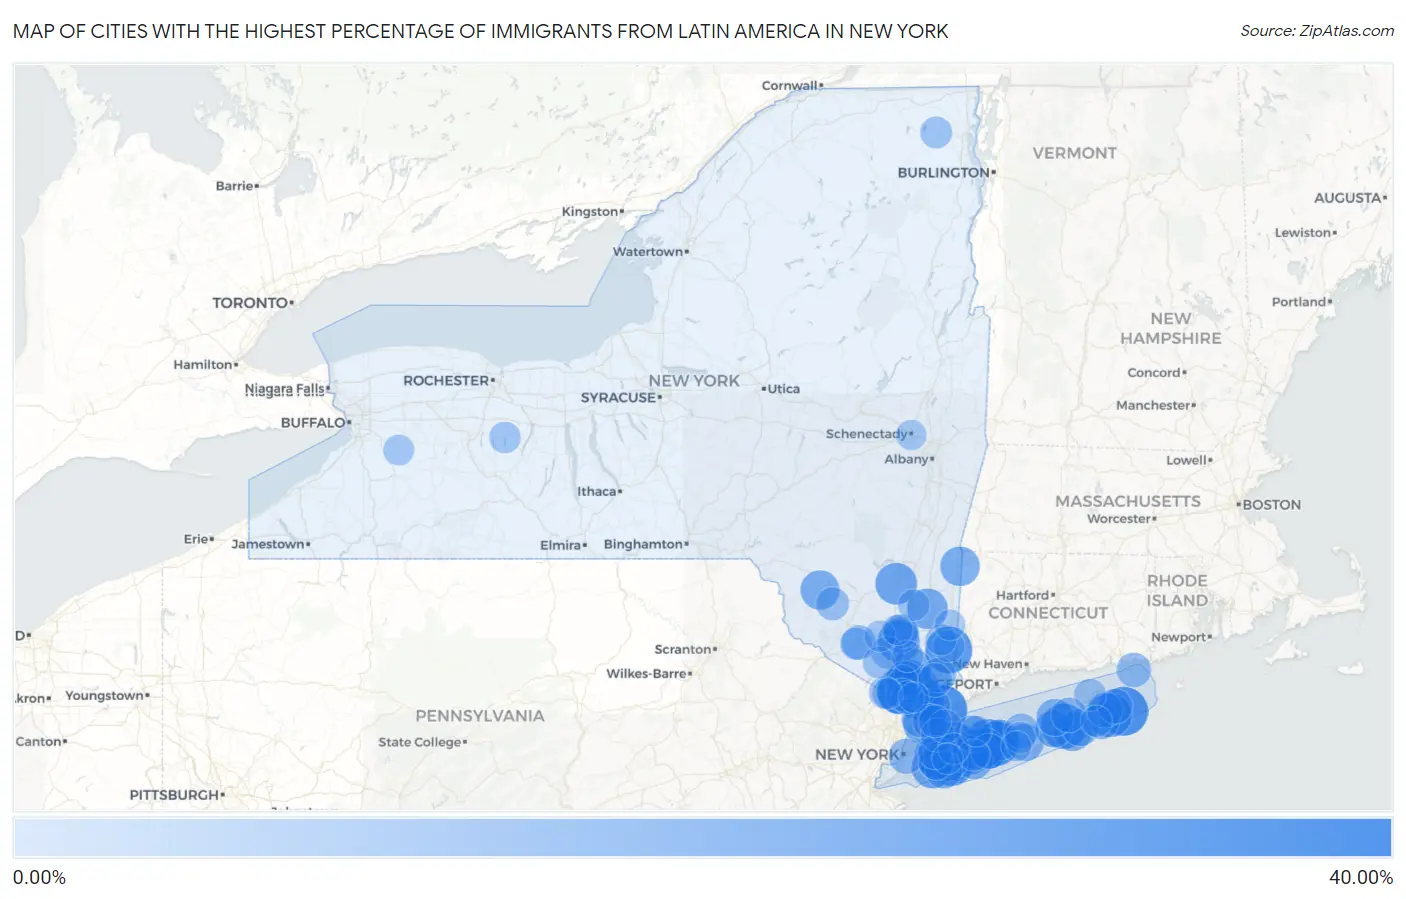
Map of Cities with the Highest Percentage of Immigrants from Latin America in New York
0.00%
40.00%
Cities with the Highest Percentage of Immigrants from Latin America in New York
| City | Latin America | vs State | vs National | |
| 1. | Port Chester | 38.59% | 10.92%(+27.7)#113 | 6.84%(+31.8)#2,301 |
| 2. | Brentwood | 38.02% | 10.92%(+27.1)#114 | 6.84%(+31.2)#2,302 |
| 3. | Napeague | 37.66% | 10.92%(+26.7)#115 | 6.84%(+30.8)#2,303 |
| 4. | New Cassel | 36.94% | 10.92%(+26.0)#116 | 6.84%(+30.1)#2,304 |
| 5. | Hempstead | 35.96% | 10.92%(+25.0)#148 | 6.84%(+29.1)#3,107 |
| 6. | Brewster | 34.92% | 10.92%(+24.0)#149 | 6.84%(+28.1)#3,108 |
| 7. | Roosevelt | 34.41% | 10.92%(+23.5)#150 | 6.84%(+27.6)#3,109 |
| 8. | Hillcrest | 33.70% | 10.92%(+22.8)#151 | 6.84%(+26.9)#3,110 |
| 9. | Flanders | 32.82% | 10.92%(+21.9)#152 | 6.84%(+26.0)#3,111 |
| 10. | Uniondale | 32.37% | 10.92%(+21.5)#153 | 6.84%(+25.5)#3,112 |
| 11. | Elmont | 32.04% | 10.92%(+21.1)#154 | 6.84%(+25.2)#3,113 |
| 12. | North Bay Shore | 31.92% | 10.92%(+21.0)#155 | 6.84%(+25.1)#3,114 |
| 13. | Central Islip | 31.91% | 10.92%(+21.0)#156 | 6.84%(+25.1)#3,115 |
| 14. | Freeport | 31.52% | 10.92%(+20.6)#157 | 6.84%(+24.7)#3,183 |
| 15. | Sleepy Hollow | 31.38% | 10.92%(+20.5)#158 | 6.84%(+24.5)#3,184 |
| 16. | East Hampton North | 30.86% | 10.92%(+19.9)#159 | 6.84%(+24.0)#3,185 |
| 17. | South Floral Park | 29.41% | 10.92%(+18.5)#160 | 6.84%(+22.6)#3,186 |
| 18. | Haverstraw | 29.39% | 10.92%(+18.5)#161 | 6.84%(+22.6)#3,187 |
| 19. | Spring Valley | 28.54% | 10.92%(+17.6)#162 | 6.84%(+21.7)#3,188 |
| 20. | Vails Gate | 27.98% | 10.92%(+17.1)#163 | 6.84%(+21.1)#3,189 |
| 21. | Tillson | 27.44% | 10.92%(+16.5)#164 | 6.84%(+20.6)#3,190 |
| 22. | Inwood | 27.38% | 10.92%(+16.5)#165 | 6.84%(+20.5)#3,191 |
| 23. | North Valley Stream | 26.63% | 10.92%(+15.7)#166 | 6.84%(+19.8)#3,192 |
| 24. | Mount Vernon | 26.62% | 10.92%(+15.7)#167 | 6.84%(+19.8)#3,193 |
| 25. | Islandia | 26.51% | 10.92%(+15.6)#168 | 6.84%(+19.7)#3,194 |
| 26. | Wyandanch | 26.31% | 10.92%(+15.4)#169 | 6.84%(+19.5)#3,195 |
| 27. | Freedom Plains | 25.74% | 10.92%(+14.8)#170 | 6.84%(+18.9)#3,196 |
| 28. | Elmsford | 24.52% | 10.92%(+13.6)#171 | 6.84%(+17.7)#3,197 |
| 29. | Lakeview | 24.28% | 10.92%(+13.4)#172 | 6.84%(+17.4)#3,198 |
| 30. | Millerton | 24.13% | 10.92%(+13.2)#173 | 6.84%(+17.3)#3,199 |
| 31. | Baywood | 24.09% | 10.92%(+13.2)#174 | 6.84%(+17.3)#3,200 |
| 32. | Hampton Bays | 24.05% | 10.92%(+13.1)#175 | 6.84%(+17.2)#3,201 |
| 33. | Liberty | 23.76% | 10.92%(+12.8)#176 | 6.84%(+16.9)#3,202 |
| 34. | Ossining | 23.73% | 10.92%(+12.8)#177 | 6.84%(+16.9)#3,203 |
| 35. | Valley Stream | 23.04% | 10.92%(+12.1)#178 | 6.84%(+16.2)#3,204 |
| 36. | Peekskill | 22.73% | 10.92%(+11.8)#179 | 6.84%(+15.9)#3,205 |
| 37. | Westbury | 22.67% | 10.92%(+11.7)#180 | 6.84%(+15.8)#3,206 |
| 38. | North Amityville | 22.52% | 10.92%(+11.6)#181 | 6.84%(+15.7)#3,207 |
| 39. | West Haverstraw | 22.18% | 10.92%(+11.3)#182 | 6.84%(+15.3)#3,208 |
| 40. | Copiague | 22.14% | 10.92%(+11.2)#183 | 6.84%(+15.3)#3,209 |
| 41. | North Bellport | 21.15% | 10.92%(+10.2)#184 | 6.84%(+14.3)#3,210 |
| 42. | Northampton | 21.14% | 10.92%(+10.2)#185 | 6.84%(+14.3)#3,211 |
| 43. | Shinnecock Hills | 21.12% | 10.92%(+10.2)#186 | 6.84%(+14.3)#3,212 |
| 44. | Riverhead | 20.98% | 10.92%(+10.1)#187 | 6.84%(+14.1)#3,213 |
| 45. | Baldwin | 20.89% | 10.92%(+9.97)#188 | 6.84%(+14.0)#3,214 |
| 46. | Island Park | 20.70% | 10.92%(+9.78)#189 | 6.84%(+13.9)#3,215 |
| 47. | Yonkers | 20.10% | 10.92%(+9.18)#190 | 6.84%(+13.3)#3,216 |
| 48. | Huntington Station | 19.64% | 10.92%(+8.72)#191 | 6.84%(+12.8)#3,217 |
| 49. | Sagaponack | 19.19% | 10.92%(+8.27)#192 | 6.84%(+12.3)#3,218 |
| 50. | White Plains | 18.92% | 10.92%(+8.00)#193 | 6.84%(+12.1)#3,219 |
| 51. | Fairview Cdp Westchester County | 18.85% | 10.92%(+7.93)#194 | 6.84%(+12.0)#3,220 |
| 52. | Newburgh | 18.28% | 10.92%(+7.36)#195 | 6.84%(+11.4)#3,221 |
| 53. | Bay Shore | 18.27% | 10.92%(+7.35)#196 | 6.84%(+11.4)#3,222 |
| 54. | Gordon Heights | 18.23% | 10.92%(+7.31)#197 | 6.84%(+11.4)#3,223 |
| 55. | New York | 18.08% | 10.92%(+7.16)#198 | 6.84%(+11.2)#3,224 |
| 56. | Northwest Harbor | 18.07% | 10.92%(+7.15)#199 | 6.84%(+11.2)#3,225 |
| 57. | Springs | 17.82% | 10.92%(+6.90)#200 | 6.84%(+11.0)#3,226 |
| 58. | Laurel | 17.65% | 10.92%(+6.73)#201 | 6.84%(+10.8)#3,227 |
| 59. | South Valley Stream | 17.63% | 10.92%(+6.71)#202 | 6.84%(+10.8)#3,228 |
| 60. | Bedford Hills | 17.36% | 10.92%(+6.44)#203 | 6.84%(+10.5)#3,229 |
| 61. | New Rochelle | 17.33% | 10.92%(+6.41)#204 | 6.84%(+10.5)#3,230 |
| 62. | Fishers Island | 16.98% | 10.92%(+6.06)#205 | 6.84%(+10.1)#3,231 |
| 63. | Mechanicstown | 16.86% | 10.92%(+5.94)#206 | 6.84%(+10.0)#3,232 |
| 64. | Mount Kisco | 16.52% | 10.92%(+5.60)#207 | 6.84%(+9.68)#3,233 |
| 65. | Balmville | 16.45% | 10.92%(+5.53)#208 | 6.84%(+9.61)#3,234 |
| 66. | Manorhaven | 15.82% | 10.92%(+4.90)#209 | 6.84%(+8.98)#3,235 |
| 67. | Bellerose Terrace | 15.78% | 10.92%(+4.86)#210 | 6.84%(+8.94)#3,236 |
| 68. | Glen Cove | 15.52% | 10.92%(+4.60)#211 | 6.84%(+8.68)#3,237 |
| 69. | Mount Ivy | 15.43% | 10.92%(+4.51)#212 | 6.84%(+8.59)#3,238 |
| 70. | South Fallsburg | 14.96% | 10.92%(+4.04)#213 | 6.84%(+8.12)#3,239 |
| 71. | Nanuet | 14.88% | 10.92%(+3.96)#214 | 6.84%(+8.04)#3,240 |
| 72. | West Nyack | 14.76% | 10.92%(+3.84)#215 | 6.84%(+7.92)#3,241 |
| 73. | Mountain Lodge Park | 14.26% | 10.92%(+3.34)#216 | 6.84%(+7.42)#3,242 |
| 74. | Mamaroneck | 13.92% | 10.92%(+3.00)#217 | 6.84%(+7.08)#3,243 |
| 75. | Mountain Dale | 13.85% | 10.92%(+2.93)#218 | 6.84%(+7.01)#3,244 |
| 76. | Middletown | 13.73% | 10.92%(+2.81)#219 | 6.84%(+6.89)#3,245 |
| 77. | Greenport | 13.66% | 10.92%(+2.74)#220 | 6.84%(+6.82)#3,246 |
| 78. | Hillburn | 13.53% | 10.92%(+2.61)#221 | 6.84%(+6.69)#3,247 |
| 79. | Walton Park | 13.29% | 10.92%(+2.37)#222 | 6.84%(+6.45)#3,248 |
| 80. | Dannemora | 13.19% | 10.92%(+2.27)#223 | 6.84%(+6.35)#3,249 |
| 81. | Highland Falls | 13.15% | 10.92%(+2.23)#224 | 6.84%(+6.30)#3,250 |
| 82. | Brewster Hill | 13.12% | 10.92%(+2.20)#225 | 6.84%(+6.28)#3,251 |
| 83. | North Lindenhurst | 12.94% | 10.92%(+2.02)#226 | 6.84%(+6.10)#3,252 |
| 84. | Bridgehampton | 12.83% | 10.92%(+1.92)#227 | 6.84%(+5.99)#3,253 |
| 85. | Poughkeepsie | 12.71% | 10.92%(+1.79)#228 | 6.84%(+5.87)#3,254 |
| 86. | Honeoye | 12.63% | 10.92%(+1.71)#229 | 6.84%(+5.79)#3,255 |
| 87. | Swan Lake | 12.45% | 10.92%(+1.53)#230 | 6.84%(+5.61)#3,256 |
| 88. | Maybrook | 12.38% | 10.92%(+1.46)#231 | 6.84%(+5.54)#3,257 |
| 89. | Medford | 12.31% | 10.92%(+1.39)#232 | 6.84%(+5.47)#3,258 |
| 90. | Salisbury | 12.22% | 10.92%(+1.30)#233 | 6.84%(+5.38)#3,259 |
| 91. | Greenlawn | 12.20% | 10.92%(+1.28)#234 | 6.84%(+5.36)#3,260 |
| 92. | Suffern | 12.18% | 10.92%(+1.26)#235 | 6.84%(+5.34)#3,261 |
| 93. | Lake Carmel | 12.09% | 10.92%(+1.17)#236 | 6.84%(+5.25)#3,262 |
| 94. | South Hempstead | 11.83% | 10.92%(+0.915)#237 | 6.84%(+4.99)#3,263 |
| 95. | Pawling | 11.68% | 10.92%(+0.758)#238 | 6.84%(+4.84)#3,264 |
| 96. | Strykersville | 11.66% | 10.92%(+0.744)#239 | 6.84%(+4.82)#3,265 |
| 97. | Gardnertown | 11.54% | 10.92%(+0.620)#240 | 6.84%(+4.70)#3,266 |
| 98. | Nyack | 11.35% | 10.92%(+0.431)#241 | 6.84%(+4.51)#3,267 |
| 99. | Patchogue | 11.21% | 10.92%(+0.293)#242 | 6.84%(+4.37)#3,268 |
| 100. | Schenectady | 11.21% | 10.92%(+0.286)#243 | 6.84%(+4.36)#3,269 |
Common Questions
What are the Top 10 Cities with the Highest Percentage of Immigrants from Latin America in New York?
Top 10 Cities with the Highest Percentage of Immigrants from Latin America in New York are:
#1
38.59%
#2
38.02%
#3
37.66%
#4
36.94%
#5
35.96%
#6
34.92%
#7
34.41%
#8
33.70%
#9
32.82%
#10
32.37%
What city has the Highest Percentage of Immigrants from Latin America in New York?
Port Chester has the Highest Percentage of Immigrants from Latin America in New York with 38.59%.
What is the Percentage of Immigrants from Latin America in the State of New York?
Percentage of Immigrants from Latin America in New York is 10.92%.
What is the Percentage of Immigrants from Latin America in the United States?
Percentage of Immigrants from Latin America in the United States is 6.84%.