Siasconset, MA
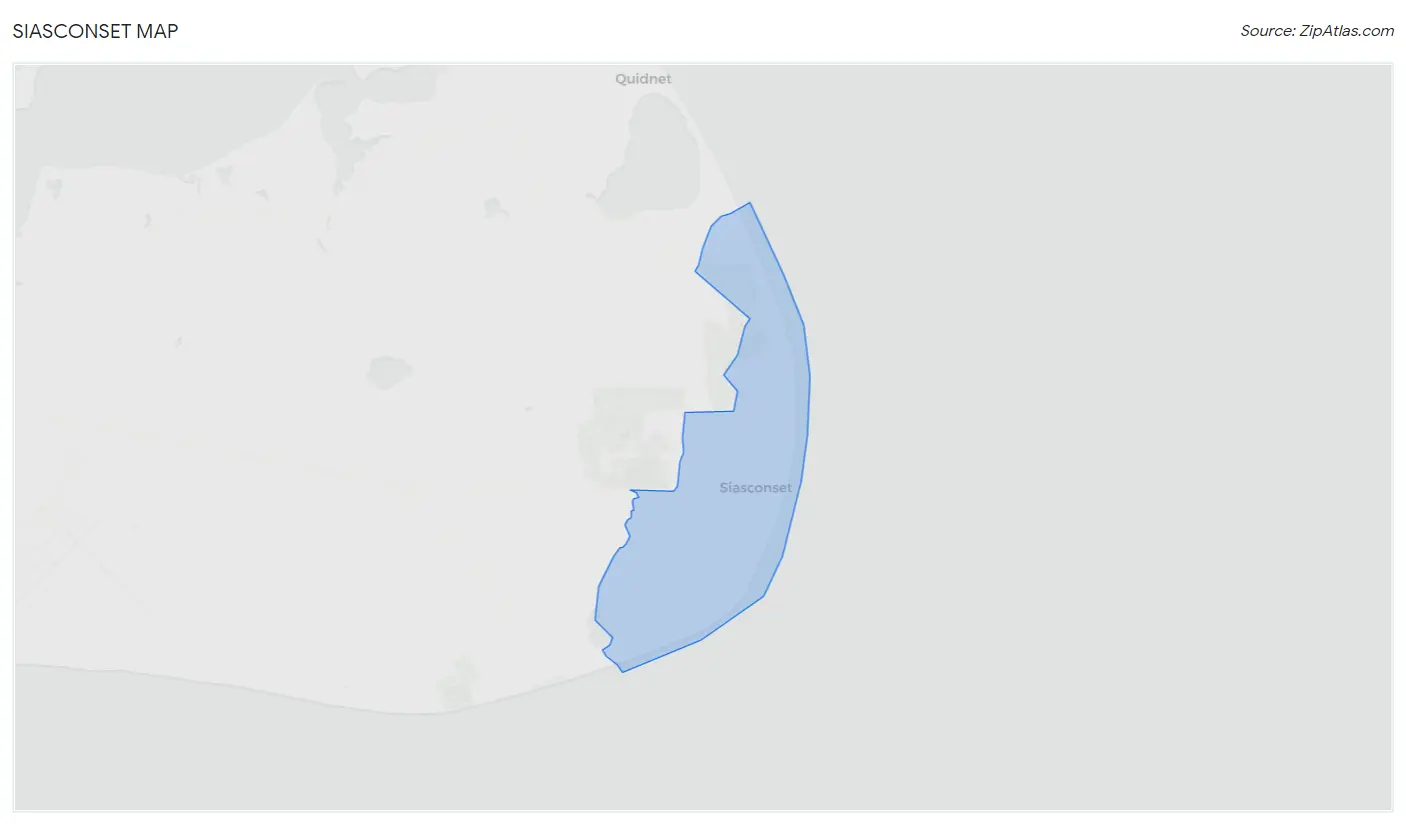
Siasconset Map
Siasconset Overview
115
TOTAL POPULATION
53
MALE POPULATION
62
FEMALE POPULATION
85.48
MALES / 100 FEMALES
116.98
FEMALES / 100 MALES
76.3
MEDIAN AGE
2.2
AVG FAMILY SIZE
1.9
AVG HOUSEHOLD SIZE
$24,223
PER CAPITA INCOME
0.48
INEQUALITY / GINI INDEX
26
LABOR FORCE [ PEOPLE ]
22.6%
PERCENT IN LABOR FORCE
Siasconset Zip Codes
Siasconset Area Codes
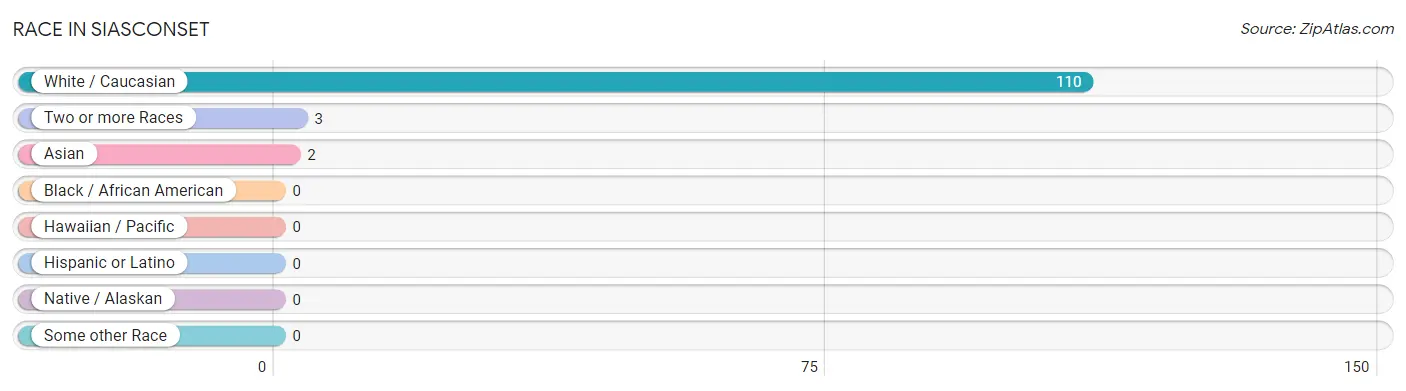
Race in Siasconset
The most populous races in Siasconset are White / Caucasian (110 | 95.7%), Two or more Races (3 | 2.6%), and Asian (2 | 1.7%).
| Race | # Population | % Population |
| Asian | 2 | 1.7% |
| Black / African American | 0 | 0.0% |
| Hawaiian / Pacific | 0 | 0.0% |
| Hispanic or Latino | 0 | 0.0% |
| Native / Alaskan | 0 | 0.0% |
| White / Caucasian | 110 | 95.7% |
| Two or more Races | 3 | 2.6% |
| Some other Race | 0 | 0.0% |
| Total | 115 | 100.0% |
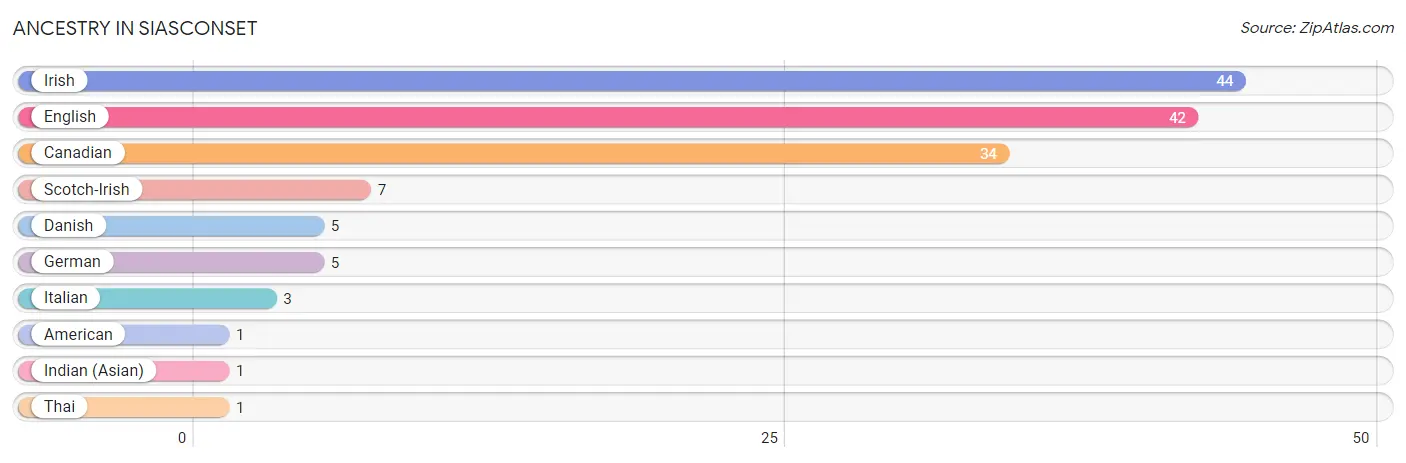
Ancestry in Siasconset
The most populous ancestries reported in Siasconset are Irish (44 | 38.3%), English (42 | 36.5%), Canadian (34 | 29.6%), Scotch-Irish (7 | 6.1%), and Danish (5 | 4.3%), together accounting for 114.8% of all Siasconset residents.
| Ancestry | # Population | % Population |
| American | 1 | 0.9% |
| Canadian | 34 | 29.6% |
| Danish | 5 | 4.3% |
| English | 42 | 36.5% |
| German | 5 | 4.3% |
| Indian (Asian) | 1 | 0.9% |
| Irish | 44 | 38.3% |
| Italian | 3 | 2.6% |
| Scotch-Irish | 7 | 6.1% |
| Thai | 1 | 0.9% | View All 10 Rows |
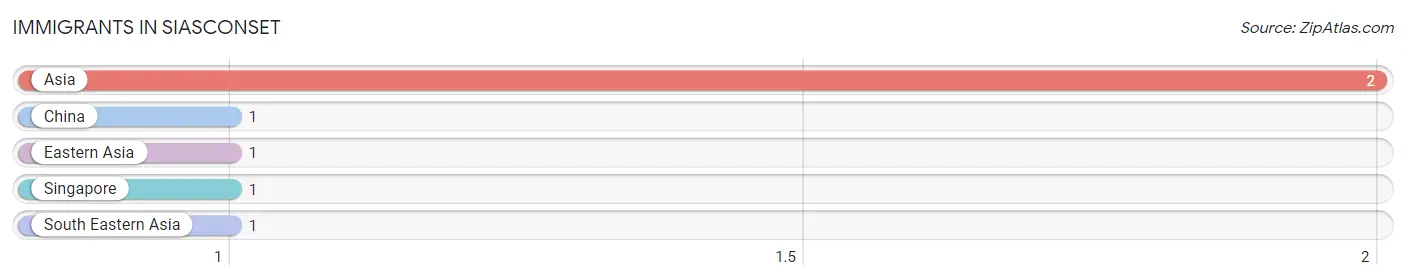
Immigrants in Siasconset
The most numerous immigrant groups reported in Siasconset came from Asia (2 | 1.7%), China (1 | 0.9%), Eastern Asia (1 | 0.9%), Singapore (1 | 0.9%), and South Eastern Asia (1 | 0.9%), together accounting for 5.2% of all Siasconset residents.
| Immigration Origin | # Population | % Population |
| Asia | 2 | 1.7% |
| China | 1 | 0.9% |
| Eastern Asia | 1 | 0.9% |
| Singapore | 1 | 0.9% |
| South Eastern Asia | 1 | 0.9% | View All 5 Rows |
Sex and Age in Siasconset
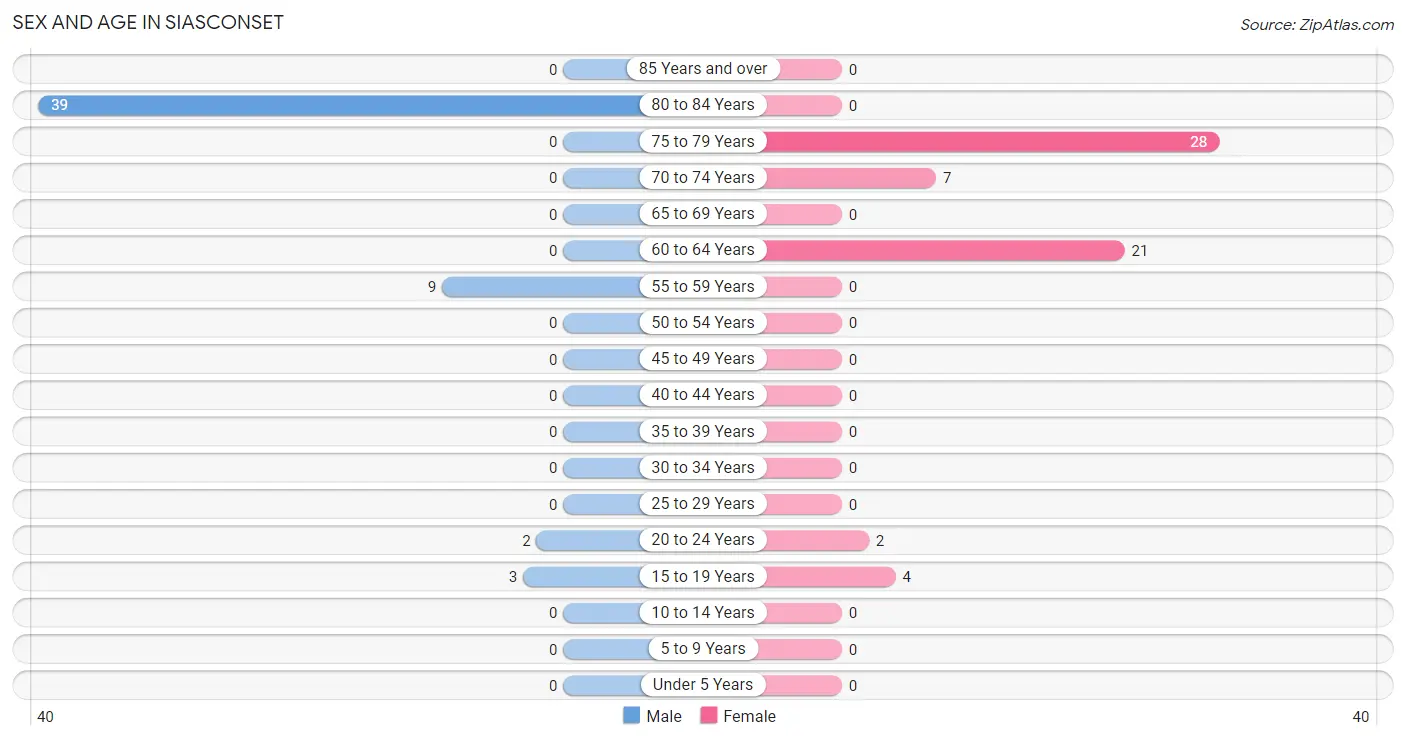
Sex and Age in Siasconset
The most populous age groups in Siasconset are 80 to 84 Years (39 | 73.6%) for men and 75 to 79 Years (28 | 45.2%) for women.
| Age Bracket | Male | Female |
| Under 5 Years | 0 (0.0%) | 0 (0.0%) |
| 5 to 9 Years | 0 (0.0%) | 0 (0.0%) |
| 10 to 14 Years | 0 (0.0%) | 0 (0.0%) |
| 15 to 19 Years | 3 (5.7%) | 4 (6.5%) |
| 20 to 24 Years | 2 (3.8%) | 2 (3.2%) |
| 25 to 29 Years | 0 (0.0%) | 0 (0.0%) |
| 30 to 34 Years | 0 (0.0%) | 0 (0.0%) |
| 35 to 39 Years | 0 (0.0%) | 0 (0.0%) |
| 40 to 44 Years | 0 (0.0%) | 0 (0.0%) |
| 45 to 49 Years | 0 (0.0%) | 0 (0.0%) |
| 50 to 54 Years | 0 (0.0%) | 0 (0.0%) |
| 55 to 59 Years | 9 (17.0%) | 0 (0.0%) |
| 60 to 64 Years | 0 (0.0%) | 21 (33.9%) |
| 65 to 69 Years | 0 (0.0%) | 0 (0.0%) |
| 70 to 74 Years | 0 (0.0%) | 7 (11.3%) |
| 75 to 79 Years | 0 (0.0%) | 28 (45.2%) |
| 80 to 84 Years | 39 (73.6%) | 0 (0.0%) |
| 85 Years and over | 0 (0.0%) | 0 (0.0%) |
| Total | 53 (100.0%) | 62 (100.0%) |
Families and Households in Siasconset
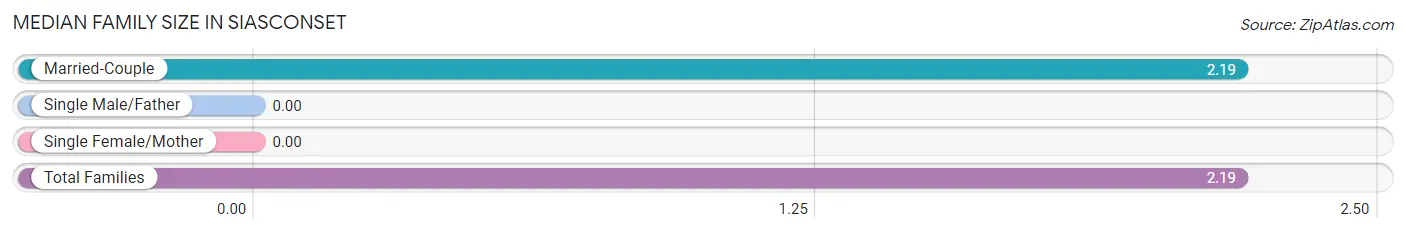
Median Family Size in Siasconset
| Family Type | # Families | Family Size |
| Married-Couple | 42 (100.0%) | 2.19 |
| Single Male/Father | 0 (0.0%) | - |
| Single Female/Mother | 0 (0.0%) | - |
| Total Families | 42 (100.0%) | 2.19 |
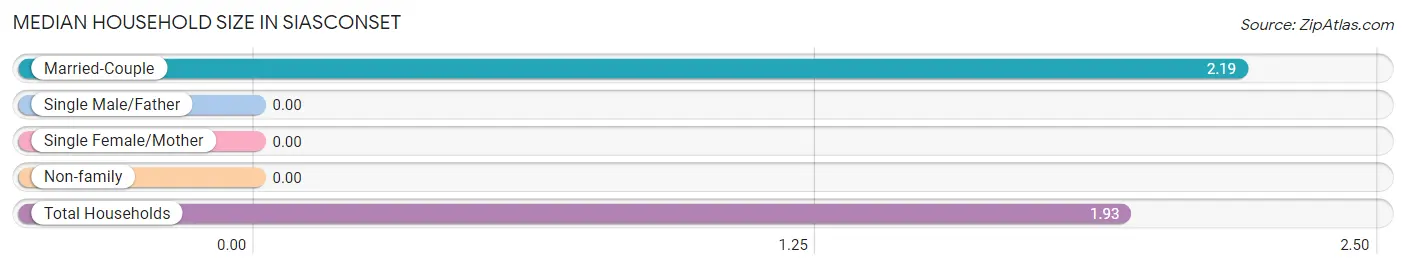
Median Household Size in Siasconset
| Household Type | # Households | Household Size |
| Married-Couple | 42 (77.8%) | 2.19 |
| Single Male/Father | 0 (0.0%) | - |
| Single Female/Mother | 0 (0.0%) | - |
| Non-family | 12 (22.2%) | - |
| Total Households | 54 (100.0%) | 1.93 |
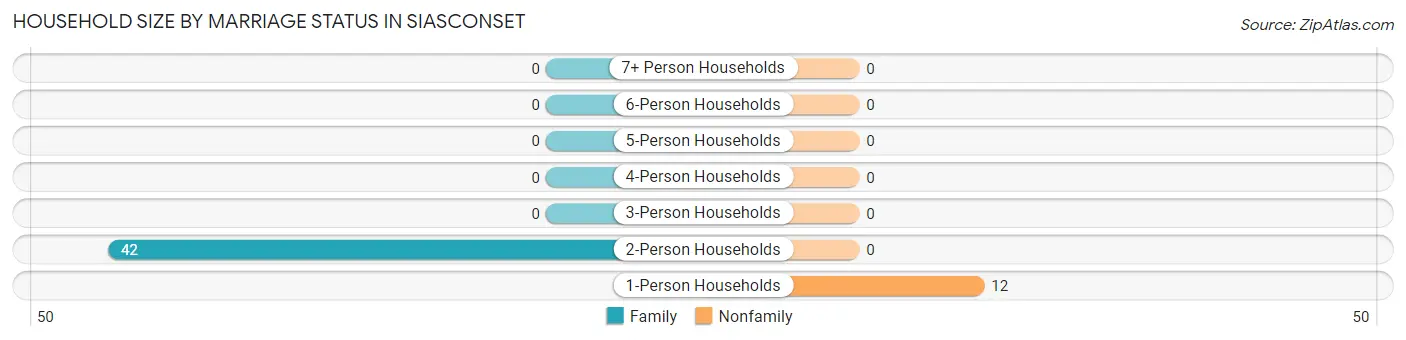
Household Size by Marriage Status in Siasconset
Out of a total of 54 households in Siasconset, 42 (77.8%) are family households, while 12 (22.2%) are nonfamily households. The most numerous type of family households are 2-person households, comprising 42, and the most common type of nonfamily households are 1-person households, comprising 12.
| Household Size | Family Households | Nonfamily Households |
| 1-Person Households | - | 12 (22.2%) |
| 2-Person Households | 42 (77.8%) | 0 (0.0%) |
| 3-Person Households | 0 (0.0%) | 0 (0.0%) |
| 4-Person Households | 0 (0.0%) | 0 (0.0%) |
| 5-Person Households | 0 (0.0%) | 0 (0.0%) |
| 6-Person Households | 0 (0.0%) | 0 (0.0%) |
| 7+ Person Households | 0 (0.0%) | 0 (0.0%) |
| Total | 42 (77.8%) | 12 (22.2%) |
Female Fertility in Siasconset
Fertility by Age in Siasconset
| Age Bracket | Women with Births | Births / 1,000 Women |
| 15 to 19 years | 0 (0.0%) | 0.0 |
| 20 to 34 years | 0 (0.0%) | 0.0 |
| 35 to 50 years | 0 (0.0%) | 0.0 |
| Total | 0 (0.0%) | 0.0 |
Fertility by Age by Marriage Status in Siasconset
| Age Bracket | Married | Unmarried |
| 15 to 19 years | 0 (0.0%) | 0 (0.0%) |
| 20 to 34 years | 0 (0.0%) | 0 (0.0%) |
| 35 to 50 years | 0 (0.0%) | 0 (0.0%) |
| Total | 0 (0.0%) | 0 (0.0%) |
Fertility by Education in Siasconset
| Educational Attainment | Women with Births | Births / 1,000 Women |
| Less than High School | 0 (0.0%) | 0.0 |
| High School Diploma | 0 (0.0%) | 0.0 |
| College or Associate's Degree | 0 (0.0%) | 0.0 |
| Bachelor's Degree | 0 (0.0%) | 0.0 |
| Graduate Degree | 0 (0.0%) | 0.0 |
| Total | 0 (0.0%) | 0.0 |
Fertility by Education by Marriage Status in Siasconset
| Educational Attainment | Married | Unmarried |
| Less than High School | 0 (0.0%) | 0 (0.0%) |
| High School Diploma | 0 (0.0%) | 0 (0.0%) |
| College or Associate's Degree | 0 (0.0%) | 0 (0.0%) |
| Bachelor's Degree | 0 (0.0%) | 0 (0.0%) |
| Graduate Degree | 0 (0.0%) | 0 (0.0%) |
| Total | 0 (0.0%) | 0 (0.0%) |
Income in Siasconset
Income Overview in Siasconset
| Characteristic | Number | Measure |
| Per Capita Income | 115 | $24,223 |
| Median Family Income | 42 | $0 |
| Mean Family Income | 42 | $55,724 |
| Median Household Income | 54 | $0 |
| Mean Household Income | 54 | $49,939 |
| Income Deficit | 42 | $0 |
| Wage / Income Gap (%) | 115 | 0.00% |
| Wage / Income Gap ($) | 115 | 100.00¢ per $1 |
| Gini / Inequality Index | 115 | 0.48 |
Earnings by Sex in Siasconset
| Sex | Number | Average Earnings |
| Male | 12 (44.4%) | $0 |
| Female | 15 (55.6%) | $0 |
| Total | 27 (100.0%) | $0 |
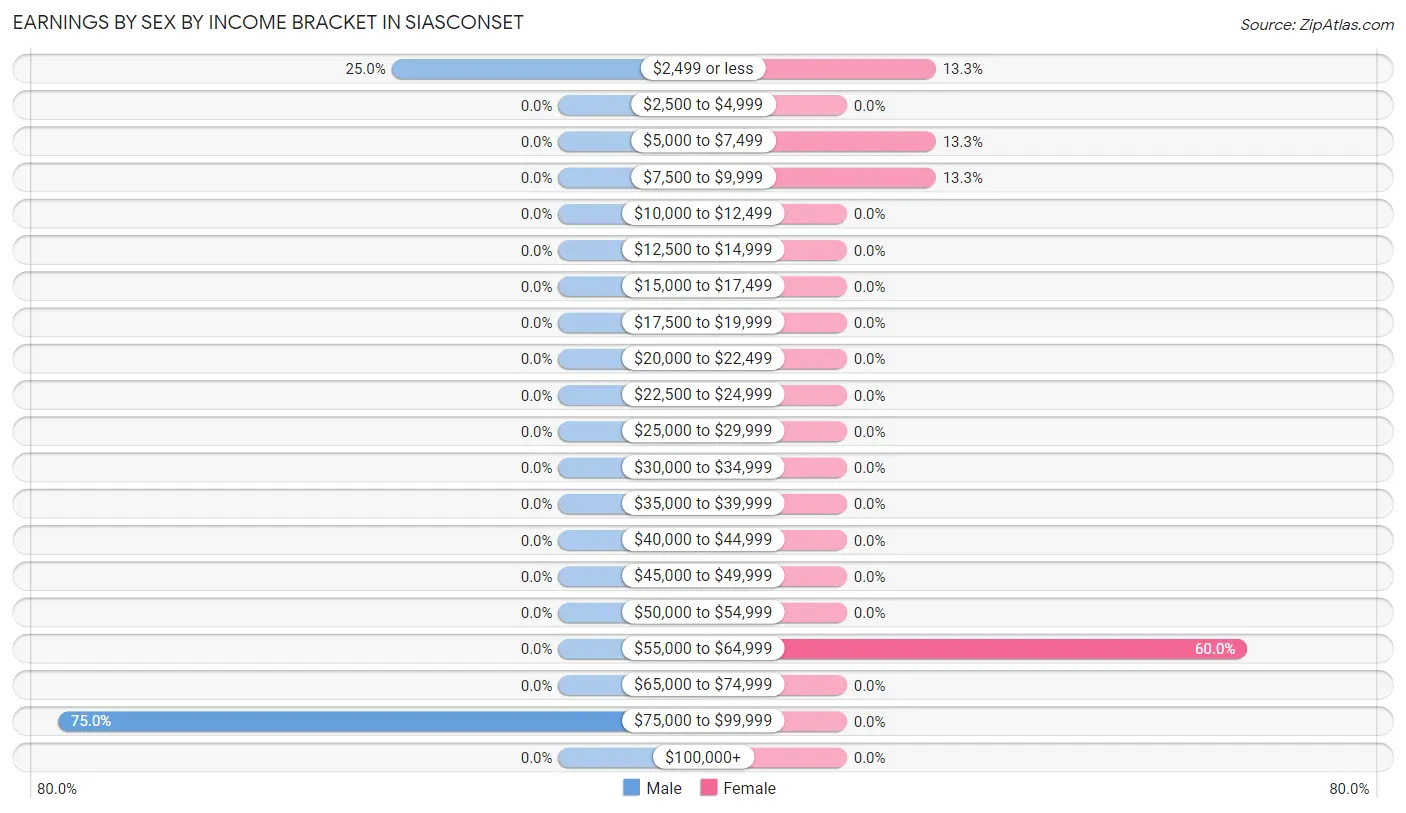
Earnings by Sex by Income Bracket in Siasconset
The most common earnings brackets in Siasconset are $75,000 to $99,999 for men (9 | 75.0%) and $55,000 to $64,999 for women (9 | 60.0%).
| Income | Male | Female |
| $2,499 or less | 3 (25.0%) | 2 (13.3%) |
| $2,500 to $4,999 | 0 (0.0%) | 0 (0.0%) |
| $5,000 to $7,499 | 0 (0.0%) | 2 (13.3%) |
| $7,500 to $9,999 | 0 (0.0%) | 2 (13.3%) |
| $10,000 to $12,499 | 0 (0.0%) | 0 (0.0%) |
| $12,500 to $14,999 | 0 (0.0%) | 0 (0.0%) |
| $15,000 to $17,499 | 0 (0.0%) | 0 (0.0%) |
| $17,500 to $19,999 | 0 (0.0%) | 0 (0.0%) |
| $20,000 to $22,499 | 0 (0.0%) | 0 (0.0%) |
| $22,500 to $24,999 | 0 (0.0%) | 0 (0.0%) |
| $25,000 to $29,999 | 0 (0.0%) | 0 (0.0%) |
| $30,000 to $34,999 | 0 (0.0%) | 0 (0.0%) |
| $35,000 to $39,999 | 0 (0.0%) | 0 (0.0%) |
| $40,000 to $44,999 | 0 (0.0%) | 0 (0.0%) |
| $45,000 to $49,999 | 0 (0.0%) | 0 (0.0%) |
| $50,000 to $54,999 | 0 (0.0%) | 0 (0.0%) |
| $55,000 to $64,999 | 0 (0.0%) | 9 (60.0%) |
| $65,000 to $74,999 | 0 (0.0%) | 0 (0.0%) |
| $75,000 to $99,999 | 9 (75.0%) | 0 (0.0%) |
| $100,000+ | 0 (0.0%) | 0 (0.0%) |
| Total | 12 (100.0%) | 15 (100.0%) |
Earnings by Sex by Educational Attainment in Siasconset
| Educational Attainment | Male Income | Female Income |
| Less than High School | - | - |
| High School Diploma | - | - |
| College or Associate's Degree | - | - |
| Bachelor's Degree | - | - |
| Graduate Degree | - | - |
| Total | - | - |
Family Income in Siasconset
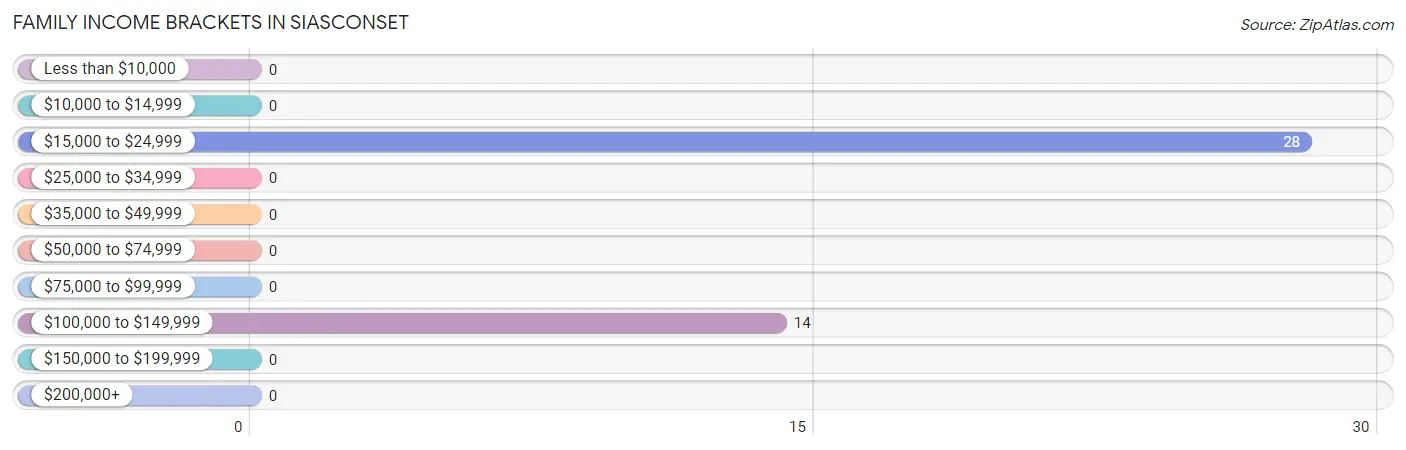
Family Income Brackets in Siasconset
According to the Siasconset family income data, there are 28 families falling into the $15,000 to $24,999 income range, which is the most common income bracket and makes up 66.7% of all families.
| Income Bracket | # Families | % Families |
| Less than $10,000 | 0 | 0.0% |
| $10,000 to $14,999 | 0 | 0.0% |
| $15,000 to $24,999 | 28 | 66.7% |
| $25,000 to $34,999 | 0 | 0.0% |
| $35,000 to $49,999 | 0 | 0.0% |
| $50,000 to $74,999 | 0 | 0.0% |
| $75,000 to $99,999 | 0 | 0.0% |
| $100,000 to $149,999 | 14 | 33.3% |
| $150,000 to $199,999 | 0 | 0.0% |
| $200,000+ | 0 | 0.0% |
Family Income by Famaliy Size in Siasconset
| Income Bracket | # Families | Median Income |
| 2-Person Families | 42 (100.0%) | $0 |
| 3-Person Families | 0 (0.0%) | $0 |
| 4-Person Families | 0 (0.0%) | $0 |
| 5-Person Families | 0 (0.0%) | $0 |
| 6-Person Families | 0 (0.0%) | $0 |
| 7+ Person Families | 0 (0.0%) | $0 |
| Total | 42 (100.0%) | $0 |
Family Income by Number of Earners in Siasconset
| Number of Earners | # Families | Median Income |
| No Earners | 33 (78.6%) | $0 |
| 1 Earner | 0 (0.0%) | $0 |
| 2 Earners | 9 (21.4%) | $0 |
| 3+ Earners | 0 (0.0%) | $0 |
| Total | 42 (100.0%) | $0 |
Household Income in Siasconset
Household Income Brackets in Siasconset
With 28 households falling in the category, the $15,000 to $24,999 income range is the most frequent in Siasconset, accounting for 51.8% of all households.
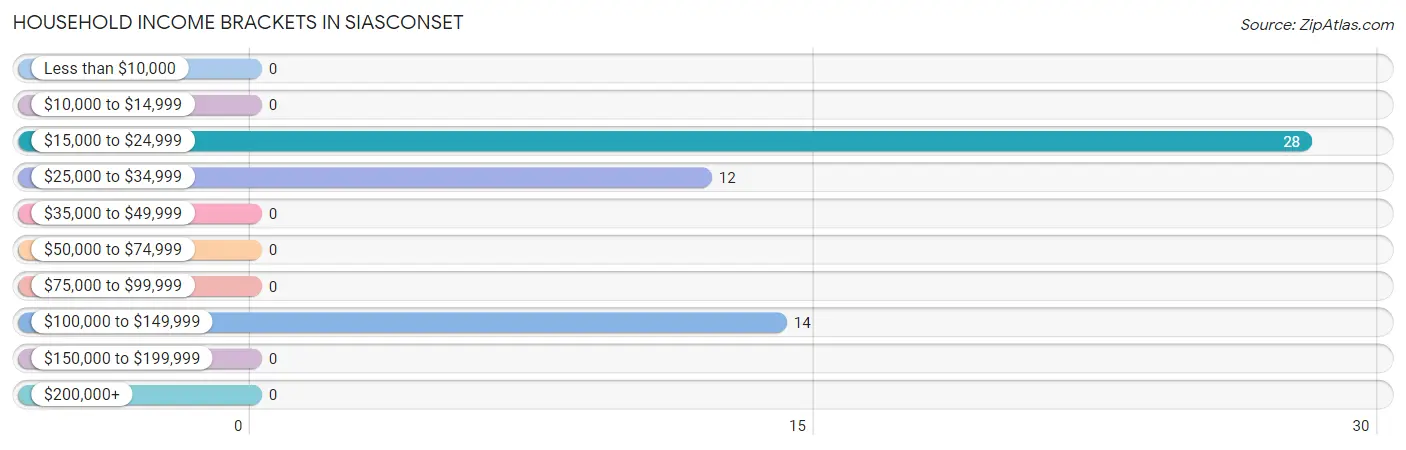
| Income Bracket | # Households | % Households |
| Less than $10,000 | 0 | 0.0% |
| $10,000 to $14,999 | 0 | 0.0% |
| $15,000 to $24,999 | 28 | 51.9% |
| $25,000 to $34,999 | 12 | 22.2% |
| $35,000 to $49,999 | 0 | 0.0% |
| $50,000 to $74,999 | 0 | 0.0% |
| $75,000 to $99,999 | 0 | 0.0% |
| $100,000 to $149,999 | 14 | 25.9% |
| $150,000 to $199,999 | 0 | 0.0% |
| $200,000+ | 0 | 0.0% |
Household Income by Householder Age in Siasconset
| Income Bracket | # Households | Median Income |
| 15 to 24 Years | 0 (0.0%) | $0 |
| 25 to 44 Years | 0 (0.0%) | $0 |
| 45 to 64 Years | 21 (38.9%) | $0 |
| 65+ Years | 33 (61.1%) | $0 |
| Total | 54 (100.0%) | $0 |
Poverty in Siasconset
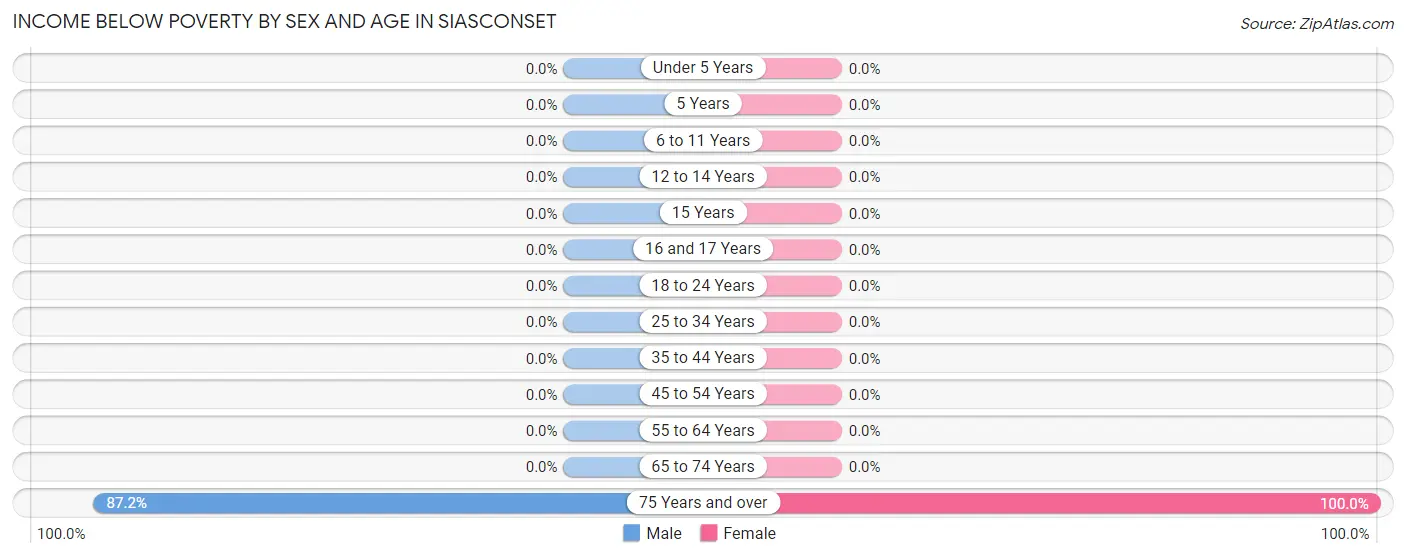
Income Below Poverty by Sex and Age in Siasconset
With 70.8% poverty level for males and 50.0% for females among the residents of Siasconset, 75 year old and over males and 75 year old and over females are the most vulnerable to poverty, with 34 males (87.2%) and 28 females (100.0%) in their respective age groups living below the poverty level.
| Age Bracket | Male | Female |
| Under 5 Years | 0 (0.0%) | 0 (0.0%) |
| 5 Years | 0 (0.0%) | 0 (0.0%) |
| 6 to 11 Years | 0 (0.0%) | 0 (0.0%) |
| 12 to 14 Years | 0 (0.0%) | 0 (0.0%) |
| 15 Years | 0 (0.0%) | 0 (0.0%) |
| 16 and 17 Years | 0 (0.0%) | 0 (0.0%) |
| 18 to 24 Years | 0 (0.0%) | 0 (0.0%) |
| 25 to 34 Years | 0 (0.0%) | 0 (0.0%) |
| 35 to 44 Years | 0 (0.0%) | 0 (0.0%) |
| 45 to 54 Years | 0 (0.0%) | 0 (0.0%) |
| 55 to 64 Years | 0 (0.0%) | 0 (0.0%) |
| 65 to 74 Years | 0 (0.0%) | 0 (0.0%) |
| 75 Years and over | 34 (87.2%) | 28 (100.0%) |
| Total | 34 (70.8%) | 28 (50.0%) |
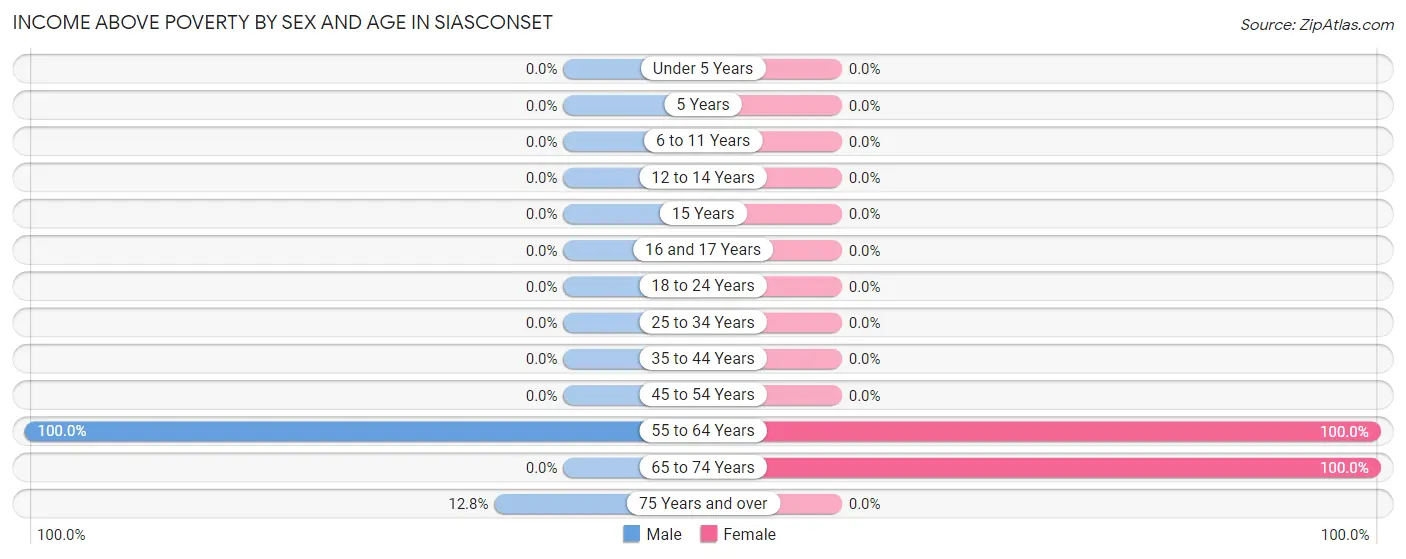
Income Above Poverty by Sex and Age in Siasconset
According to the poverty statistics in Siasconset, males aged 55 to 64 years and females aged 55 to 64 years are the age groups that are most secure financially, with 100.0% of males and 100.0% of females in these age groups living above the poverty line.
| Age Bracket | Male | Female |
| Under 5 Years | 0 (0.0%) | 0 (0.0%) |
| 5 Years | 0 (0.0%) | 0 (0.0%) |
| 6 to 11 Years | 0 (0.0%) | 0 (0.0%) |
| 12 to 14 Years | 0 (0.0%) | 0 (0.0%) |
| 15 Years | 0 (0.0%) | 0 (0.0%) |
| 16 and 17 Years | 0 (0.0%) | 0 (0.0%) |
| 18 to 24 Years | 0 (0.0%) | 0 (0.0%) |
| 25 to 34 Years | 0 (0.0%) | 0 (0.0%) |
| 35 to 44 Years | 0 (0.0%) | 0 (0.0%) |
| 45 to 54 Years | 0 (0.0%) | 0 (0.0%) |
| 55 to 64 Years | 9 (100.0%) | 21 (100.0%) |
| 65 to 74 Years | 0 (0.0%) | 7 (100.0%) |
| 75 Years and over | 5 (12.8%) | 0 (0.0%) |
| Total | 14 (29.2%) | 28 (50.0%) |
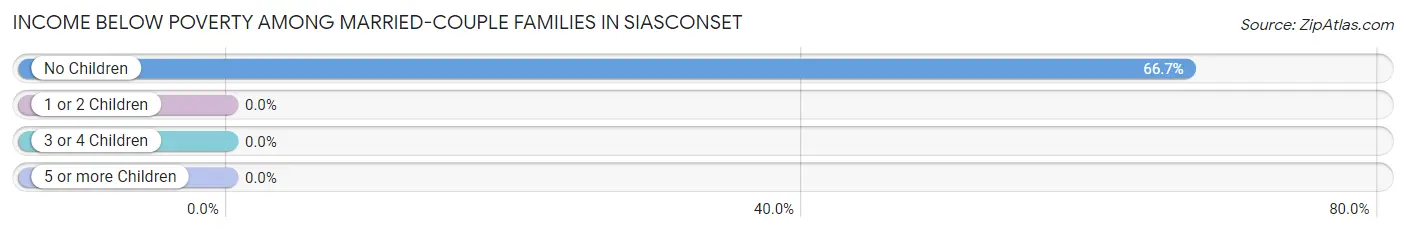
Income Below Poverty Among Married-Couple Families in Siasconset
The poverty statistics for married-couple families in Siasconset show that 66.7% or 28 of the total 42 families live below the poverty line. Families with no children have the highest poverty rate of 66.7%, comprising of 28 families. On the other hand, families with no children have the lowest poverty rate of 66.7%, which includes 28 families.
| Children | Above Poverty | Below Poverty |
| No Children | 14 (33.3%) | 28 (66.7%) |
| 1 or 2 Children | 0 (0.0%) | 0 (0.0%) |
| 3 or 4 Children | 0 (0.0%) | 0 (0.0%) |
| 5 or more Children | 0 (0.0%) | 0 (0.0%) |
| Total | 14 (33.3%) | 28 (66.7%) |
Income Below Poverty Among Single-Parent Households in Siasconset
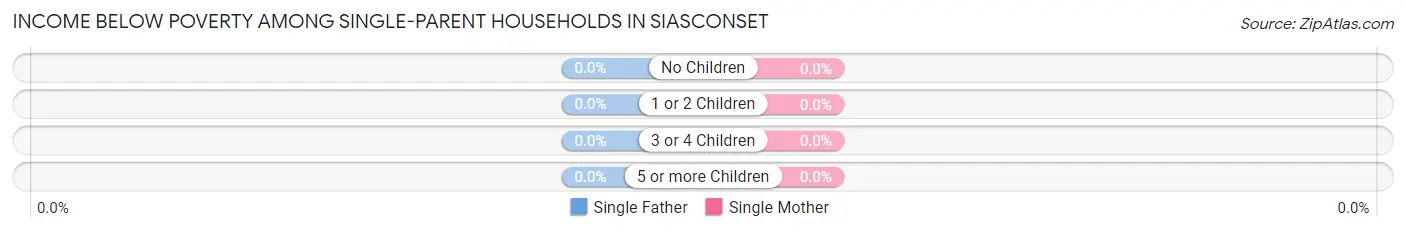
| Children | Single Father | Single Mother |
| No Children | 0 (0.0%) | 0 (0.0%) |
| 1 or 2 Children | 0 (0.0%) | 0 (0.0%) |
| 3 or 4 Children | 0 (0.0%) | 0 (0.0%) |
| 5 or more Children | 0 (0.0%) | 0 (0.0%) |
| Total | 0 (0.0%) | 0 (0.0%) |
Income Below Poverty Among Married-Couple vs Single-Parent Households in Siasconset
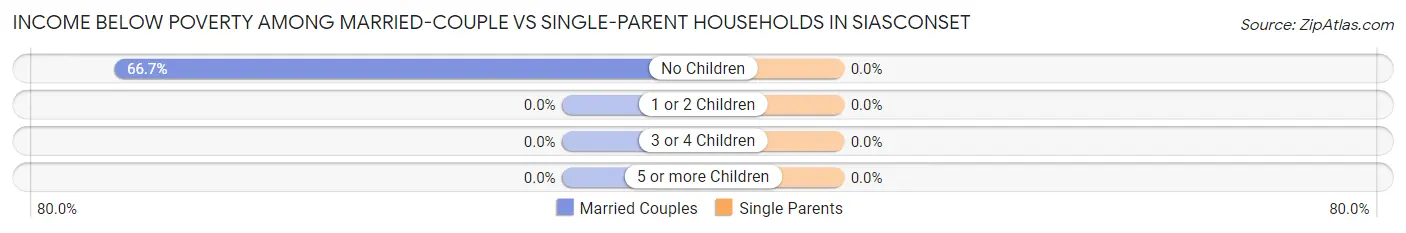
| Children | Married-Couple Families | Single-Parent Households |
| No Children | 28 (66.7%) | 0 (0.0%) |
| 1 or 2 Children | 0 (0.0%) | 0 (0.0%) |
| 3 or 4 Children | 0 (0.0%) | 0 (0.0%) |
| 5 or more Children | 0 (0.0%) | 0 (0.0%) |
| Total | 28 (66.7%) | 0 (0.0%) |
Employment Characteristics in Siasconset
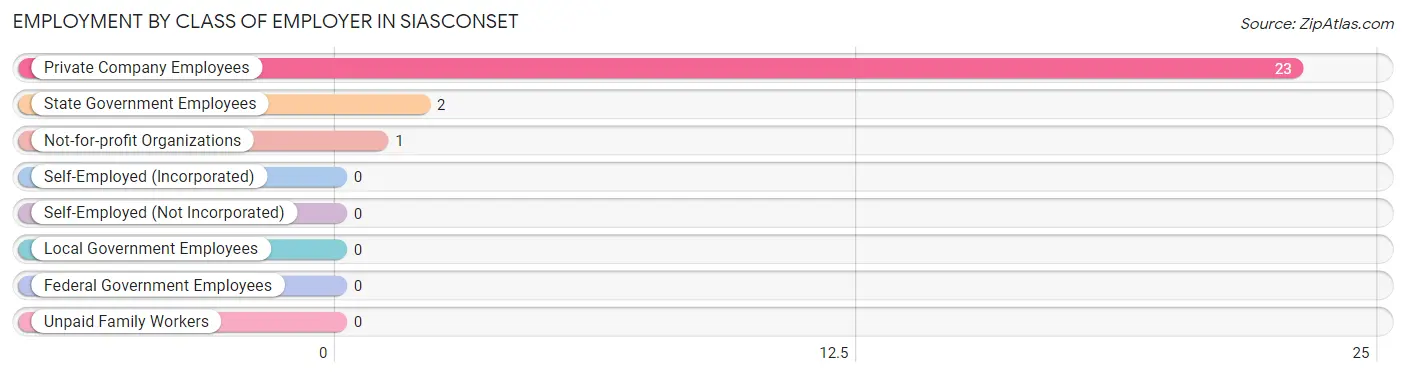
Employment by Class of Employer in Siasconset
Among the 26 employed individuals in Siasconset, private company employees (23 | 88.5%), state government employees (2 | 7.7%), and not-for-profit organizations (1 | 3.8%) make up the most common classes of employment.
| Employer Class | # Employees | % Employees |
| Private Company Employees | 23 | 88.5% |
| Self-Employed (Incorporated) | 0 | 0.0% |
| Self-Employed (Not Incorporated) | 0 | 0.0% |
| Not-for-profit Organizations | 1 | 3.8% |
| Local Government Employees | 0 | 0.0% |
| State Government Employees | 2 | 7.7% |
| Federal Government Employees | 0 | 0.0% |
| Unpaid Family Workers | 0 | 0.0% |
| Total | 26 | 100.0% |
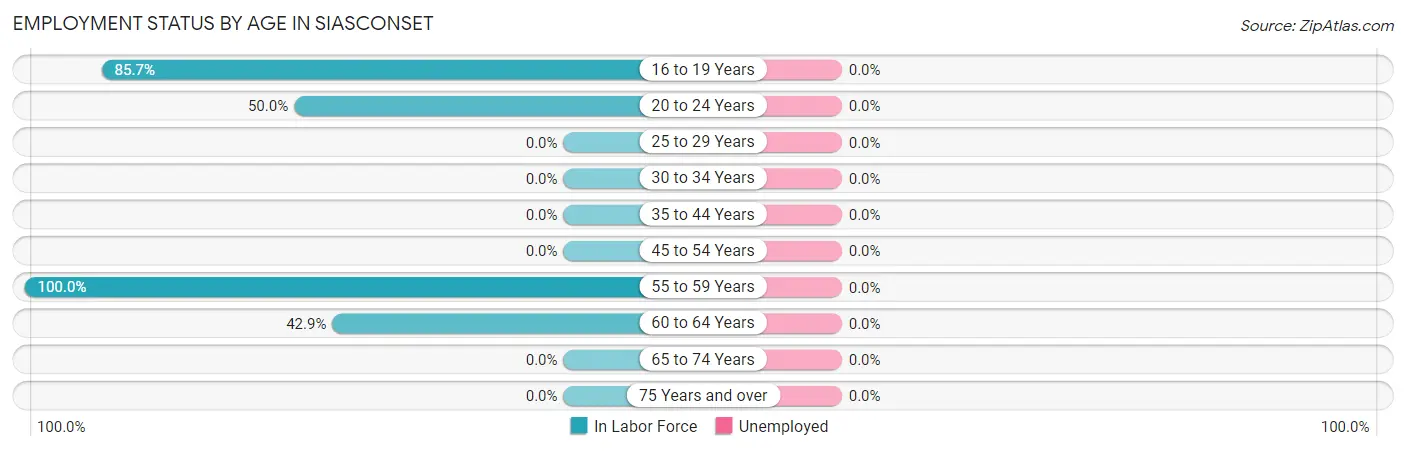
Employment Status by Age in Siasconset
| Age Bracket | In Labor Force | Unemployed |
| 16 to 19 Years | 6 (85.7%) | 0 (0.0%) |
| 20 to 24 Years | 2 (50.0%) | 0 (0.0%) |
| 25 to 29 Years | 0 (0.0%) | 0 (0.0%) |
| 30 to 34 Years | 0 (0.0%) | 0 (0.0%) |
| 35 to 44 Years | 0 (0.0%) | 0 (0.0%) |
| 45 to 54 Years | 0 (0.0%) | 0 (0.0%) |
| 55 to 59 Years | 9 (100.0%) | 0 (0.0%) |
| 60 to 64 Years | 9 (42.9%) | 0 (0.0%) |
| 65 to 74 Years | 0 (0.0%) | 0 (0.0%) |
| 75 Years and over | 0 (0.0%) | 0 (0.0%) |
| Total | 26 (22.6%) | 0 (0.0%) |
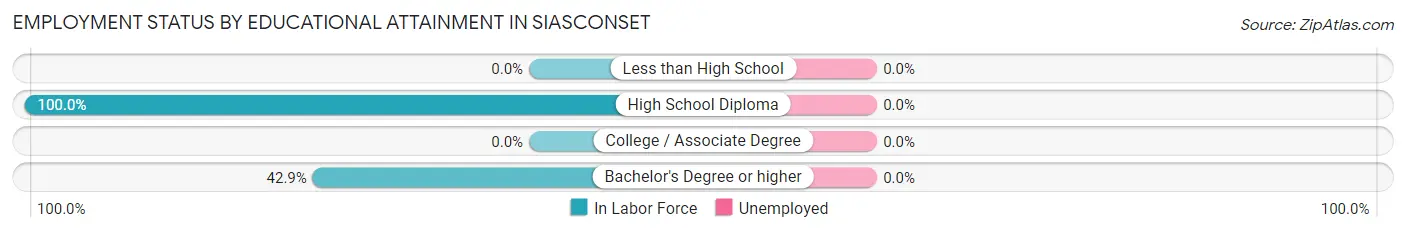
Employment Status by Educational Attainment in Siasconset
| Educational Attainment | In Labor Force | Unemployed |
| Less than High School | 0 (0.0%) | 0 (0.0%) |
| High School Diploma | 9 (100.0%) | 0 (0.0%) |
| College / Associate Degree | 0 (0.0%) | 0 (0.0%) |
| Bachelor's Degree or higher | 9 (42.9%) | 0 (0.0%) |
| Total | 18 (60.0%) | 0 (0.0%) |
Employment Occupations by Sex in Siasconset
Management, Business, Science and Arts Occupations
Management, Business, Science and Arts Occupations by Sex
| Occupation | Male | Female |
| Management | 0 (0.0%) | 0 (0.0%) |
| Business & Financial | 0 (0.0%) | 0 (0.0%) |
| Computers, Engineering & Science | 0 (0.0%) | 0 (0.0%) |
| Computers & Mathematics | 0 (0.0%) | 0 (0.0%) |
| Architecture & Engineering | 0 (0.0%) | 0 (0.0%) |
| Life, Physical & Social Science | 0 (0.0%) | 0 (0.0%) |
| Community & Social Service | 0 (0.0%) | 0 (0.0%) |
| Education, Arts & Media | 0 (0.0%) | 0 (0.0%) |
| Legal Services & Support | 0 (0.0%) | 0 (0.0%) |
| Education Instruction & Library | 0 (0.0%) | 0 (0.0%) |
| Arts, Media & Entertainment | 0 (0.0%) | 0 (0.0%) |
| Health Diagnosing & Treating | 0 (0.0%) | 0 (0.0%) |
| Health Technologists | 0 (0.0%) | 0 (0.0%) |
| Total (Category) | 0 (0.0%) | 0 (0.0%) |
| Total (Overall) | 11 (42.3%) | 15 (57.7%) |
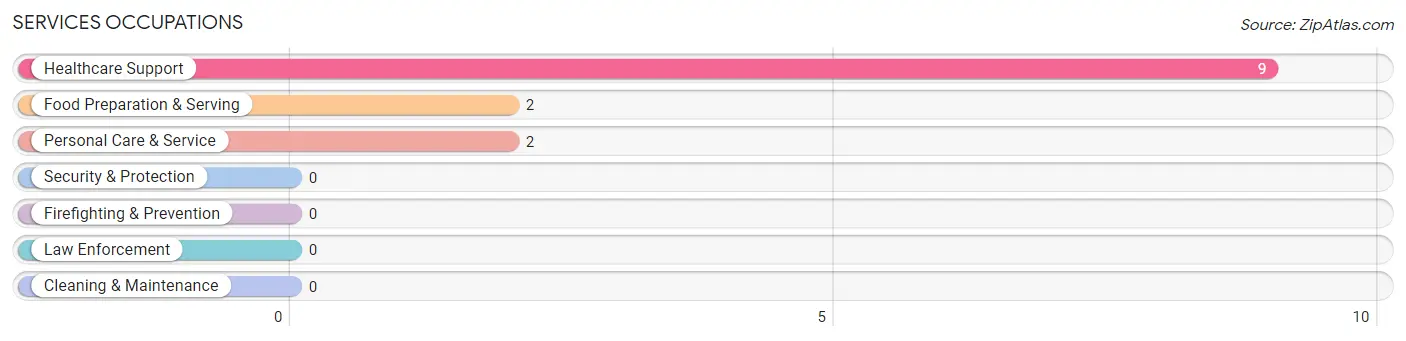
Services Occupations
The most common Services occupations in Siasconset are Healthcare Support (9 | 34.6%), Food Preparation & Serving (2 | 7.7%), and Personal Care & Service (2 | 7.7%).
Services Occupations by Sex
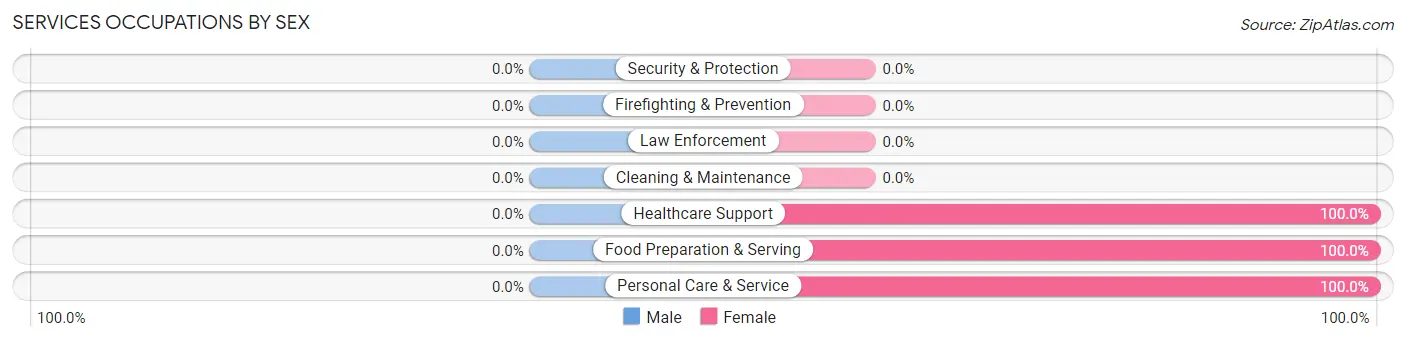
| Occupation | Male | Female |
| Healthcare Support | 0 (0.0%) | 9 (100.0%) |
| Security & Protection | 0 (0.0%) | 0 (0.0%) |
| Firefighting & Prevention | 0 (0.0%) | 0 (0.0%) |
| Law Enforcement | 0 (0.0%) | 0 (0.0%) |
| Food Preparation & Serving | 0 (0.0%) | 2 (100.0%) |
| Cleaning & Maintenance | 0 (0.0%) | 0 (0.0%) |
| Personal Care & Service | 0 (0.0%) | 2 (100.0%) |
| Total (Category) | 0 (0.0%) | 13 (100.0%) |
| Total (Overall) | 11 (42.3%) | 15 (57.7%) |
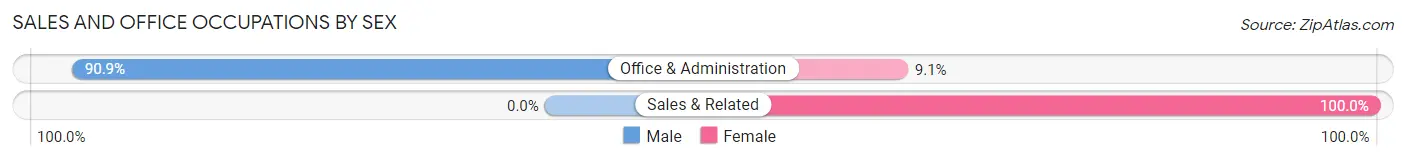
Sales and Office Occupations
The most common Sales and Office occupations in Siasconset are Office & Administration (11 | 42.3%), and Sales & Related (1 | 3.8%).
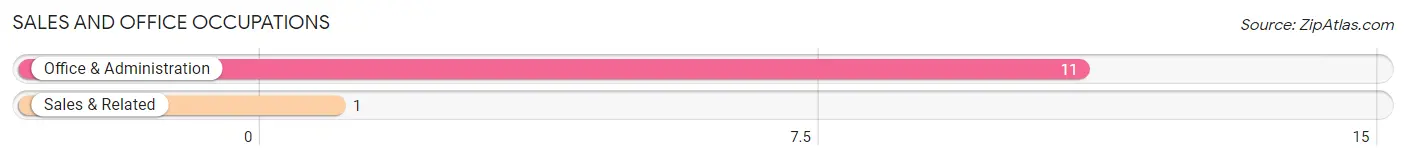
Sales and Office Occupations by Sex
| Occupation | Male | Female |
| Sales & Related | 0 (0.0%) | 1 (100.0%) |
| Office & Administration | 10 (90.9%) | 1 (9.1%) |
| Total (Category) | 10 (83.3%) | 2 (16.7%) |
| Total (Overall) | 11 (42.3%) | 15 (57.7%) |
Natural Resources, Construction and Maintenance Occupations
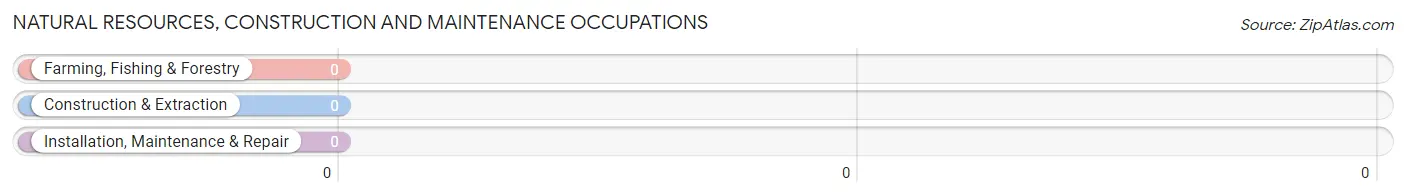
Natural Resources, Construction and Maintenance Occupations by Sex
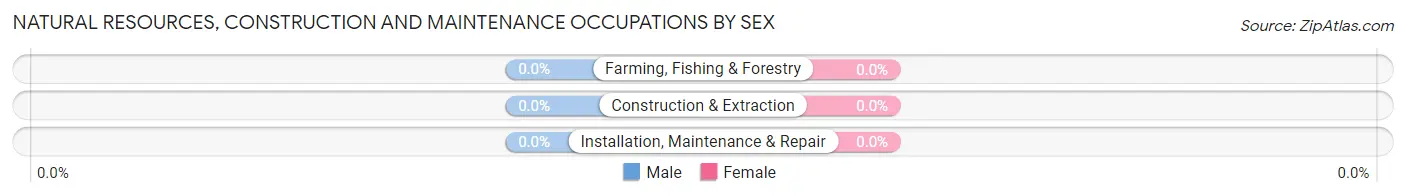
| Occupation | Male | Female |
| Farming, Fishing & Forestry | 0 (0.0%) | 0 (0.0%) |
| Construction & Extraction | 0 (0.0%) | 0 (0.0%) |
| Installation, Maintenance & Repair | 0 (0.0%) | 0 (0.0%) |
| Total (Category) | 0 (0.0%) | 0 (0.0%) |
| Total (Overall) | 11 (42.3%) | 15 (57.7%) |
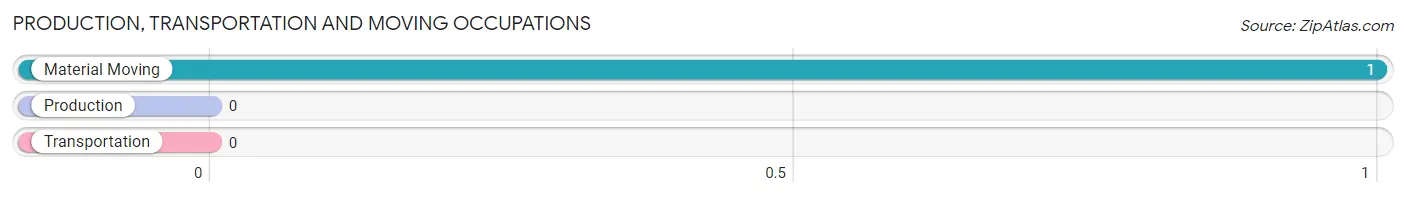
Production, Transportation and Moving Occupations
The most common Production, Transportation and Moving occupations in Siasconset are , and Material Moving (1 | 3.8%).
Production, Transportation and Moving Occupations by Sex
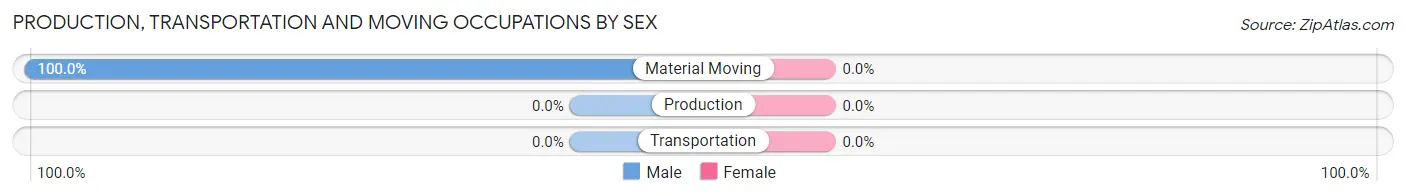
| Occupation | Male | Female |
| Production | 0 (0.0%) | 0 (0.0%) |
| Transportation | 0 (0.0%) | 0 (0.0%) |
| Material Moving | 1 (100.0%) | 0 (0.0%) |
| Total (Category) | 1 (100.0%) | 0 (0.0%) |
| Total (Overall) | 11 (42.3%) | 15 (57.7%) |
Employment Industries by Sex in Siasconset
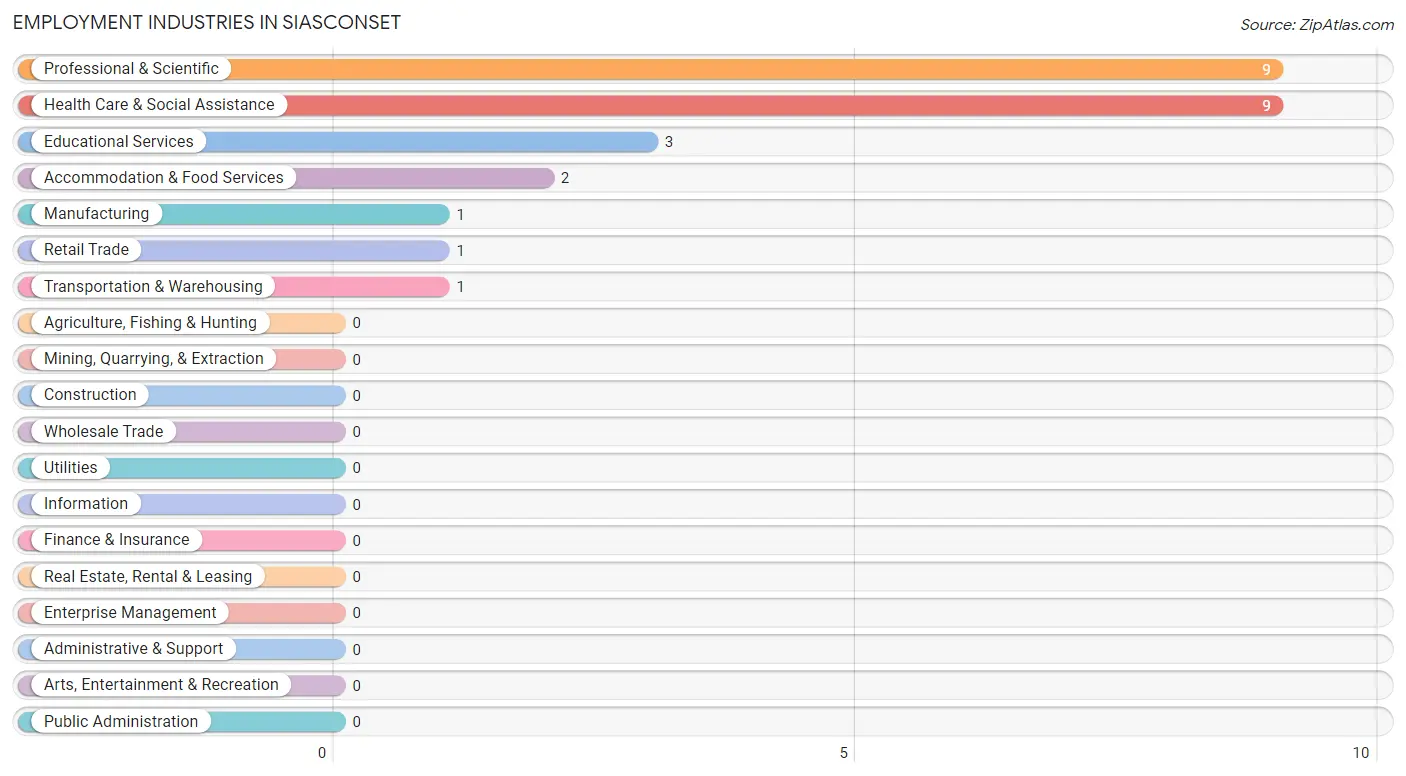
Employment Industries in Siasconset
The major employment industries in Siasconset include Professional & Scientific (9 | 34.6%), Health Care & Social Assistance (9 | 34.6%), Educational Services (3 | 11.5%), Accommodation & Food Services (2 | 7.7%), and Manufacturing (1 | 3.8%).
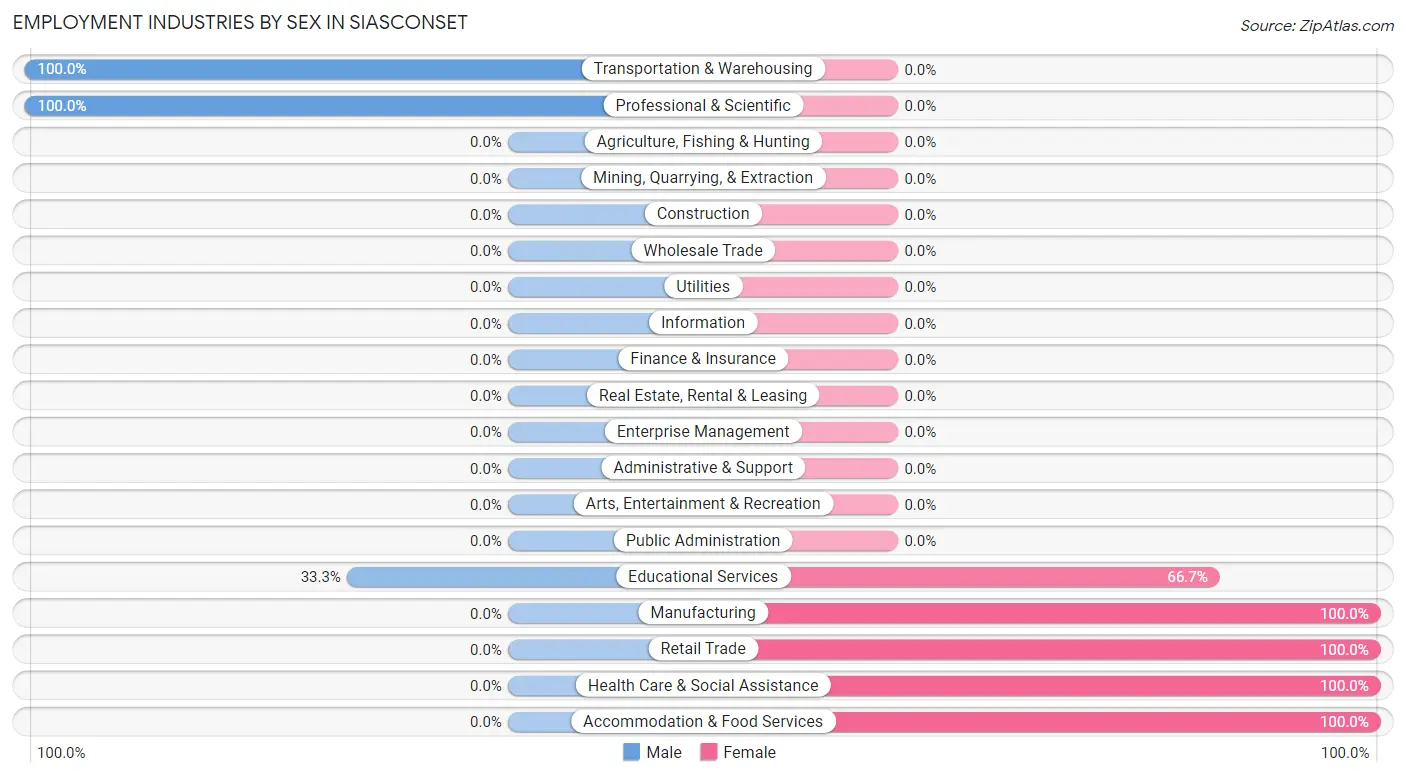
Employment Industries by Sex in Siasconset
The Siasconset industries that see more men than women are Transportation & Warehousing (100.0%), Professional & Scientific (100.0%), and Educational Services (33.3%), whereas the industries that tend to have a higher number of women are Manufacturing (100.0%), Retail Trade (100.0%), and Health Care & Social Assistance (100.0%).
| Industry | Male | Female |
| Agriculture, Fishing & Hunting | 0 (0.0%) | 0 (0.0%) |
| Mining, Quarrying, & Extraction | 0 (0.0%) | 0 (0.0%) |
| Construction | 0 (0.0%) | 0 (0.0%) |
| Manufacturing | 0 (0.0%) | 1 (100.0%) |
| Wholesale Trade | 0 (0.0%) | 0 (0.0%) |
| Retail Trade | 0 (0.0%) | 1 (100.0%) |
| Transportation & Warehousing | 1 (100.0%) | 0 (0.0%) |
| Utilities | 0 (0.0%) | 0 (0.0%) |
| Information | 0 (0.0%) | 0 (0.0%) |
| Finance & Insurance | 0 (0.0%) | 0 (0.0%) |
| Real Estate, Rental & Leasing | 0 (0.0%) | 0 (0.0%) |
| Professional & Scientific | 9 (100.0%) | 0 (0.0%) |
| Enterprise Management | 0 (0.0%) | 0 (0.0%) |
| Administrative & Support | 0 (0.0%) | 0 (0.0%) |
| Educational Services | 1 (33.3%) | 2 (66.7%) |
| Health Care & Social Assistance | 0 (0.0%) | 9 (100.0%) |
| Arts, Entertainment & Recreation | 0 (0.0%) | 0 (0.0%) |
| Accommodation & Food Services | 0 (0.0%) | 2 (100.0%) |
| Public Administration | 0 (0.0%) | 0 (0.0%) |
| Total | 11 (42.3%) | 15 (57.7%) |
Education in Siasconset
School Enrollment in Siasconset
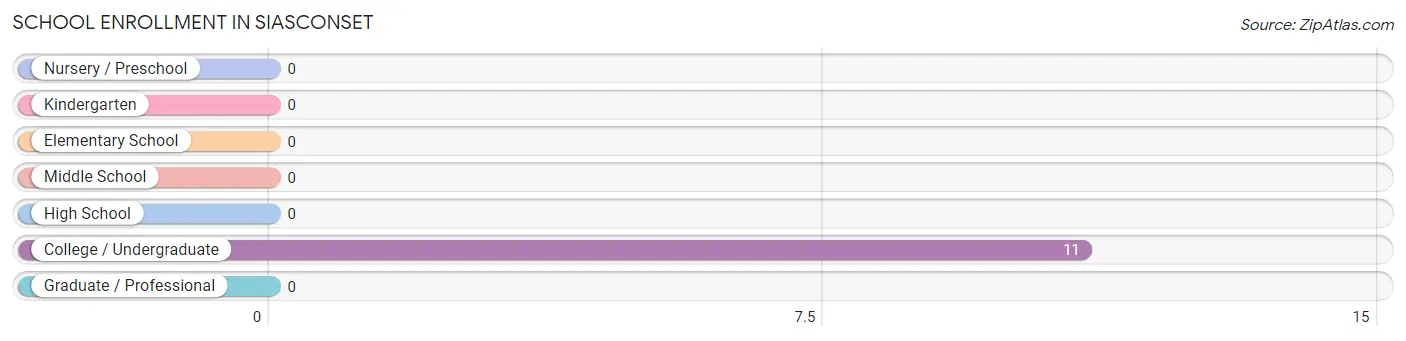
| School Level | # Students | % Students |
| Nursery / Preschool | 0 | 0.0% |
| Kindergarten | 0 | 0.0% |
| Elementary School | 0 | 0.0% |
| Middle School | 0 | 0.0% |
| High School | 0 | 0.0% |
| College / Undergraduate | 11 | 100.0% |
| Graduate / Professional | 0 | 0.0% |
| Total | 11 | 100.0% |
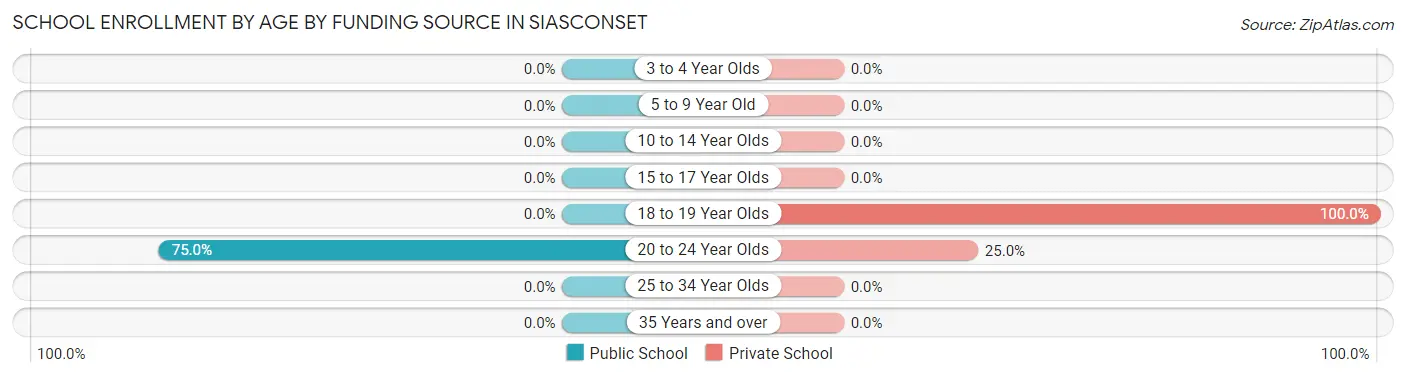
School Enrollment by Age by Funding Source in Siasconset
Out of a total of 11 students who are enrolled in schools in Siasconset, 8 (72.7%) attend a private institution, while the remaining 3 (27.3%) are enrolled in public schools. The age group of 18 to 19 year olds has the highest likelihood of being enrolled in private schools, with 7 (100.0% in the age bracket) enrolled. Conversely, the age group of 20 to 24 year olds has the lowest likelihood of being enrolled in a private school, with 3 (75.0% in the age bracket) attending a public institution.
| Age Bracket | Public School | Private School |
| 3 to 4 Year Olds | 0 (0.0%) | 0 (0.0%) |
| 5 to 9 Year Old | 0 (0.0%) | 0 (0.0%) |
| 10 to 14 Year Olds | 0 (0.0%) | 0 (0.0%) |
| 15 to 17 Year Olds | 0 (0.0%) | 0 (0.0%) |
| 18 to 19 Year Olds | 0 (0.0%) | 7 (100.0%) |
| 20 to 24 Year Olds | 3 (75.0%) | 1 (25.0%) |
| 25 to 34 Year Olds | 0 (0.0%) | 0 (0.0%) |
| 35 Years and over | 0 (0.0%) | 0 (0.0%) |
| Total | 3 (27.3%) | 8 (72.7%) |
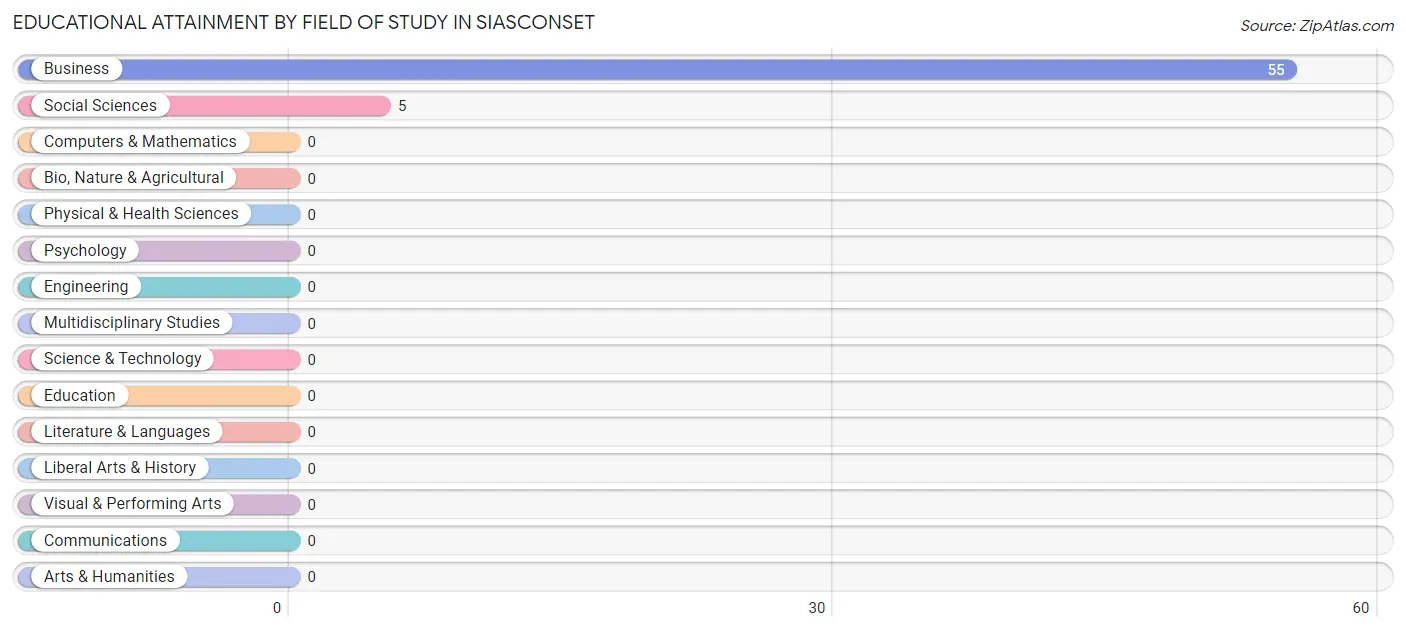
Educational Attainment by Field of Study in Siasconset
Business (55 | 91.7%), and social sciences (5 | 8.3%) are the most common fields of study among 60 individuals in Siasconset who have obtained a bachelor's degree or higher.
| Field of Study | # Graduates | % Graduates |
| Computers & Mathematics | 0 | 0.0% |
| Bio, Nature & Agricultural | 0 | 0.0% |
| Physical & Health Sciences | 0 | 0.0% |
| Psychology | 0 | 0.0% |
| Social Sciences | 5 | 8.3% |
| Engineering | 0 | 0.0% |
| Multidisciplinary Studies | 0 | 0.0% |
| Science & Technology | 0 | 0.0% |
| Business | 55 | 91.7% |
| Education | 0 | 0.0% |
| Literature & Languages | 0 | 0.0% |
| Liberal Arts & History | 0 | 0.0% |
| Visual & Performing Arts | 0 | 0.0% |
| Communications | 0 | 0.0% |
| Arts & Humanities | 0 | 0.0% |
| Total | 60 | 100.0% |
Transportation & Commute in Siasconset
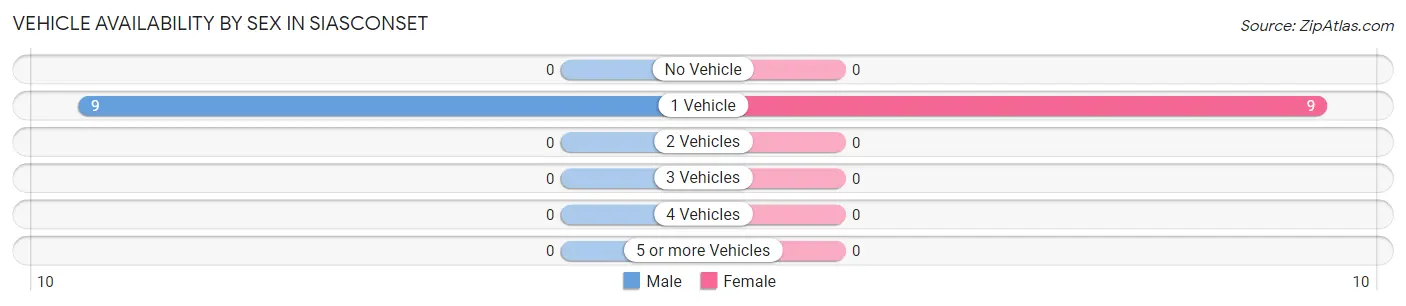
Vehicle Availability by Sex in Siasconset
The most prevalent vehicle ownership categories in Siasconset are males with 1 vehicle (9, accounting for 100.0%) and females with 1 vehicle (9, making up 100.0%).
| Vehicles Available | Male | Female |
| No Vehicle | 0 (0.0%) | 0 (0.0%) |
| 1 Vehicle | 9 (100.0%) | 9 (100.0%) |
| 2 Vehicles | 0 (0.0%) | 0 (0.0%) |
| 3 Vehicles | 0 (0.0%) | 0 (0.0%) |
| 4 Vehicles | 0 (0.0%) | 0 (0.0%) |
| 5 or more Vehicles | 0 (0.0%) | 0 (0.0%) |
| Total | 9 (100.0%) | 9 (100.0%) |
Commute Time in Siasconset
The most frequently occuring commute durations in Siasconset are 10 to 14 minutes (10 commuters, 41.7%), 15 to 19 minutes (9 commuters, 37.5%), and 5 to 9 minutes (5 commuters, 20.8%).
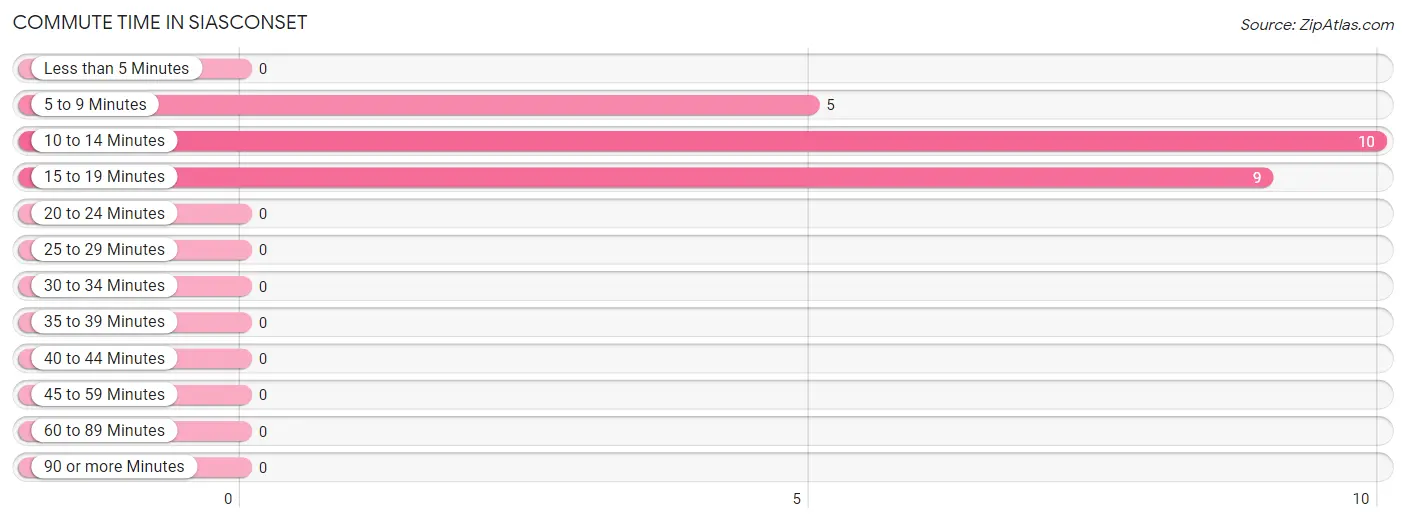
| Commute Time | # Commuters | % Commuters |
| Less than 5 Minutes | 0 | 0.0% |
| 5 to 9 Minutes | 5 | 20.8% |
| 10 to 14 Minutes | 10 | 41.7% |
| 15 to 19 Minutes | 9 | 37.5% |
| 20 to 24 Minutes | 0 | 0.0% |
| 25 to 29 Minutes | 0 | 0.0% |
| 30 to 34 Minutes | 0 | 0.0% |
| 35 to 39 Minutes | 0 | 0.0% |
| 40 to 44 Minutes | 0 | 0.0% |
| 45 to 59 Minutes | 0 | 0.0% |
| 60 to 89 Minutes | 0 | 0.0% |
| 90 or more Minutes | 0 | 0.0% |
Commute Time by Sex in Siasconset
The most common commute times in Siasconset are 15 to 19 minutes (9 commuters, 90.0%) for males and 10 to 14 minutes (10 commuters, 71.4%) for females.
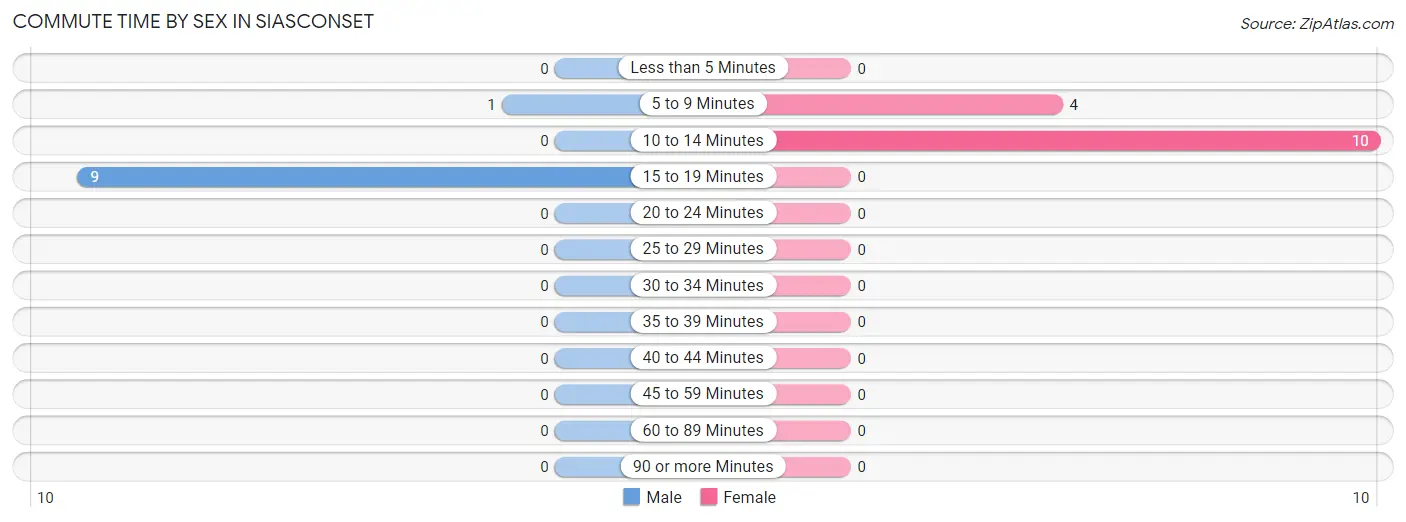
| Commute Time | Male | Female |
| Less than 5 Minutes | 0 (0.0%) | 0 (0.0%) |
| 5 to 9 Minutes | 1 (10.0%) | 4 (28.6%) |
| 10 to 14 Minutes | 0 (0.0%) | 10 (71.4%) |
| 15 to 19 Minutes | 9 (90.0%) | 0 (0.0%) |
| 20 to 24 Minutes | 0 (0.0%) | 0 (0.0%) |
| 25 to 29 Minutes | 0 (0.0%) | 0 (0.0%) |
| 30 to 34 Minutes | 0 (0.0%) | 0 (0.0%) |
| 35 to 39 Minutes | 0 (0.0%) | 0 (0.0%) |
| 40 to 44 Minutes | 0 (0.0%) | 0 (0.0%) |
| 45 to 59 Minutes | 0 (0.0%) | 0 (0.0%) |
| 60 to 89 Minutes | 0 (0.0%) | 0 (0.0%) |
| 90 or more Minutes | 0 (0.0%) | 0 (0.0%) |
Time of Departure to Work by Sex in Siasconset
The most frequent times of departure to work in Siasconset are 7:30 AM to 7:59 AM (9, 90.0%) for males and 7:30 AM to 7:59 AM (11, 78.6%) for females.
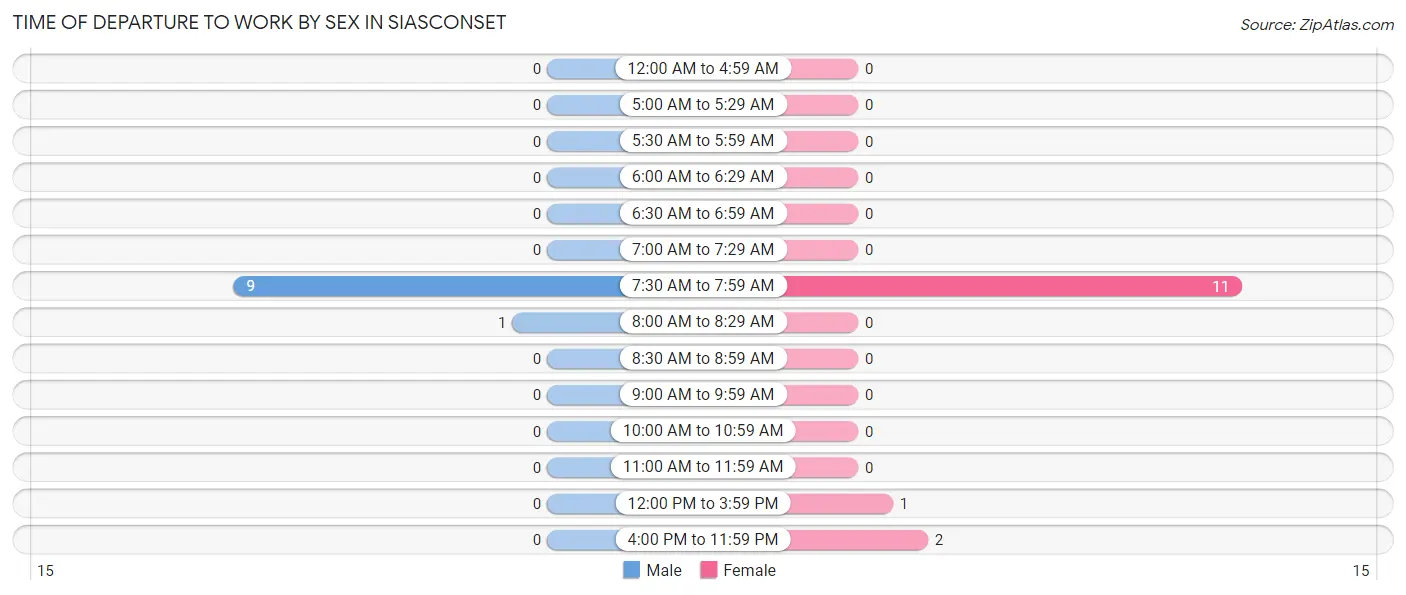
| Time of Departure | Male | Female |
| 12:00 AM to 4:59 AM | 0 (0.0%) | 0 (0.0%) |
| 5:00 AM to 5:29 AM | 0 (0.0%) | 0 (0.0%) |
| 5:30 AM to 5:59 AM | 0 (0.0%) | 0 (0.0%) |
| 6:00 AM to 6:29 AM | 0 (0.0%) | 0 (0.0%) |
| 6:30 AM to 6:59 AM | 0 (0.0%) | 0 (0.0%) |
| 7:00 AM to 7:29 AM | 0 (0.0%) | 0 (0.0%) |
| 7:30 AM to 7:59 AM | 9 (90.0%) | 11 (78.6%) |
| 8:00 AM to 8:29 AM | 1 (10.0%) | 0 (0.0%) |
| 8:30 AM to 8:59 AM | 0 (0.0%) | 0 (0.0%) |
| 9:00 AM to 9:59 AM | 0 (0.0%) | 0 (0.0%) |
| 10:00 AM to 10:59 AM | 0 (0.0%) | 0 (0.0%) |
| 11:00 AM to 11:59 AM | 0 (0.0%) | 0 (0.0%) |
| 12:00 PM to 3:59 PM | 0 (0.0%) | 1 (7.1%) |
| 4:00 PM to 11:59 PM | 0 (0.0%) | 2 (14.3%) |
| Total | 10 (100.0%) | 14 (100.0%) |
Housing Occupancy in Siasconset
Occupancy by Ownership in Siasconset
Of the total 54 dwellings in Siasconset, owner-occupied units account for 54 (100.0%), while renter-occupied units make up 0 (0.0%).
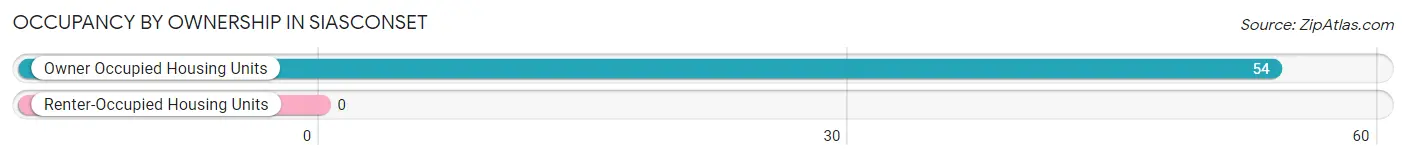
| Occupancy | # Housing Units | % Housing Units |
| Owner Occupied Housing Units | 54 | 100.0% |
| Renter-Occupied Housing Units | 0 | 0.0% |
| Total Occupied Housing Units | 54 | 100.0% |
Occupancy by Household Size in Siasconset
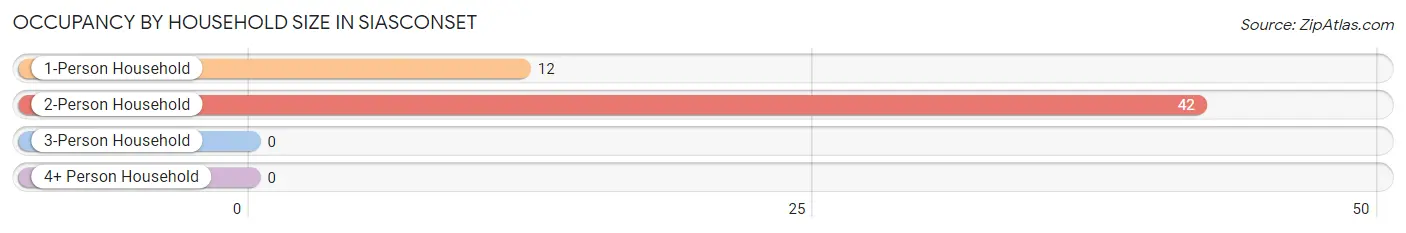
| Household Size | # Housing Units | % Housing Units |
| 1-Person Household | 12 | 22.2% |
| 2-Person Household | 42 | 77.8% |
| 3-Person Household | 0 | 0.0% |
| 4+ Person Household | 0 | 0.0% |
| Total Housing Units | 54 | 100.0% |
Occupancy by Ownership by Household Size in Siasconset
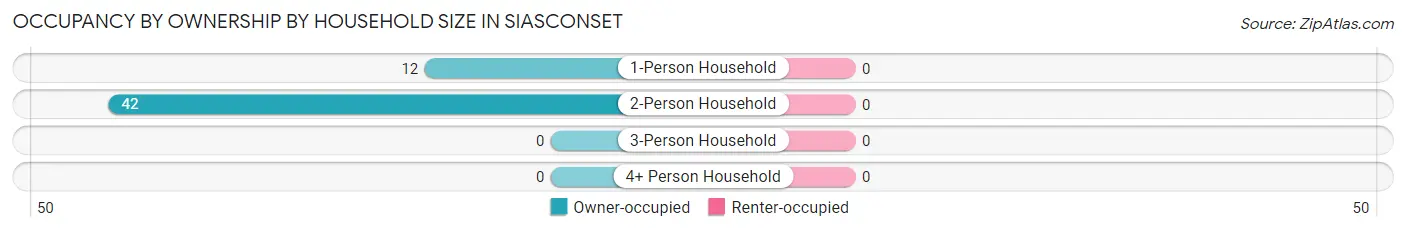
| Household Size | Owner-occupied | Renter-occupied |
| 1-Person Household | 12 (100.0%) | 0 (0.0%) |
| 2-Person Household | 42 (100.0%) | 0 (0.0%) |
| 3-Person Household | 0 (0.0%) | 0 (0.0%) |
| 4+ Person Household | 0 (0.0%) | 0 (0.0%) |
| Total Housing Units | 54 (100.0%) | 0 (0.0%) |
Occupancy by Educational Attainment in Siasconset
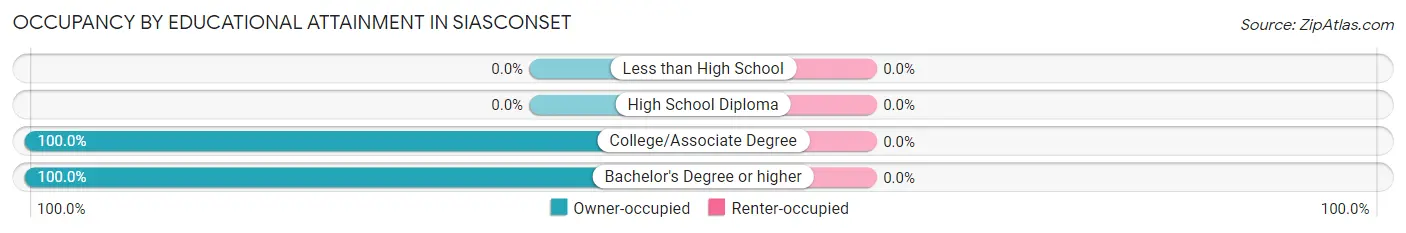
| Household Size | Owner-occupied | Renter-occupied |
| Less than High School | 0 (0.0%) | 0 (0.0%) |
| High School Diploma | 0 (0.0%) | 0 (0.0%) |
| College/Associate Degree | 28 (100.0%) | 0 (0.0%) |
| Bachelor's Degree or higher | 26 (100.0%) | 0 (0.0%) |
Occupancy by Age of Householder in Siasconset

| Age Bracket | # Households | % Households |
| Under 35 Years | 0 | 0.0% |
| 35 to 44 Years | 0 | 0.0% |
| 45 to 54 Years | 0 | 0.0% |
| 55 to 64 Years | 21 | 38.9% |
| 65 to 74 Years | 0 | 0.0% |
| 75 to 84 Years | 33 | 61.1% |
| 85 Years and Over | 0 | 0.0% |
| Total | 54 | 100.0% |
Housing Finances in Siasconset
Median Income by Occupancy in Siasconset
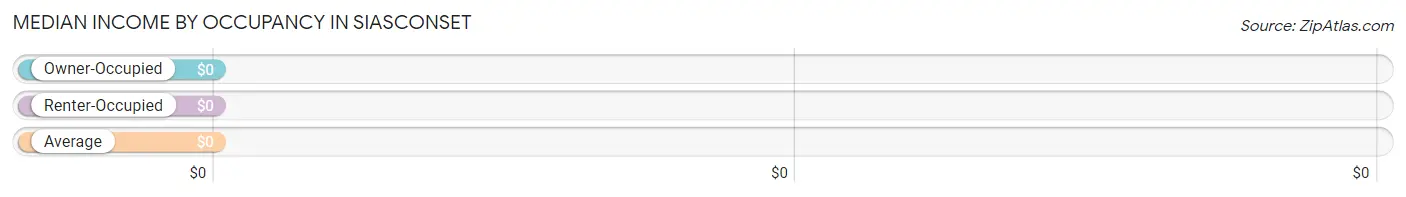
| Occupancy Type | # Households | Median Income |
| Owner-Occupied | 54 (100.0%) | $0 |
| Renter-Occupied | 0 (0.0%) | $0 |
| Average | 54 (100.0%) | $0 |
Occupancy by Householder Income Bracket in Siasconset
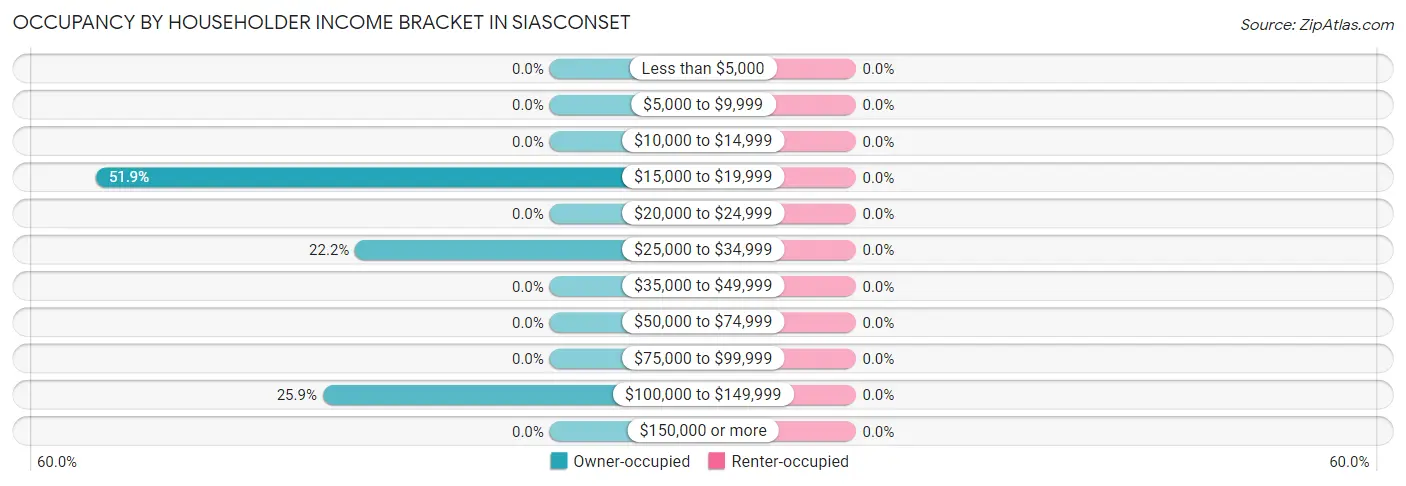
| Income Bracket | Owner-occupied | Renter-occupied |
| Less than $5,000 | 0 (0.0%) | 0 (0.0%) |
| $5,000 to $9,999 | 0 (0.0%) | 0 (0.0%) |
| $10,000 to $14,999 | 0 (0.0%) | 0 (0.0%) |
| $15,000 to $19,999 | 28 (51.8%) | 0 (0.0%) |
| $20,000 to $24,999 | 0 (0.0%) | 0 (0.0%) |
| $25,000 to $34,999 | 12 (22.2%) | 0 (0.0%) |
| $35,000 to $49,999 | 0 (0.0%) | 0 (0.0%) |
| $50,000 to $74,999 | 0 (0.0%) | 0 (0.0%) |
| $75,000 to $99,999 | 0 (0.0%) | 0 (0.0%) |
| $100,000 to $149,999 | 14 (25.9%) | 0 (0.0%) |
| $150,000 or more | 0 (0.0%) | 0 (0.0%) |
| Total | 54 (100.0%) | 0 (0.0%) |
Monthly Housing Cost Tiers in Siasconset
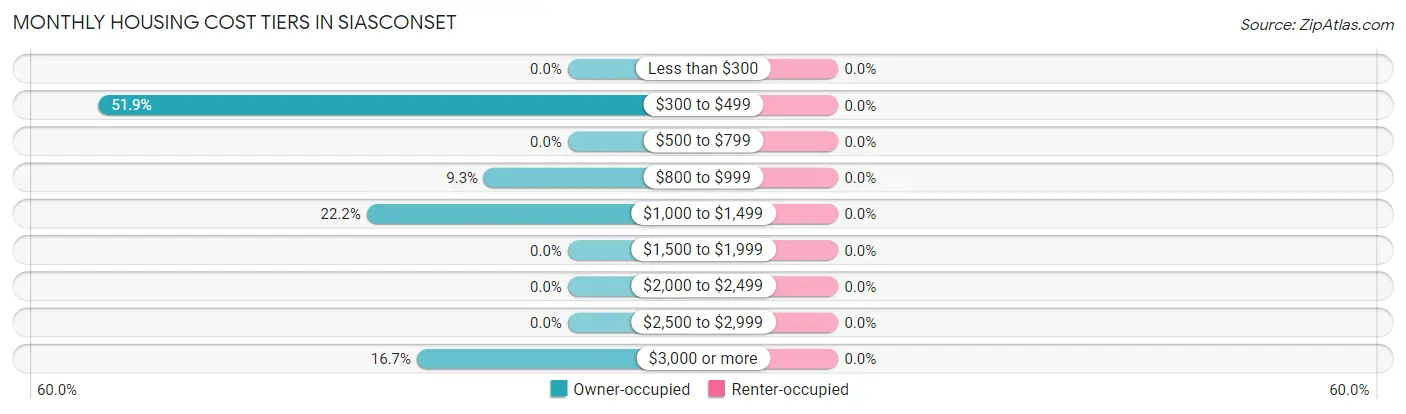
| Monthly Cost | Owner-occupied | Renter-occupied |
| Less than $300 | 0 (0.0%) | 0 (0.0%) |
| $300 to $499 | 28 (51.8%) | 0 (0.0%) |
| $500 to $799 | 0 (0.0%) | 0 (0.0%) |
| $800 to $999 | 5 (9.3%) | 0 (0.0%) |
| $1,000 to $1,499 | 12 (22.2%) | 0 (0.0%) |
| $1,500 to $1,999 | 0 (0.0%) | 0 (0.0%) |
| $2,000 to $2,499 | 0 (0.0%) | 0 (0.0%) |
| $2,500 to $2,999 | 0 (0.0%) | 0 (0.0%) |
| $3,000 or more | 9 (16.7%) | 0 (0.0%) |
| Total | 54 (100.0%) | 0 (0.0%) |
Physical Housing Characteristics in Siasconset
Housing Structures in Siasconset
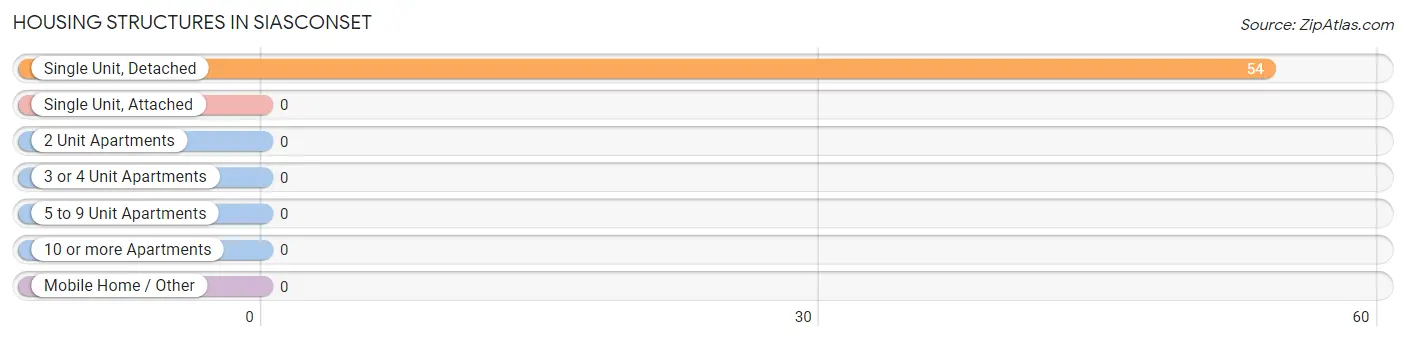
| Structure Type | # Housing Units | % Housing Units |
| Single Unit, Detached | 54 | 100.0% |
| Single Unit, Attached | 0 | 0.0% |
| 2 Unit Apartments | 0 | 0.0% |
| 3 or 4 Unit Apartments | 0 | 0.0% |
| 5 to 9 Unit Apartments | 0 | 0.0% |
| 10 or more Apartments | 0 | 0.0% |
| Mobile Home / Other | 0 | 0.0% |
| Total | 54 | 100.0% |
Housing Structures by Occupancy in Siasconset
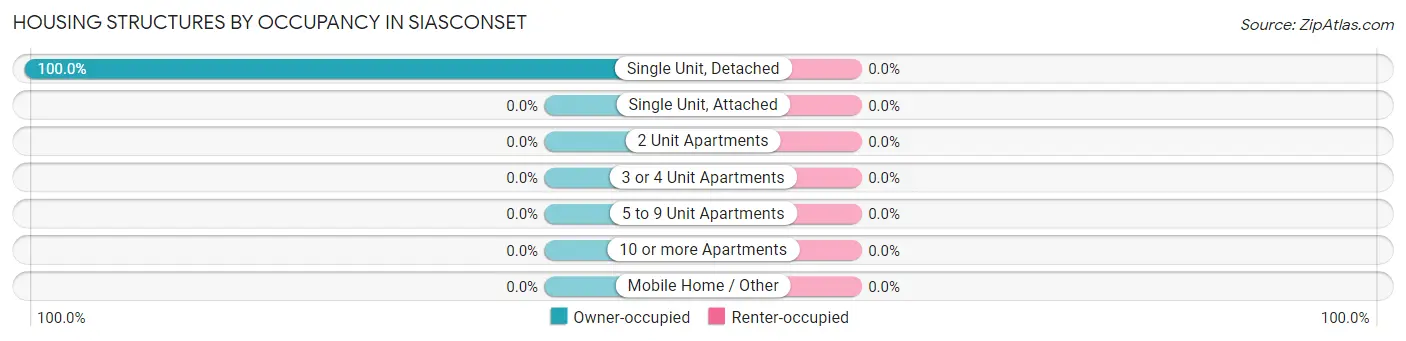
| Structure Type | Owner-occupied | Renter-occupied |
| Single Unit, Detached | 54 (100.0%) | 0 (0.0%) |
| Single Unit, Attached | 0 (0.0%) | 0 (0.0%) |
| 2 Unit Apartments | 0 (0.0%) | 0 (0.0%) |
| 3 or 4 Unit Apartments | 0 (0.0%) | 0 (0.0%) |
| 5 to 9 Unit Apartments | 0 (0.0%) | 0 (0.0%) |
| 10 or more Apartments | 0 (0.0%) | 0 (0.0%) |
| Mobile Home / Other | 0 (0.0%) | 0 (0.0%) |
| Total | 54 (100.0%) | 0 (0.0%) |
Housing Structures by Number of Rooms in Siasconset
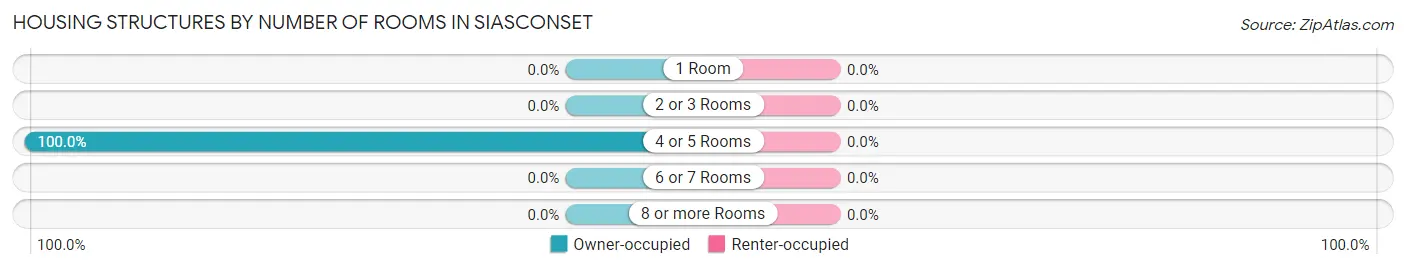
| Number of Rooms | Owner-occupied | Renter-occupied |
| 1 Room | 0 (0.0%) | 0 (0.0%) |
| 2 or 3 Rooms | 0 (0.0%) | 0 (0.0%) |
| 4 or 5 Rooms | 54 (100.0%) | 0 (0.0%) |
| 6 or 7 Rooms | 0 (0.0%) | 0 (0.0%) |
| 8 or more Rooms | 0 (0.0%) | 0 (0.0%) |
| Total | 54 (100.0%) | 0 (0.0%) |
Housing Structure by Heating Type in Siasconset
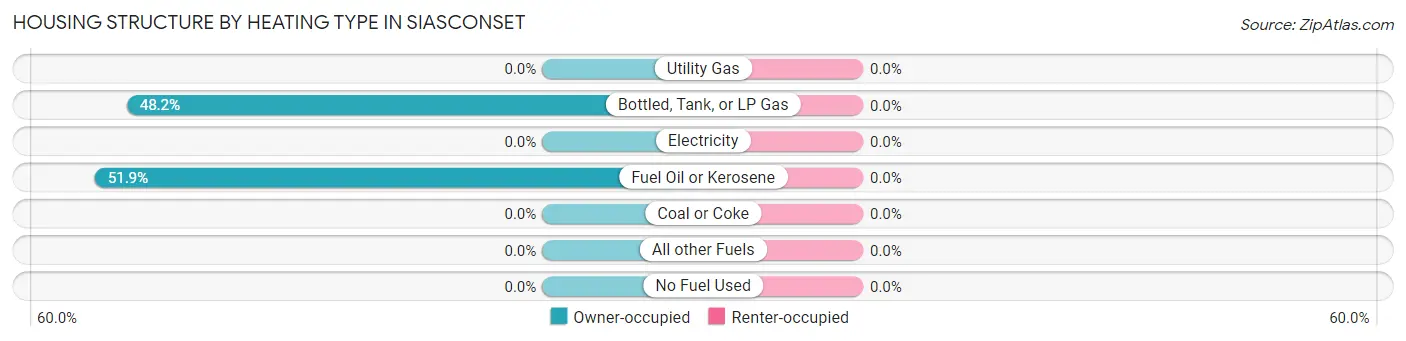
| Heating Type | Owner-occupied | Renter-occupied |
| Utility Gas | 0 (0.0%) | 0 (0.0%) |
| Bottled, Tank, or LP Gas | 26 (48.1%) | 0 (0.0%) |
| Electricity | 0 (0.0%) | 0 (0.0%) |
| Fuel Oil or Kerosene | 28 (51.8%) | 0 (0.0%) |
| Coal or Coke | 0 (0.0%) | 0 (0.0%) |
| All other Fuels | 0 (0.0%) | 0 (0.0%) |
| No Fuel Used | 0 (0.0%) | 0 (0.0%) |
| Total | 54 (100.0%) | 0 (0.0%) |
Household Vehicle Usage in Siasconset
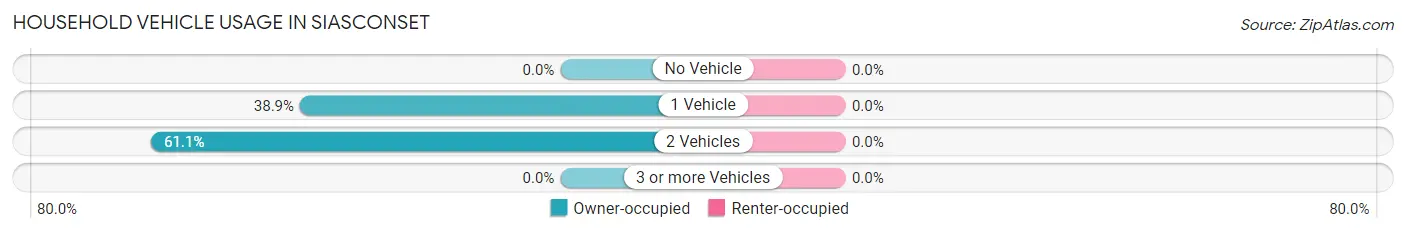
| Vehicles per Household | Owner-occupied | Renter-occupied |
| No Vehicle | 0 (0.0%) | 0 (0.0%) |
| 1 Vehicle | 21 (38.9%) | 0 (0.0%) |
| 2 Vehicles | 33 (61.1%) | 0 (0.0%) |
| 3 or more Vehicles | 0 (0.0%) | 0 (0.0%) |
| Total | 54 (100.0%) | 0 (0.0%) |
Real Estate & Mortgages in Siasconset
Real Estate and Mortgage Overview in Siasconset
| Characteristic | Without Mortgage | With Mortgage |
| Housing Units | 45 | 9 |
| Median Property Value | $1,200,900 | $0 |
| Median Household Income | - | - |
| Monthly Housing Costs | - | - |
| Real Estate Taxes | $3,196 | $0 |
Property Value by Mortgage Status in Siasconset
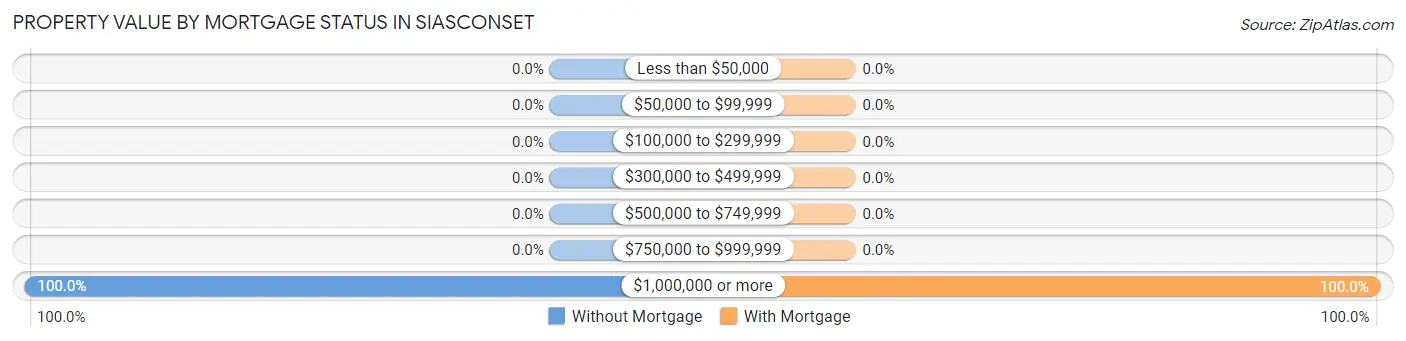
| Property Value | Without Mortgage | With Mortgage |
| Less than $50,000 | 0 (0.0%) | 0 (0.0%) |
| $50,000 to $99,999 | 0 (0.0%) | 0 (0.0%) |
| $100,000 to $299,999 | 0 (0.0%) | 0 (0.0%) |
| $300,000 to $499,999 | 0 (0.0%) | 0 (0.0%) |
| $500,000 to $749,999 | 0 (0.0%) | 0 (0.0%) |
| $750,000 to $999,999 | 0 (0.0%) | 0 (0.0%) |
| $1,000,000 or more | 45 (100.0%) | 9 (100.0%) |
| Total | 45 (100.0%) | 9 (100.0%) |
Household Income by Mortgage Status in Siasconset
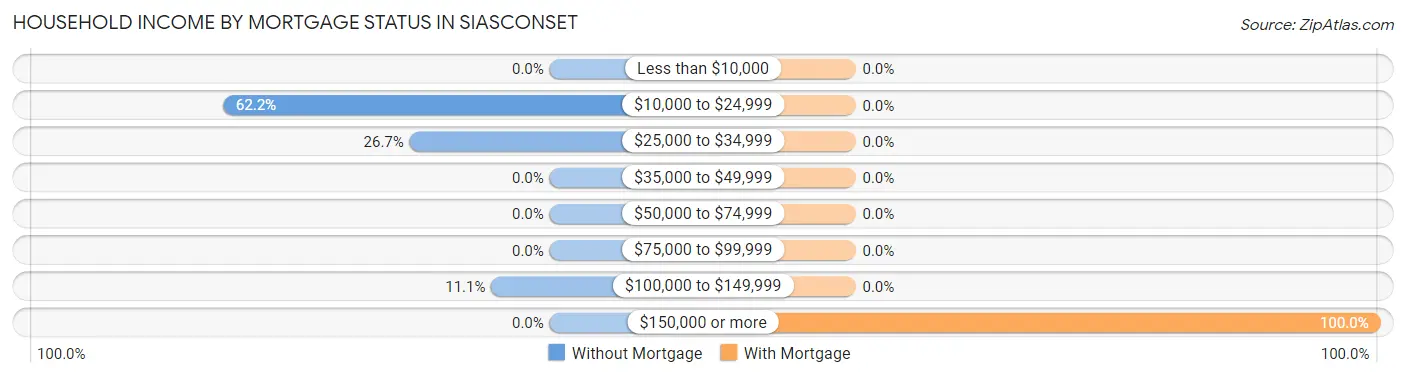
| Household Income | Without Mortgage | With Mortgage |
| Less than $10,000 | 0 (0.0%) | 0 (0.0%) |
| $10,000 to $24,999 | 28 (62.2%) | 0 (0.0%) |
| $25,000 to $34,999 | 12 (26.7%) | 0 (0.0%) |
| $35,000 to $49,999 | 0 (0.0%) | 0 (0.0%) |
| $50,000 to $74,999 | 0 (0.0%) | 0 (0.0%) |
| $75,000 to $99,999 | 0 (0.0%) | 0 (0.0%) |
| $100,000 to $149,999 | 5 (11.1%) | 0 (0.0%) |
| $150,000 or more | 0 (0.0%) | 9 (100.0%) |
| Total | 45 (100.0%) | 9 (100.0%) |
Property Value to Household Income Ratio in Siasconset
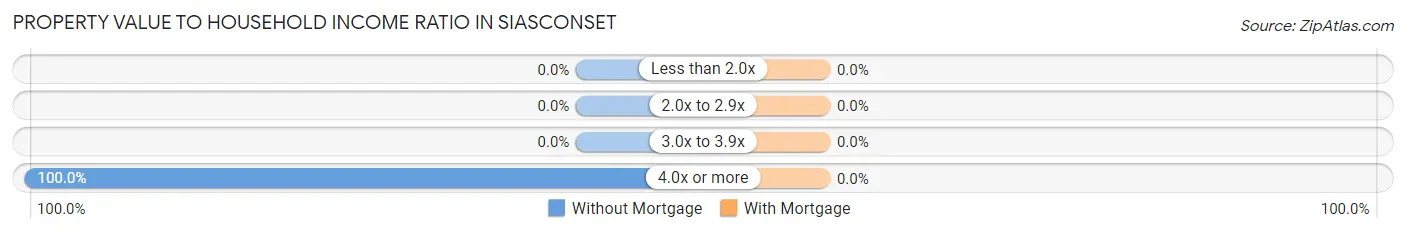
| Value-to-Income Ratio | Without Mortgage | With Mortgage |
| Less than 2.0x | 0 (0.0%) | 0 (0.0%) |
| 2.0x to 2.9x | 0 (0.0%) | 0 (0.0%) |
| 3.0x to 3.9x | 0 (0.0%) | 0 (0.0%) |
| 4.0x or more | 45 (100.0%) | 0 (0.0%) |
| Total | 45 (100.0%) | 9 (100.0%) |
Real Estate Taxes by Mortgage Status in Siasconset
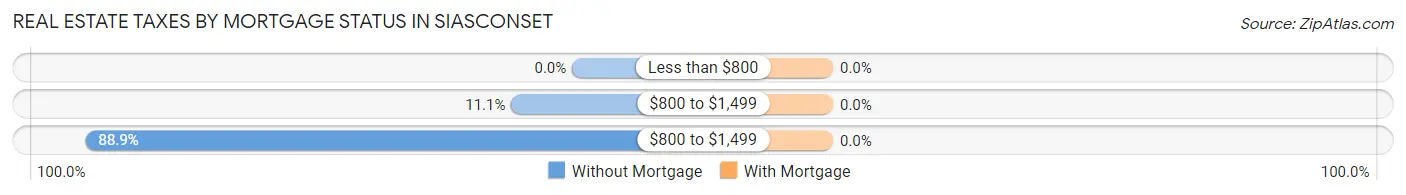
| Property Taxes | Without Mortgage | With Mortgage |
| Less than $800 | 0 (0.0%) | 0 (0.0%) |
| $800 to $1,499 | 5 (11.1%) | 0 (0.0%) |
| $800 to $1,499 | 40 (88.9%) | 0 (0.0%) |
| Total | 45 (100.0%) | 9 (100.0%) |
Health & Disability in Siasconset
Health Insurance Coverage by Age in Siasconset
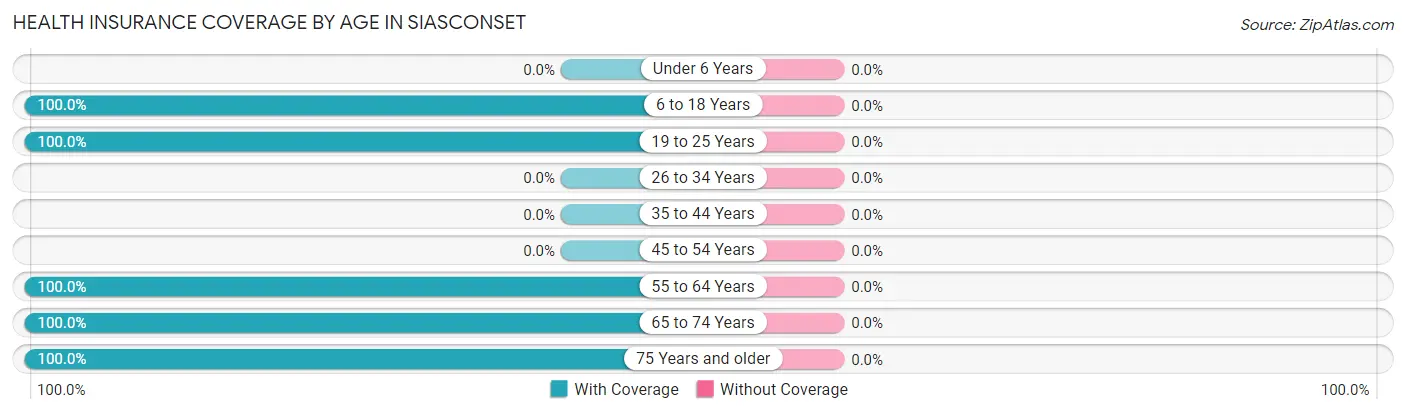
| Age Bracket | With Coverage | Without Coverage |
| Under 6 Years | 0 (0.0%) | 0 (0.0%) |
| 6 to 18 Years | 2 (100.0%) | 0 (0.0%) |
| 19 to 25 Years | 9 (100.0%) | 0 (0.0%) |
| 26 to 34 Years | 0 (0.0%) | 0 (0.0%) |
| 35 to 44 Years | 0 (0.0%) | 0 (0.0%) |
| 45 to 54 Years | 0 (0.0%) | 0 (0.0%) |
| 55 to 64 Years | 30 (100.0%) | 0 (0.0%) |
| 65 to 74 Years | 7 (100.0%) | 0 (0.0%) |
| 75 Years and older | 67 (100.0%) | 0 (0.0%) |
| Total | 115 (100.0%) | 0 (0.0%) |
Health Insurance Coverage by Citizenship Status in Siasconset
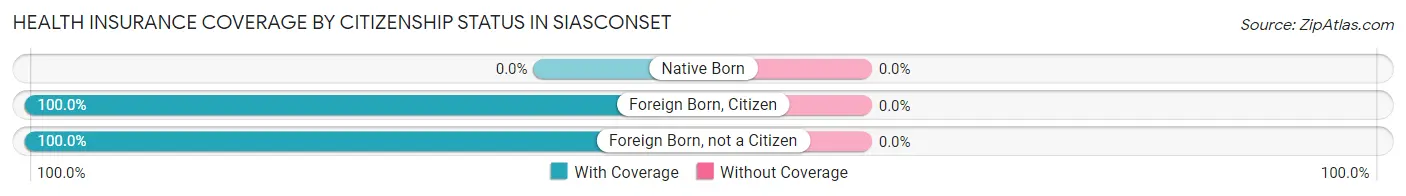
| Citizenship Status | With Coverage | Without Coverage |
| Native Born | 0 (0.0%) | 0 (0.0%) |
| Foreign Born, Citizen | 2 (100.0%) | 0 (0.0%) |
| Foreign Born, not a Citizen | 9 (100.0%) | 0 (0.0%) |
Health Insurance Coverage by Household Income in Siasconset
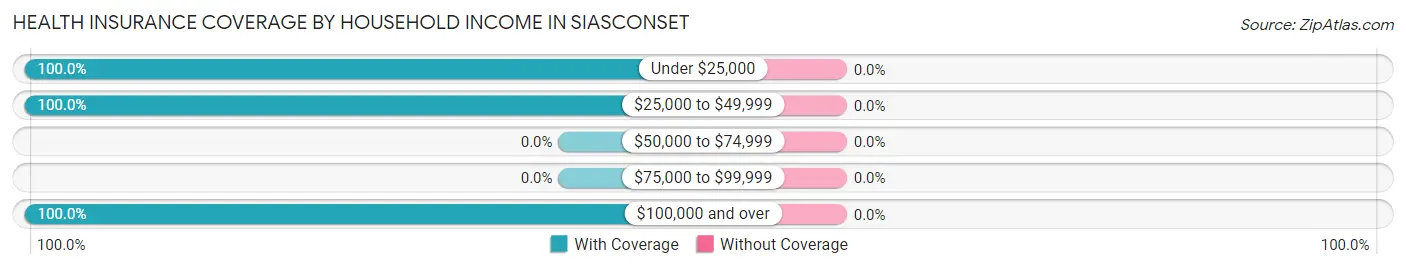
| Household Income | With Coverage | Without Coverage |
| Under $25,000 | 62 (100.0%) | 0 (0.0%) |
| $25,000 to $49,999 | 12 (100.0%) | 0 (0.0%) |
| $50,000 to $74,999 | 0 (0.0%) | 0 (0.0%) |
| $75,000 to $99,999 | 0 (0.0%) | 0 (0.0%) |
| $100,000 and over | 30 (100.0%) | 0 (0.0%) |
Public vs Private Health Insurance Coverage by Age in Siasconset
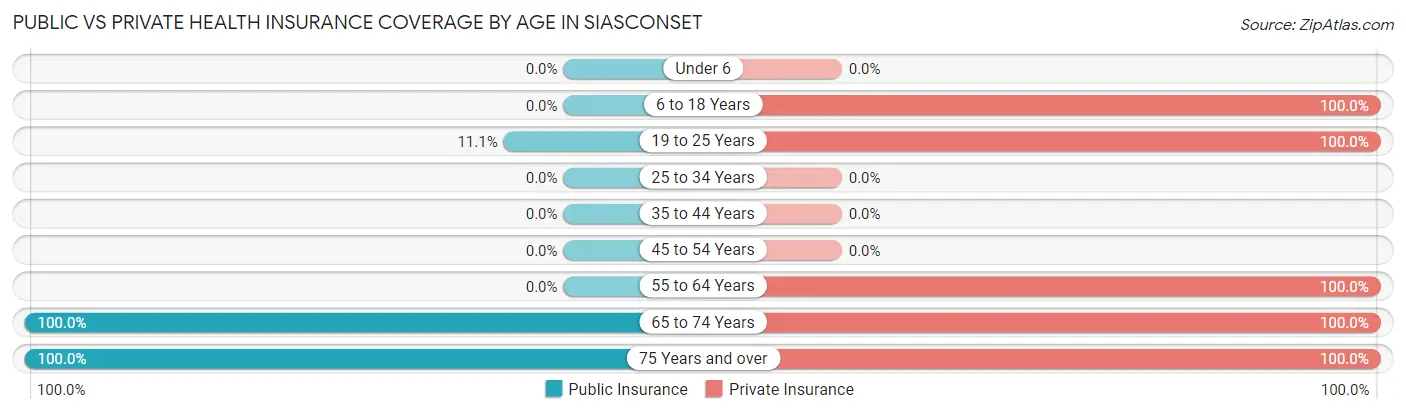
| Age Bracket | Public Insurance | Private Insurance |
| Under 6 | 0 (0.0%) | 0 (0.0%) |
| 6 to 18 Years | 0 (0.0%) | 2 (100.0%) |
| 19 to 25 Years | 1 (11.1%) | 9 (100.0%) |
| 25 to 34 Years | 0 (0.0%) | 0 (0.0%) |
| 35 to 44 Years | 0 (0.0%) | 0 (0.0%) |
| 45 to 54 Years | 0 (0.0%) | 0 (0.0%) |
| 55 to 64 Years | 0 (0.0%) | 30 (100.0%) |
| 65 to 74 Years | 7 (100.0%) | 7 (100.0%) |
| 75 Years and over | 67 (100.0%) | 67 (100.0%) |
| Total | 75 (65.2%) | 115 (100.0%) |
Disability Status by Sex by Age in Siasconset
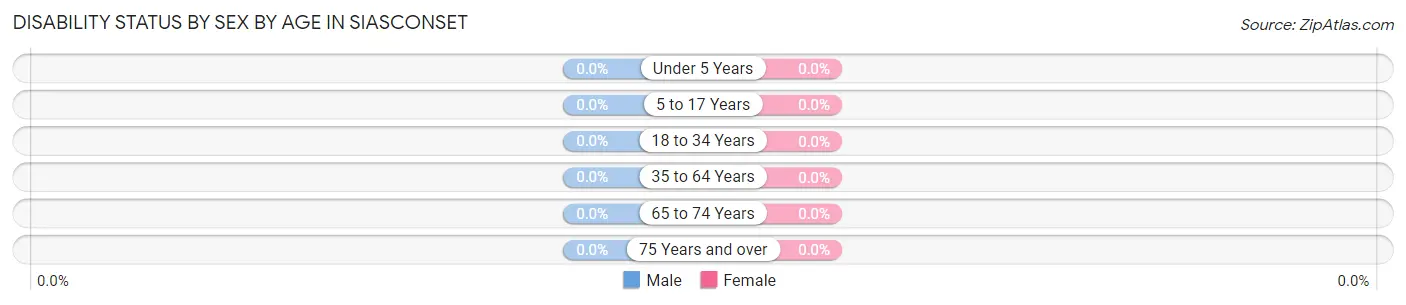
| Age Bracket | Male | Female |
| Under 5 Years | 0 (0.0%) | 0 (0.0%) |
| 5 to 17 Years | 0 (0.0%) | 0 (0.0%) |
| 18 to 34 Years | 0 (0.0%) | 0 (0.0%) |
| 35 to 64 Years | 0 (0.0%) | 0 (0.0%) |
| 65 to 74 Years | 0 (0.0%) | 0 (0.0%) |
| 75 Years and over | 0 (0.0%) | 0 (0.0%) |
Disability Class by Sex by Age in Siasconset
Disability Class: Hearing Difficulty
| Age Bracket | Male | Female |
| Under 5 Years | 0 (0.0%) | 0 (0.0%) |
| 5 to 17 Years | 0 (0.0%) | 0 (0.0%) |
| 18 to 34 Years | 0 (0.0%) | 0 (0.0%) |
| 35 to 64 Years | 0 (0.0%) | 0 (0.0%) |
| 65 to 74 Years | 0 (0.0%) | 0 (0.0%) |
| 75 Years and over | 0 (0.0%) | 0 (0.0%) |
Disability Class: Vision Difficulty
| Age Bracket | Male | Female |
| Under 5 Years | 0 (0.0%) | 0 (0.0%) |
| 5 to 17 Years | 0 (0.0%) | 0 (0.0%) |
| 18 to 34 Years | 0 (0.0%) | 0 (0.0%) |
| 35 to 64 Years | 0 (0.0%) | 0 (0.0%) |
| 65 to 74 Years | 0 (0.0%) | 0 (0.0%) |
| 75 Years and over | 0 (0.0%) | 0 (0.0%) |
Disability Class: Cognitive Difficulty

| Age Bracket | Male | Female |
| 5 to 17 Years | 0 (0.0%) | 0 (0.0%) |
| 18 to 34 Years | 0 (0.0%) | 0 (0.0%) |
| 35 to 64 Years | 0 (0.0%) | 0 (0.0%) |
| 65 to 74 Years | 0 (0.0%) | 0 (0.0%) |
| 75 Years and over | 0 (0.0%) | 0 (0.0%) |
Disability Class: Ambulatory Difficulty
| Age Bracket | Male | Female |
| 5 to 17 Years | 0 (0.0%) | 0 (0.0%) |
| 18 to 34 Years | 0 (0.0%) | 0 (0.0%) |
| 35 to 64 Years | 0 (0.0%) | 0 (0.0%) |
| 65 to 74 Years | 0 (0.0%) | 0 (0.0%) |
| 75 Years and over | 0 (0.0%) | 0 (0.0%) |
Disability Class: Self-Care Difficulty
| Age Bracket | Male | Female |
| 5 to 17 Years | 0 (0.0%) | 0 (0.0%) |
| 18 to 34 Years | 0 (0.0%) | 0 (0.0%) |
| 35 to 64 Years | 0 (0.0%) | 0 (0.0%) |
| 65 to 74 Years | 0 (0.0%) | 0 (0.0%) |
| 75 Years and over | 0 (0.0%) | 0 (0.0%) |
Technology Access in Siasconset
Computing Device Access in Siasconset
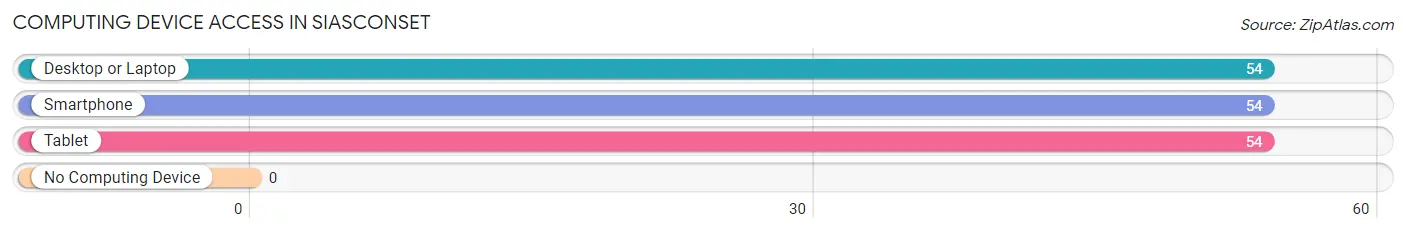
| Device Type | # Households | % Households |
| Desktop or Laptop | 54 | 100.0% |
| Smartphone | 54 | 100.0% |
| Tablet | 54 | 100.0% |
| No Computing Device | 0 | 0.0% |
| Total | 54 | 100.0% |
Internet Access in Siasconset
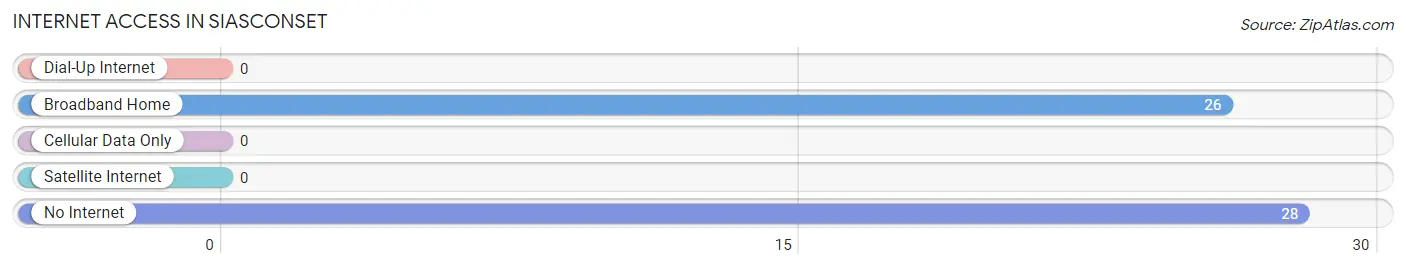
| Internet Type | # Households | % Households |
| Dial-Up Internet | 0 | 0.0% |
| Broadband Home | 26 | 48.1% |
| Cellular Data Only | 0 | 0.0% |
| Satellite Internet | 0 | 0.0% |
| No Internet | 28 | 51.8% |
| Total | 54 | 100.0% |
Siasconset Summary
Siasconset, MA is a small village located on the eastern end of Nantucket Island, off the coast of Massachusetts. It is a popular tourist destination, known for its picturesque beaches, quaint shops, and historic homes. The village is also home to a variety of wildlife, including seals, whales, and a variety of birds.
History
Siasconset was first settled in the early 1700s by English settlers. The village was originally known as “Sankaty”, which is derived from the Wampanoag word for “place of the sea”. The village was a popular fishing and whaling port, and was home to a variety of industries, including shipbuilding, fishing, and whaling.
In the late 1800s, Siasconset began to attract wealthy summer visitors from Boston and New York. These visitors built large summer homes in the village, and the area became known as “Sconset”. The village was incorporated in 1872, and the name was officially changed to Siasconset.
Geography
Siasconset is located on the eastern end of Nantucket Island, off the coast of Massachusetts. The village is bordered by the Atlantic Ocean to the east, and the Nantucket Sound to the west. The village is approximately 4.5 square miles in size, and is home to a variety of wildlife, including seals, whales, and a variety of birds.
The village is known for its picturesque beaches, which are popular with tourists and locals alike. The beaches are also home to a variety of wildlife, including seals, whales, and a variety of birds.
Economy
The economy of Siasconset is largely based on tourism. The village is a popular destination for tourists, who come to enjoy the beaches, shops, and historic homes. The village is also home to a variety of restaurants, hotels, and other businesses that cater to tourists.
In addition to tourism, Siasconset is also home to a variety of fishing and whaling businesses. These businesses provide employment for many of the village’s residents.
Demographics
As of the 2010 census, the population of Siasconset was 545. The village is predominantly white (94.3%), with a small minority population (5.7%). The median household income is $68,750, and the median age is 48.
Conclusion
Siasconset, MA is a small village located on the eastern end of Nantucket Island, off the coast of Massachusetts. It is a popular tourist destination, known for its picturesque beaches, quaint shops, and historic homes. The village is also home to a variety of wildlife, including seals, whales, and a variety of birds. The economy of Siasconset is largely based on tourism, and the village is home to a variety of fishing and whaling businesses. As of the 2010 census, the population of Siasconset was 545, and the median household income is $68,750.
Common Questions
What is the Total Population of Siasconset?
Total Population of Siasconset is 115.
What is the Total Male Population of Siasconset?
Total Male Population of Siasconset is 53.
What is the Total Female Population of Siasconset?
Total Female Population of Siasconset is 62.
What is the Ratio of Males per 100 Females in Siasconset?
There are 85.48 Males per 100 Females in Siasconset.
What is the Ratio of Females per 100 Males in Siasconset?
There are 116.98 Females per 100 Males in Siasconset.
What is the Median Population Age in Siasconset?
Median Population Age in Siasconset is 76.3 Years.
What is the Average Family Size in Siasconset
Average Family Size in Siasconset is 2.2 People.
What is the Average Household Size in Siasconset
Average Household Size in Siasconset is 1.9 People.
What is Per Capita Income in Siasconset?
Per Capita income in Siasconset is $24,223.
What is Inequality or Gini Index in Siasconset?
Inequality or Gini Index in Siasconset is 0.48.
How Large is the Labor Force in Siasconset?
There are 26 People in the Labor Forcein in Siasconset.
What is the Percentage of People in the Labor Force in Siasconset?
22.6% of People are in the Labor Force in Siasconset.