Cities with the Most Immigrants from Taiwan in Missouri
RELATED REPORTS & OPTIONS
Taiwan
Missouri
Compare Cities
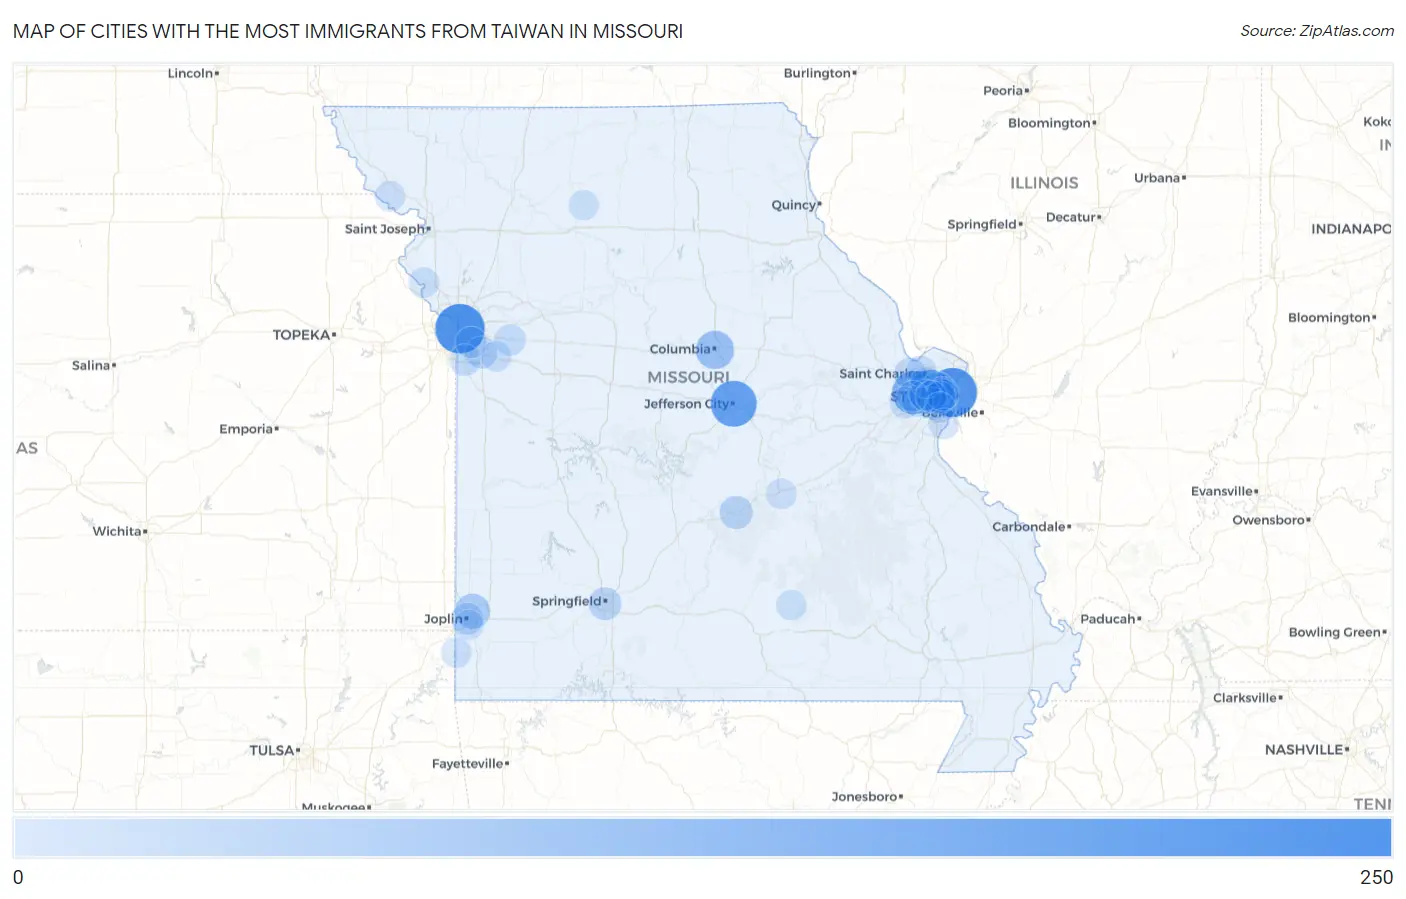
Map of Cities with the Most Immigrants from Taiwan in Missouri
0
250
Cities with the Most Immigrants from Taiwan in Missouri
| City | Taiwan | vs State | vs National | |
| 1. | Kansas City | 225 | 1,927(11.68%)#1 | 376,336(0.06%)#241 |
| 2. | St Louis | 220 | 1,927(11.42%)#2 | 376,336(0.06%)#248 |
| 3. | Jefferson City | 182 | 1,927(9.44%)#3 | 376,336(0.05%)#296 |
| 4. | Chesterfield | 151 | 1,927(7.84%)#4 | 376,336(0.04%)#346 |
| 5. | Creve Coeur | 149 | 1,927(7.73%)#5 | 376,336(0.04%)#349 |
| 6. | Columbia | 90 | 1,927(4.67%)#6 | 376,336(0.02%)#527 |
| 7. | Ladue | 61 | 1,927(3.17%)#7 | 376,336(0.02%)#765 |
| 8. | Webb City | 55 | 1,927(2.85%)#8 | 376,336(0.01%)#822 |
| 9. | Frontenac | 39 | 1,927(2.02%)#9 | 376,336(0.01%)#1,033 |
| 10. | Olivette | 37 | 1,927(1.92%)#10 | 376,336(0.01%)#1,072 |
| 11. | Clayton | 34 | 1,927(1.76%)#11 | 376,336(0.01%)#1,124 |
| 12. | St Robert | 34 | 1,927(1.76%)#12 | 376,336(0.01%)#1,131 |
| 13. | Springfield | 29 | 1,927(1.50%)#13 | 376,336(0.01%)#1,235 |
| 14. | Lee S Summit | 23 | 1,927(1.19%)#14 | 376,336(0.01%)#1,394 |
| 15. | St Peters | 19 | 1,927(0.99%)#15 | 376,336(0.01%)#1,551 |
| 16. | Joplin | 18 | 1,927(0.93%)#16 | 376,336(0.00%)#1,595 |
| 17. | Kirkwood | 18 | 1,927(0.93%)#17 | 376,336(0.00%)#1,603 |
| 18. | Brentwood | 18 | 1,927(0.93%)#18 | 376,336(0.00%)#1,621 |
| 19. | Wildwood | 16 | 1,927(0.83%)#19 | 376,336(0.00%)#1,690 |
| 20. | Richmond Heights | 16 | 1,927(0.83%)#20 | 376,336(0.00%)#1,719 |
| 21. | Grandview | 15 | 1,927(0.78%)#21 | 376,336(0.00%)#1,756 |
| 22. | Oak Grove | 15 | 1,927(0.78%)#22 | 376,336(0.00%)#1,778 |
| 23. | Raytown | 14 | 1,927(0.73%)#23 | 376,336(0.00%)#1,813 |
| 24. | Ballwin | 13 | 1,927(0.67%)#24 | 376,336(0.00%)#1,871 |
| 25. | Maryland Heights | 10 | 1,927(0.52%)#25 | 376,336(0.00%)#2,056 |
| 26. | Town And Country | 10 | 1,927(0.52%)#26 | 376,336(0.00%)#2,081 |
| 27. | St Charles | 8 | 1,927(0.42%)#27 | 376,336(0.00%)#2,190 |
| 28. | Clarkson Valley | 8 | 1,927(0.42%)#28 | 376,336(0.00%)#2,240 |
| 29. | Crystal Lake Park | 8 | 1,927(0.42%)#29 | 376,336(0.00%)#2,253 |
| 30. | Oakville | 7 | 1,927(0.36%)#30 | 376,336(0.00%)#2,259 |
| 31. | Weston | 7 | 1,927(0.36%)#31 | 376,336(0.00%)#2,310 |
| 32. | Lake Lotawana | 6 | 1,927(0.31%)#32 | 376,336(0.00%)#2,371 |
| 33. | Rolla | 5 | 1,927(0.26%)#33 | 376,336(0.00%)#2,411 |
| 34. | Seneca | 5 | 1,927(0.26%)#34 | 376,336(0.00%)#2,434 |
| 35. | Grantwood Village | 5 | 1,927(0.26%)#35 | 376,336(0.00%)#2,443 |
| 36. | Forest City | 3 | 1,927(0.16%)#36 | 376,336(0.00%)#2,545 |
| 37. | Summersville | 2 | 1,927(0.10%)#37 | 376,336(0.00%)#2,598 |
| 38. | Chula | 2 | 1,927(0.10%)#38 | 376,336(0.00%)#2,602 |
| 39. | Leawood | 1 | 1,927(0.05%)#39 | 376,336(0.00%)#2,647 |
Common Questions
What are the Top 10 Cities with the Most Immigrants from Taiwan in Missouri?
Top 10 Cities with the Most Immigrants from Taiwan in Missouri are:
#1
225
#2
220
#3
182
#4
151
#5
149
#6
90
#7
61
#8
55
#9
39
#10
37
What city has the Most Immigrants from Taiwan in Missouri?
Kansas City has the Most Immigrants from Taiwan in Missouri with 225.
What is the Total Immigrants from Taiwan in the State of Missouri?
Total Immigrants from Taiwan in Missouri is 1,927.
What is the Total Immigrants from Taiwan in the United States?
Total Immigrants from Taiwan in the United States is 376,336.