Cities with the Most Immigrants from Taiwan in Oregon
RELATED REPORTS & OPTIONS
Taiwan
Oregon
Compare Cities
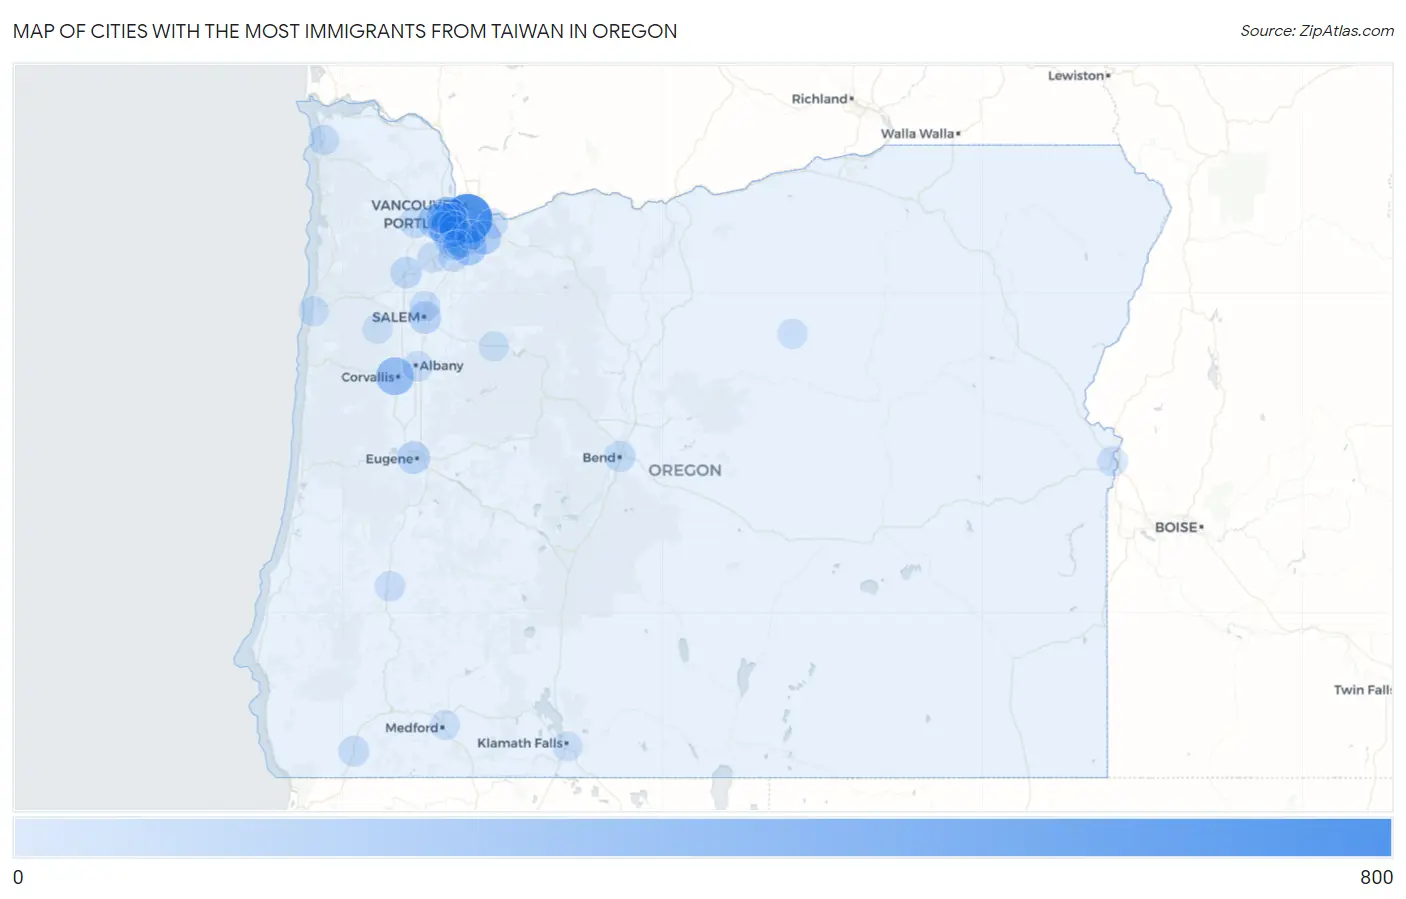
Map of Cities with the Most Immigrants from Taiwan in Oregon
0
800
Cities with the Most Immigrants from Taiwan in Oregon
| City | Taiwan | vs State | vs National | |
| 1. | Portland | 630 | 3,319(18.98%)#1 | 376,336(0.17%)#89 |
| 2. | Bethany | 276 | 3,319(8.32%)#2 | 376,336(0.07%)#200 |
| 3. | Beaverton | 263 | 3,319(7.92%)#3 | 376,336(0.07%)#205 |
| 4. | Corvallis | 248 | 3,319(7.47%)#4 | 376,336(0.07%)#217 |
| 5. | West Linn | 177 | 3,319(5.33%)#5 | 376,336(0.05%)#304 |
| 6. | Lake Oswego | 159 | 3,319(4.79%)#6 | 376,336(0.04%)#334 |
| 7. | Hillsboro | 133 | 3,319(4.01%)#7 | 376,336(0.04%)#394 |
| 8. | Happy Valley | 130 | 3,319(3.92%)#8 | 376,336(0.03%)#401 |
| 9. | Cedar Mill | 121 | 3,319(3.65%)#9 | 376,336(0.03%)#431 |
| 10. | Eugene | 86 | 3,319(2.59%)#10 | 376,336(0.02%)#554 |
| 11. | Marlene | 77 | 3,319(2.32%)#11 | 376,336(0.02%)#628 |
| 12. | Salem | 76 | 3,319(2.29%)#12 | 376,336(0.02%)#629 |
| 13. | Tigard | 57 | 3,319(1.72%)#13 | 376,336(0.02%)#797 |
| 14. | Oak Hills | 55 | 3,319(1.66%)#14 | 376,336(0.01%)#823 |
| 15. | Mcminnville | 50 | 3,319(1.51%)#15 | 376,336(0.01%)#882 |
| 16. | Aloha | 46 | 3,319(1.39%)#16 | 376,336(0.01%)#921 |
| 17. | Forest Grove | 36 | 3,319(1.08%)#17 | 376,336(0.01%)#1,078 |
| 18. | Garden Home Whitford | 36 | 3,319(1.08%)#18 | 376,336(0.01%)#1,089 |
| 19. | Bend | 34 | 3,319(1.02%)#19 | 376,336(0.01%)#1,115 |
| 20. | Wilsonville | 29 | 3,319(0.87%)#20 | 376,336(0.01%)#1,241 |
| 21. | Rockcreek | 27 | 3,319(0.81%)#21 | 376,336(0.01%)#1,306 |
| 22. | Cave Junction | 23 | 3,319(0.69%)#22 | 376,336(0.01%)#1,427 |
| 23. | Keizer | 20 | 3,319(0.60%)#23 | 376,336(0.01%)#1,505 |
| 24. | Falcon Heights | 19 | 3,319(0.57%)#24 | 376,336(0.01%)#1,589 |
| 25. | Albany | 17 | 3,319(0.51%)#25 | 376,336(0.00%)#1,639 |
| 26. | Gearhart | 16 | 3,319(0.48%)#26 | 376,336(0.00%)#1,731 |
| 27. | River Road | 15 | 3,319(0.45%)#27 | 376,336(0.00%)#1,776 |
| 28. | Newberg | 14 | 3,319(0.42%)#28 | 376,336(0.00%)#1,819 |
| 29. | West Slope | 12 | 3,319(0.36%)#29 | 376,336(0.00%)#1,949 |
| 30. | Roseburg | 11 | 3,319(0.33%)#30 | 376,336(0.00%)#1,995 |
| 31. | Ontario | 10 | 3,319(0.30%)#31 | 376,336(0.00%)#2,080 |
| 32. | Gresham | 9 | 3,319(0.27%)#32 | 376,336(0.00%)#2,116 |
| 33. | Tualatin | 8 | 3,319(0.24%)#33 | 376,336(0.00%)#2,203 |
| 34. | Milwaukie | 6 | 3,319(0.18%)#34 | 376,336(0.00%)#2,341 |
| 35. | Santa Clara | 6 | 3,319(0.18%)#35 | 376,336(0.00%)#2,347 |
| 36. | Lincoln City | 5 | 3,319(0.15%)#36 | 376,336(0.00%)#2,422 |
| 37. | Klamath Falls | 4 | 3,319(0.12%)#37 | 376,336(0.00%)#2,454 |
| 38. | Gates | 3 | 3,319(0.09%)#38 | 376,336(0.00%)#2,543 |
| 39. | Medford | 2 | 3,319(0.06%)#39 | 376,336(0.00%)#2,550 |
| 40. | Falls City | 2 | 3,319(0.06%)#40 | 376,336(0.00%)#2,581 |
| 41. | Rivergrove | 1 | 3,319(0.03%)#41 | 376,336(0.00%)#2,651 |
| 42. | Spray | 1 | 3,319(0.03%)#42 | 376,336(0.00%)#2,658 |
Common Questions
What are the Top 10 Cities with the Most Immigrants from Taiwan in Oregon?
Top 10 Cities with the Most Immigrants from Taiwan in Oregon are:
#1
630
#2
276
#3
263
#4
248
#5
177
#6
159
#7
133
#8
130
#9
121
#10
86
What city has the Most Immigrants from Taiwan in Oregon?
Portland has the Most Immigrants from Taiwan in Oregon with 630.
What is the Total Immigrants from Taiwan in the State of Oregon?
Total Immigrants from Taiwan in Oregon is 3,319.
What is the Total Immigrants from Taiwan in the United States?
Total Immigrants from Taiwan in the United States is 376,336.