Cities with the Most Immigrants from Taiwan in Minnesota
RELATED REPORTS & OPTIONS
Taiwan
Minnesota
Compare Cities
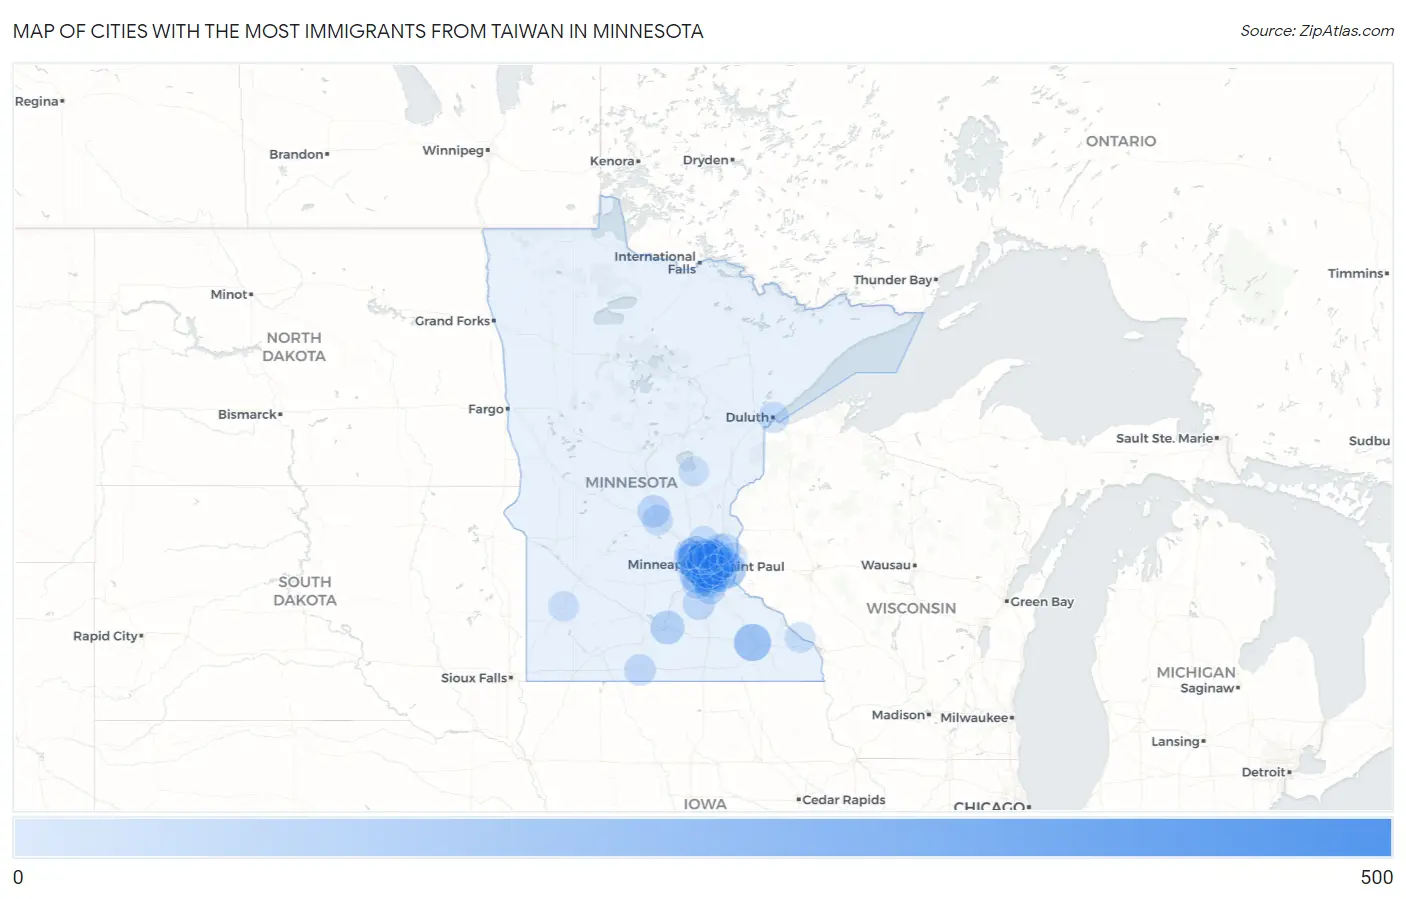
Map of Cities with the Most Immigrants from Taiwan in Minnesota
0
500
Cities with the Most Immigrants from Taiwan in Minnesota
| City | Taiwan | vs State | vs National | |
| 1. | Minneapolis | 412 | 2,357(17.48%)#1 | 376,336(0.11%)#140 |
| 2. | Plymouth | 168 | 2,357(7.13%)#2 | 376,336(0.04%)#318 |
| 3. | Rochester | 142 | 2,357(6.02%)#3 | 376,336(0.04%)#363 |
| 4. | Woodbury | 132 | 2,357(5.60%)#4 | 376,336(0.04%)#396 |
| 5. | Eden Prairie | 118 | 2,357(5.01%)#5 | 376,336(0.03%)#440 |
| 6. | Maple Grove | 107 | 2,357(4.54%)#6 | 376,336(0.03%)#470 |
| 7. | Roseville | 83 | 2,357(3.52%)#7 | 376,336(0.02%)#574 |
| 8. | Edina | 82 | 2,357(3.48%)#8 | 376,336(0.02%)#580 |
| 9. | Shoreview | 78 | 2,357(3.31%)#9 | 376,336(0.02%)#617 |
| 10. | Mankato | 74 | 2,357(3.14%)#10 | 376,336(0.02%)#646 |
| 11. | St Paul | 64 | 2,357(2.72%)#11 | 376,336(0.02%)#727 |
| 12. | Eagan | 64 | 2,357(2.72%)#12 | 376,336(0.02%)#732 |
| 13. | Medina | 52 | 2,357(2.21%)#13 | 376,336(0.01%)#863 |
| 14. | Bloomington | 50 | 2,357(2.12%)#14 | 376,336(0.01%)#880 |
| 15. | Burnsville | 45 | 2,357(1.91%)#15 | 376,336(0.01%)#934 |
| 16. | Sartell | 45 | 2,357(1.91%)#16 | 376,336(0.01%)#939 |
| 17. | St Louis Park | 41 | 2,357(1.74%)#17 | 376,336(0.01%)#989 |
| 18. | Lonsdale | 40 | 2,357(1.70%)#18 | 376,336(0.01%)#1,020 |
| 19. | Minnetonka | 38 | 2,357(1.61%)#19 | 376,336(0.01%)#1,035 |
| 20. | Falcon Heights | 38 | 2,357(1.61%)#20 | 376,336(0.01%)#1,050 |
| 21. | Arden Hills | 35 | 2,357(1.48%)#21 | 376,336(0.01%)#1,108 |
| 22. | Apple Valley | 32 | 2,357(1.36%)#22 | 376,336(0.01%)#1,167 |
| 23. | Fairmont | 31 | 2,357(1.32%)#23 | 376,336(0.01%)#1,199 |
| 24. | Lakeville | 25 | 2,357(1.06%)#24 | 376,336(0.01%)#1,342 |
| 25. | Inver Grove Heights | 23 | 2,357(0.98%)#25 | 376,336(0.01%)#1,404 |
| 26. | Richfield | 20 | 2,357(0.85%)#26 | 376,336(0.01%)#1,506 |
| 27. | Hugo | 20 | 2,357(0.85%)#27 | 376,336(0.01%)#1,520 |
| 28. | Mounds View | 20 | 2,357(0.85%)#28 | 376,336(0.01%)#1,523 |
| 29. | Duluth | 18 | 2,357(0.76%)#29 | 376,336(0.00%)#1,590 |
| 30. | St Cloud | 17 | 2,357(0.72%)#30 | 376,336(0.00%)#1,638 |
| 31. | Maplewood | 14 | 2,357(0.59%)#31 | 376,336(0.00%)#1,808 |
| 32. | New Brighton | 14 | 2,357(0.59%)#32 | 376,336(0.00%)#1,821 |
| 33. | Golden Valley | 14 | 2,357(0.59%)#33 | 376,336(0.00%)#1,823 |
| 34. | Andover | 13 | 2,357(0.55%)#34 | 376,336(0.00%)#1,870 |
| 35. | Prior Lake | 13 | 2,357(0.55%)#35 | 376,336(0.00%)#1,873 |
| 36. | Fridley | 12 | 2,357(0.51%)#36 | 376,336(0.00%)#1,925 |
| 37. | Winona | 12 | 2,357(0.51%)#37 | 376,336(0.00%)#1,926 |
| 38. | New Hope | 10 | 2,357(0.42%)#38 | 376,336(0.00%)#2,063 |
| 39. | Columbia Heights | 9 | 2,357(0.38%)#39 | 376,336(0.00%)#2,130 |
| 40. | Marshall | 9 | 2,357(0.38%)#40 | 376,336(0.00%)#2,138 |
| 41. | Corcoran | 9 | 2,357(0.38%)#41 | 376,336(0.00%)#2,155 |
| 42. | St Anthony City Hennepin And Ramsey Counties | 8 | 2,357(0.34%)#42 | 376,336(0.00%)#2,221 |
| 43. | Oakdale | 7 | 2,357(0.30%)#43 | 376,336(0.00%)#2,265 |
| 44. | Lino Lakes | 7 | 2,357(0.30%)#44 | 376,336(0.00%)#2,267 |
| 45. | Lilydale | 4 | 2,357(0.17%)#45 | 376,336(0.00%)#2,488 |
| 46. | Brooklyn Park | 3 | 2,357(0.13%)#46 | 376,336(0.00%)#2,494 |
| 47. | Wahkon | 3 | 2,357(0.13%)#47 | 376,336(0.00%)#2,544 |
| 48. | Stillwater | 1 | 2,357(0.04%)#48 | 376,336(0.00%)#2,616 |
Common Questions
What are the Top 10 Cities with the Most Immigrants from Taiwan in Minnesota?
Top 10 Cities with the Most Immigrants from Taiwan in Minnesota are:
#1
412
#2
168
#3
142
#4
132
#5
118
#6
107
#7
83
#8
82
#9
78
#10
74
What city has the Most Immigrants from Taiwan in Minnesota?
Minneapolis has the Most Immigrants from Taiwan in Minnesota with 412.
What is the Total Immigrants from Taiwan in the State of Minnesota?
Total Immigrants from Taiwan in Minnesota is 2,357.
What is the Total Immigrants from Taiwan in the United States?
Total Immigrants from Taiwan in the United States is 376,336.