Cities with the Most Immigrants from Korea in Virginia
RELATED REPORTS & OPTIONS
Korea
Virginia
Compare Cities
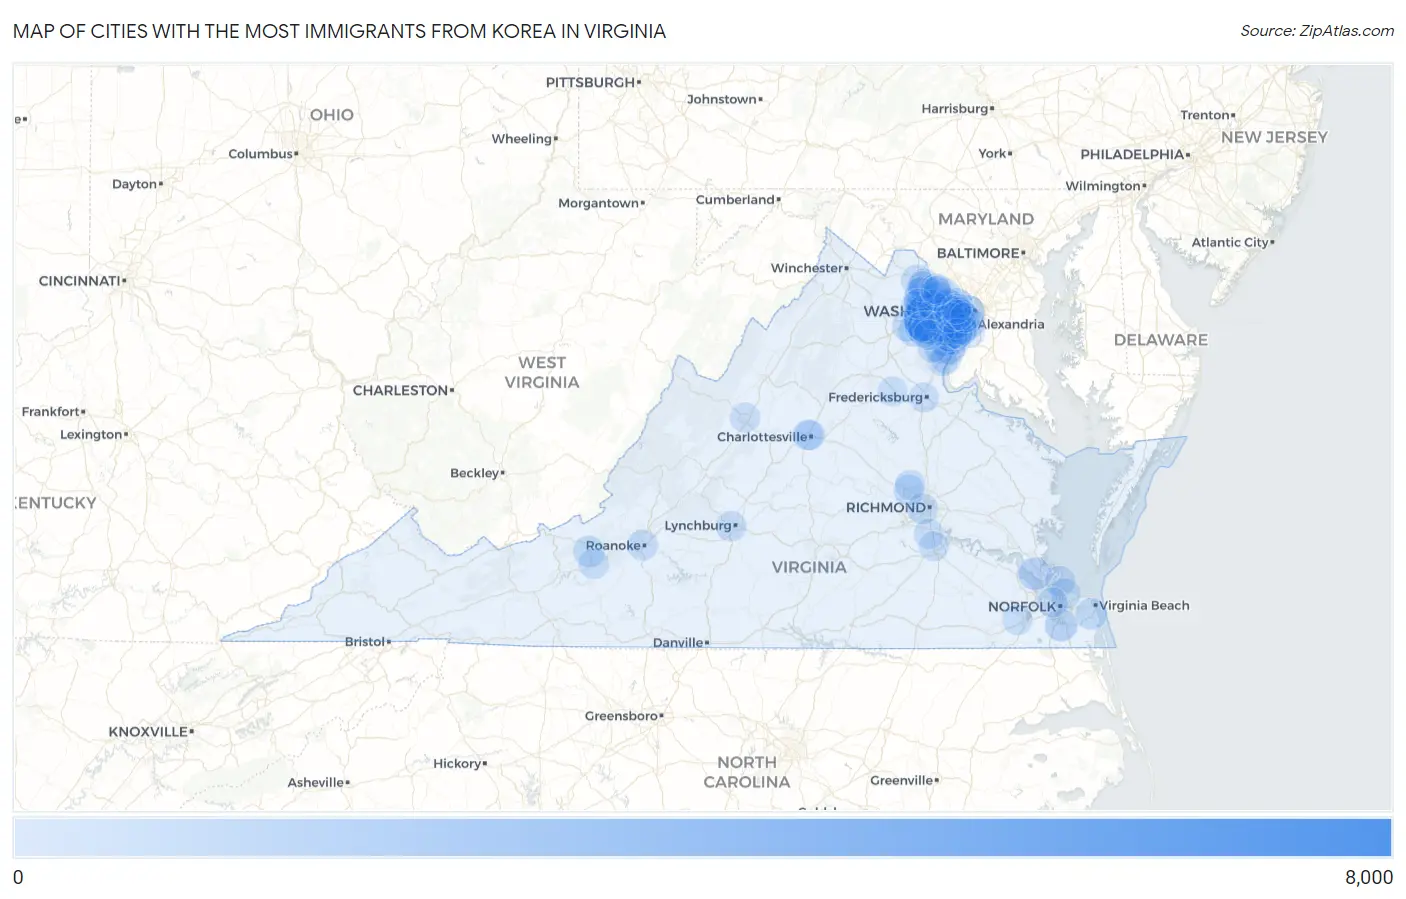
Map of Cities with the Most Immigrants from Korea in Virginia
0
8,000
Cities with the Most Immigrants from Korea in Virginia
| City | Korea | vs State | vs National | |
| 1. | Centreville | 7,025 | 52,857(13.29%)#1 | 1,034,299(0.68%)#11 |
| 2. | Fair Oaks | 2,452 | 52,857(4.64%)#2 | 1,034,299(0.24%)#39 |
| 3. | Arlington | 1,695 | 52,857(3.21%)#3 | 1,034,299(0.16%)#72 |
| 4. | Oakton | 1,646 | 52,857(3.11%)#4 | 1,034,299(0.16%)#77 |
| 5. | Burke | 1,628 | 52,857(3.08%)#5 | 1,034,299(0.16%)#78 |
| 6. | Annandale | 1,518 | 52,857(2.87%)#6 | 1,034,299(0.15%)#86 |
| 7. | Mclean | 1,301 | 52,857(2.46%)#7 | 1,034,299(0.13%)#107 |
| 8. | Tysons | 1,111 | 52,857(2.10%)#8 | 1,034,299(0.11%)#127 |
| 9. | Chantilly | 1,102 | 52,857(2.08%)#9 | 1,034,299(0.11%)#129 |
| 10. | Newport News | 941 | 52,857(1.78%)#10 | 1,034,299(0.09%)#155 |
| 11. | Merrifield | 933 | 52,857(1.77%)#11 | 1,034,299(0.09%)#157 |
| 12. | Chesapeake | 931 | 52,857(1.76%)#12 | 1,034,299(0.09%)#158 |
| 13. | Ashburn | 787 | 52,857(1.49%)#13 | 1,034,299(0.08%)#196 |
| 14. | Kings Park West | 777 | 52,857(1.47%)#14 | 1,034,299(0.08%)#199 |
| 15. | Alexandria | 706 | 52,857(1.34%)#15 | 1,034,299(0.07%)#223 |
| 16. | Dale City | 696 | 52,857(1.32%)#16 | 1,034,299(0.07%)#228 |
| 17. | South Riding | 695 | 52,857(1.31%)#17 | 1,034,299(0.07%)#230 |
| 18. | West Springfield | 620 | 52,857(1.17%)#18 | 1,034,299(0.06%)#252 |
| 19. | Burke Centre | 595 | 52,857(1.13%)#19 | 1,034,299(0.06%)#267 |
| 20. | Fairfax | 538 | 52,857(1.02%)#20 | 1,034,299(0.05%)#293 |
| 21. | Woodbridge | 531 | 52,857(1.00%)#21 | 1,034,299(0.05%)#302 |
| 22. | Fair Lakes | 527 | 52,857(1.00%)#22 | 1,034,299(0.05%)#305 |
| 23. | Virginia Beach | 526 | 52,857(1.00%)#23 | 1,034,299(0.05%)#306 |
| 24. | Blacksburg | 464 | 52,857(0.88%)#24 | 1,034,299(0.04%)#347 |
| 25. | Linton Hall | 428 | 52,857(0.81%)#25 | 1,034,299(0.04%)#371 |
| 26. | Long Branch | 372 | 52,857(0.70%)#26 | 1,034,299(0.04%)#415 |
| 27. | Springfield | 356 | 52,857(0.67%)#27 | 1,034,299(0.03%)#428 |
| 28. | Reston | 350 | 52,857(0.66%)#28 | 1,034,299(0.03%)#433 |
| 29. | Great Falls | 348 | 52,857(0.66%)#29 | 1,034,299(0.03%)#437 |
| 30. | Navy | 347 | 52,857(0.66%)#30 | 1,034,299(0.03%)#439 |
| 31. | Stone Ridge | 344 | 52,857(0.65%)#31 | 1,034,299(0.03%)#443 |
| 32. | Roanoke | 341 | 52,857(0.65%)#32 | 1,034,299(0.03%)#449 |
| 33. | Franklin Farm | 334 | 52,857(0.63%)#33 | 1,034,299(0.03%)#460 |
| 34. | Gainesville | 325 | 52,857(0.61%)#34 | 1,034,299(0.03%)#467 |
| 35. | Laurel Hill | 317 | 52,857(0.60%)#35 | 1,034,299(0.03%)#477 |
| 36. | Short Pump | 309 | 52,857(0.58%)#36 | 1,034,299(0.03%)#490 |
| 37. | Richmond | 307 | 52,857(0.58%)#37 | 1,034,299(0.03%)#493 |
| 38. | Norfolk | 297 | 52,857(0.56%)#38 | 1,034,299(0.03%)#514 |
| 39. | Lorton | 295 | 52,857(0.56%)#39 | 1,034,299(0.03%)#518 |
| 40. | Idylwood | 291 | 52,857(0.55%)#40 | 1,034,299(0.03%)#524 |
| 41. | Bull Run | 285 | 52,857(0.54%)#41 | 1,034,299(0.03%)#536 |
| 42. | Leesburg | 273 | 52,857(0.52%)#42 | 1,034,299(0.03%)#553 |
| 43. | Lincolnia | 255 | 52,857(0.48%)#43 | 1,034,299(0.02%)#591 |
| 44. | Dunn Loring | 252 | 52,857(0.48%)#44 | 1,034,299(0.02%)#598 |
| 45. | Brambleton | 251 | 52,857(0.47%)#45 | 1,034,299(0.02%)#599 |
| 46. | George Mason | 244 | 52,857(0.46%)#46 | 1,034,299(0.02%)#611 |
| 47. | Franconia | 242 | 52,857(0.46%)#47 | 1,034,299(0.02%)#620 |
| 48. | Union Mill | 240 | 52,857(0.45%)#48 | 1,034,299(0.02%)#625 |
| 49. | Wolf Trap | 238 | 52,857(0.45%)#49 | 1,034,299(0.02%)#632 |
| 50. | Braddock | 237 | 52,857(0.45%)#50 | 1,034,299(0.02%)#635 |
| 51. | Christiansburg | 227 | 52,857(0.43%)#51 | 1,034,299(0.02%)#665 |
| 52. | University Of Virginia | 221 | 52,857(0.42%)#52 | 1,034,299(0.02%)#679 |
| 53. | Lynchburg | 219 | 52,857(0.41%)#53 | 1,034,299(0.02%)#681 |
| 54. | South Run | 219 | 52,857(0.41%)#54 | 1,034,299(0.02%)#685 |
| 55. | Lake Ridge | 216 | 52,857(0.41%)#55 | 1,034,299(0.02%)#700 |
| 56. | Fairfax Station | 202 | 52,857(0.38%)#56 | 1,034,299(0.02%)#742 |
| 57. | Hampton | 198 | 52,857(0.37%)#57 | 1,034,299(0.02%)#749 |
| 58. | Greenbriar | 198 | 52,857(0.37%)#58 | 1,034,299(0.02%)#754 |
| 59. | Vienna | 183 | 52,857(0.35%)#59 | 1,034,299(0.02%)#807 |
| 60. | Kingstowne | 180 | 52,857(0.34%)#60 | 1,034,299(0.02%)#814 |
| 61. | Woodlawn Cdp Fairfax County | 177 | 52,857(0.33%)#61 | 1,034,299(0.02%)#822 |
| 62. | Cherry Hill | 170 | 52,857(0.32%)#62 | 1,034,299(0.02%)#847 |
| 63. | Newington Forest | 169 | 52,857(0.32%)#63 | 1,034,299(0.02%)#854 |
| 64. | Rose Hill Cdp Fairfax County | 168 | 52,857(0.32%)#64 | 1,034,299(0.02%)#859 |
| 65. | North Springfield | 165 | 52,857(0.31%)#65 | 1,034,299(0.02%)#873 |
| 66. | Lansdowne | 151 | 52,857(0.29%)#66 | 1,034,299(0.01%)#935 |
| 67. | Triangle | 151 | 52,857(0.29%)#67 | 1,034,299(0.01%)#936 |
| 68. | Charlottesville | 149 | 52,857(0.28%)#68 | 1,034,299(0.01%)#944 |
| 69. | Hybla Valley | 146 | 52,857(0.28%)#69 | 1,034,299(0.01%)#960 |
| 70. | Dranesville | 143 | 52,857(0.27%)#70 | 1,034,299(0.01%)#974 |
| 71. | Seven Corners | 143 | 52,857(0.27%)#71 | 1,034,299(0.01%)#975 |
| 72. | Broadlands | 142 | 52,857(0.27%)#72 | 1,034,299(0.01%)#979 |
| 73. | Floris | 140 | 52,857(0.26%)#73 | 1,034,299(0.01%)#992 |
| 74. | Falls Church | 138 | 52,857(0.26%)#74 | 1,034,299(0.01%)#1,003 |
| 75. | Independent Hill | 138 | 52,857(0.26%)#75 | 1,034,299(0.01%)#1,005 |
| 76. | Yorkshire | 137 | 52,857(0.26%)#76 | 1,034,299(0.01%)#1,010 |
| 77. | Wyndham | 133 | 52,857(0.25%)#77 | 1,034,299(0.01%)#1,026 |
| 78. | Difficult Run | 122 | 52,857(0.23%)#78 | 1,034,299(0.01%)#1,093 |
| 79. | Crosspointe | 122 | 52,857(0.23%)#79 | 1,034,299(0.01%)#1,095 |
| 80. | Manassas | 120 | 52,857(0.23%)#80 | 1,034,299(0.01%)#1,108 |
| 81. | Staunton | 118 | 52,857(0.22%)#81 | 1,034,299(0.01%)#1,125 |
| 82. | Sudley | 115 | 52,857(0.22%)#82 | 1,034,299(0.01%)#1,146 |
| 83. | Buckhall | 110 | 52,857(0.21%)#83 | 1,034,299(0.01%)#1,186 |
| 84. | Belmont | 110 | 52,857(0.21%)#84 | 1,034,299(0.01%)#1,188 |
| 85. | Lake Of The Woods | 108 | 52,857(0.20%)#85 | 1,034,299(0.01%)#1,206 |
| 86. | Leesylvania | 104 | 52,857(0.20%)#86 | 1,034,299(0.01%)#1,234 |
| 87. | Cascades | 104 | 52,857(0.20%)#87 | 1,034,299(0.01%)#1,235 |
| 88. | Mantua | 101 | 52,857(0.19%)#88 | 1,034,299(0.01%)#1,255 |
| 89. | Suffolk | 97 | 52,857(0.18%)#89 | 1,034,299(0.01%)#1,278 |
| 90. | Newington | 97 | 52,857(0.18%)#90 | 1,034,299(0.01%)#1,286 |
| 91. | Arcola | 96 | 52,857(0.18%)#91 | 1,034,299(0.01%)#1,294 |
| 92. | West Falls Church | 93 | 52,857(0.18%)#92 | 1,034,299(0.01%)#1,316 |
| 93. | Chester | 92 | 52,857(0.17%)#93 | 1,034,299(0.01%)#1,329 |
| 94. | Lowes Island | 92 | 52,857(0.17%)#94 | 1,034,299(0.01%)#1,331 |
| 95. | Colonial Heights | 83 | 52,857(0.16%)#95 | 1,034,299(0.01%)#1,418 |
| 96. | Bailey S Crossroads | 79 | 52,857(0.15%)#96 | 1,034,299(0.01%)#1,467 |
| 97. | Sugarland Run | 79 | 52,857(0.15%)#97 | 1,034,299(0.01%)#1,471 |
| 98. | Pimmit Hills | 79 | 52,857(0.15%)#98 | 1,034,299(0.01%)#1,473 |
| 99. | Portsmouth | 78 | 52,857(0.15%)#99 | 1,034,299(0.01%)#1,475 |
| 100. | Fredericksburg | 78 | 52,857(0.15%)#100 | 1,034,299(0.01%)#1,479 |
Common Questions
What are the Top 10 Cities with the Most Immigrants from Korea in Virginia?
Top 10 Cities with the Most Immigrants from Korea in Virginia are:
#1
7,025
#2
2,452
#3
1,695
#4
1,646
#5
1,628
#6
1,518
#7
1,301
#8
1,111
#9
1,102
#10
941
What city has the Most Immigrants from Korea in Virginia?
Centreville has the Most Immigrants from Korea in Virginia with 7,025.
What is the Total Immigrants from Korea in the State of Virginia?
Total Immigrants from Korea in Virginia is 52,857.
What is the Total Immigrants from Korea in the United States?
Total Immigrants from Korea in the United States is 1,034,299.