Cities with the Most Immigrants from Korea in South Carolina
RELATED REPORTS & OPTIONS
Korea
South Carolina
Compare Cities
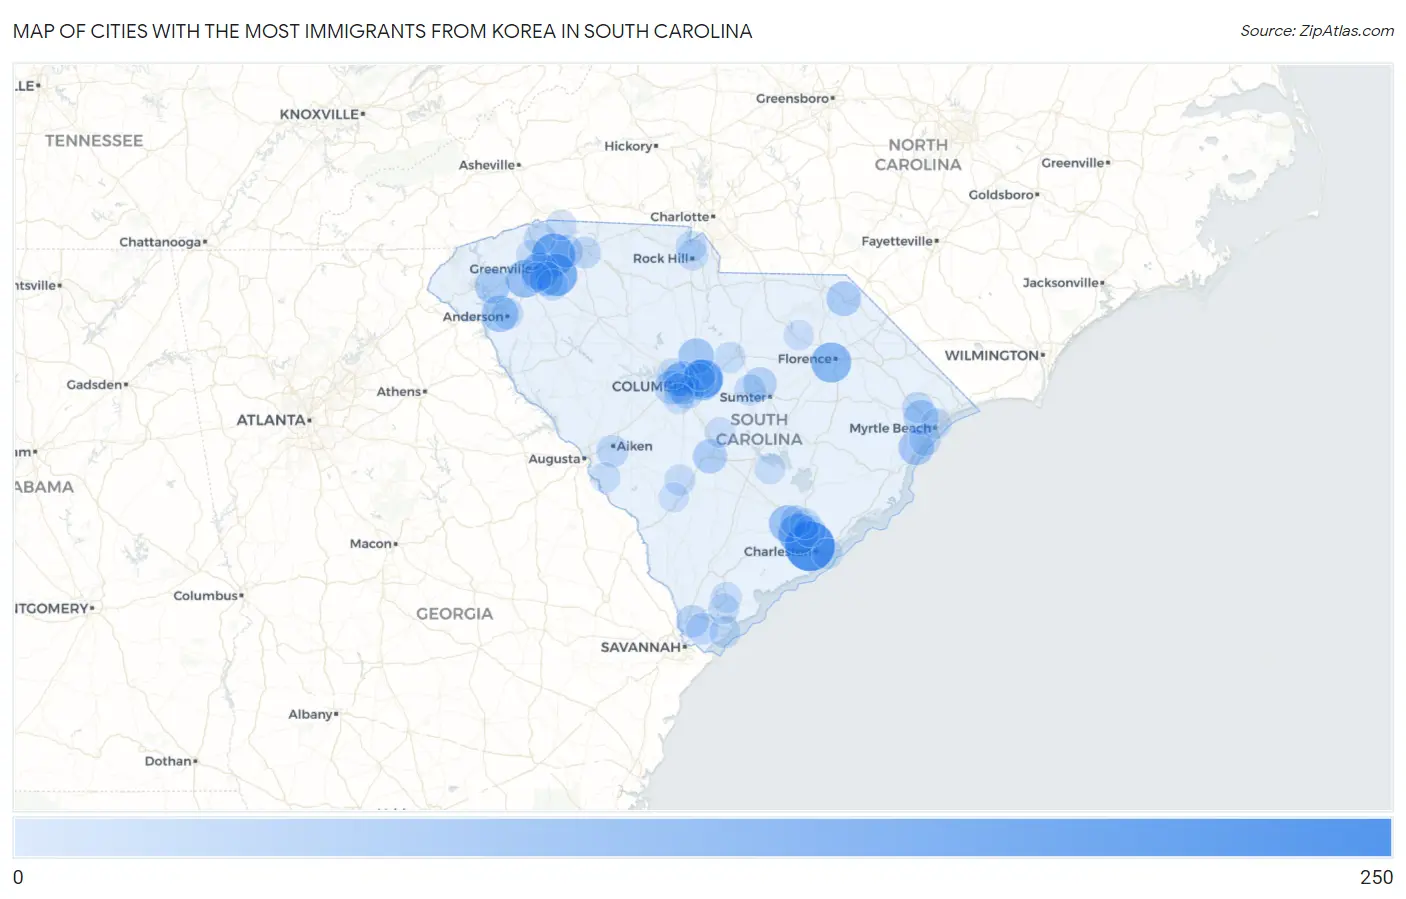
Map of Cities with the Most Immigrants from Korea in South Carolina
0
250
Cities with the Most Immigrants from Korea in South Carolina
| City | Korea | vs State | vs National | |
| 1. | Charleston | 219 | 4,513(4.85%)#1 | 1,034,299(0.02%)#680 |
| 2. | Greer | 141 | 4,513(3.12%)#2 | 1,034,299(0.01%)#987 |
| 3. | Five Forks | 132 | 4,513(2.92%)#3 | 1,034,299(0.01%)#1,031 |
| 4. | North Charleston | 116 | 4,513(2.57%)#4 | 1,034,299(0.01%)#1,134 |
| 5. | Columbia | 112 | 4,513(2.48%)#5 | 1,034,299(0.01%)#1,163 |
| 6. | Florence | 110 | 4,513(2.44%)#6 | 1,034,299(0.01%)#1,185 |
| 7. | Woodfield | 95 | 4,513(2.11%)#7 | 1,034,299(0.01%)#1,307 |
| 8. | Powdersville | 86 | 4,513(1.91%)#8 | 1,034,299(0.01%)#1,387 |
| 9. | Greenville | 82 | 4,513(1.82%)#9 | 1,034,299(0.01%)#1,427 |
| 10. | Summerville | 77 | 4,513(1.71%)#10 | 1,034,299(0.01%)#1,490 |
| 11. | Centerville | 69 | 4,513(1.53%)#11 | 1,034,299(0.01%)#1,610 |
| 12. | Blythewood | 62 | 4,513(1.37%)#12 | 1,034,299(0.01%)#1,711 |
| 13. | Murrells Inlet | 58 | 4,513(1.29%)#13 | 1,034,299(0.01%)#1,774 |
| 14. | St Andrews | 56 | 4,513(1.24%)#14 | 1,034,299(0.01%)#1,801 |
| 15. | Central | 53 | 4,513(1.17%)#15 | 1,034,299(0.01%)#1,872 |
| 16. | Red Hill | 52 | 4,513(1.15%)#16 | 1,034,299(0.01%)#1,884 |
| 17. | Bennettsville | 50 | 4,513(1.11%)#17 | 1,034,299(0.00%)#1,932 |
| 18. | Mauldin | 46 | 4,513(1.02%)#18 | 1,034,299(0.00%)#2,008 |
| 19. | Orangeburg | 44 | 4,513(0.97%)#19 | 1,034,299(0.00%)#2,065 |
| 20. | Lexington | 39 | 4,513(0.86%)#20 | 1,034,299(0.00%)#2,200 |
| 21. | West Columbia | 37 | 4,513(0.82%)#21 | 1,034,299(0.00%)#2,259 |
| 22. | Forest Acres | 37 | 4,513(0.82%)#22 | 1,034,299(0.00%)#2,270 |
| 23. | Dalzell | 35 | 4,513(0.78%)#23 | 1,034,299(0.00%)#2,335 |
| 24. | Lyman | 31 | 4,513(0.69%)#24 | 1,034,299(0.00%)#2,492 |
| 25. | Seven Oaks | 30 | 4,513(0.66%)#25 | 1,034,299(0.00%)#2,530 |
| 26. | Cayce | 27 | 4,513(0.60%)#26 | 1,034,299(0.00%)#2,661 |
| 27. | Hardeeville | 27 | 4,513(0.60%)#27 | 1,034,299(0.00%)#2,671 |
| 28. | Aiken | 22 | 4,513(0.49%)#28 | 1,034,299(0.00%)#2,908 |
| 29. | Ladson | 21 | 4,513(0.47%)#29 | 1,034,299(0.00%)#2,990 |
| 30. | Tigerville | 21 | 4,513(0.47%)#30 | 1,034,299(0.00%)#3,024 |
| 31. | Saxon | 20 | 4,513(0.44%)#31 | 1,034,299(0.00%)#3,086 |
| 32. | Hanahan | 19 | 4,513(0.42%)#32 | 1,034,299(0.00%)#3,117 |
| 33. | Bluffton | 17 | 4,513(0.38%)#33 | 1,034,299(0.00%)#3,257 |
| 34. | Surfside Beach | 17 | 4,513(0.38%)#34 | 1,034,299(0.00%)#3,299 |
| 35. | Anderson | 16 | 4,513(0.35%)#35 | 1,034,299(0.00%)#3,329 |
| 36. | Dentsville | 15 | 4,513(0.33%)#36 | 1,034,299(0.00%)#3,427 |
| 37. | Stateburg | 15 | 4,513(0.33%)#37 | 1,034,299(0.00%)#3,481 |
| 38. | Conway | 14 | 4,513(0.31%)#38 | 1,034,299(0.00%)#3,501 |
| 39. | Hilton Head Island | 13 | 4,513(0.29%)#39 | 1,034,299(0.00%)#3,600 |
| 40. | Simpsonville | 13 | 4,513(0.29%)#40 | 1,034,299(0.00%)#3,606 |
| 41. | Irmo | 12 | 4,513(0.27%)#41 | 1,034,299(0.00%)#3,748 |
| 42. | Lugoff | 12 | 4,513(0.27%)#42 | 1,034,299(0.00%)#3,754 |
| 43. | Rock Hill | 11 | 4,513(0.24%)#43 | 1,034,299(0.00%)#3,825 |
| 44. | India Hook | 11 | 4,513(0.24%)#44 | 1,034,299(0.00%)#3,891 |
| 45. | Denmark | 10 | 4,513(0.22%)#45 | 1,034,299(0.00%)#4,010 |
| 46. | Beaufort | 9 | 4,513(0.20%)#46 | 1,034,299(0.00%)#4,079 |
| 47. | Sullivan S Island | 9 | 4,513(0.20%)#47 | 1,034,299(0.00%)#4,149 |
| 48. | Goose Creek | 8 | 4,513(0.18%)#48 | 1,034,299(0.00%)#4,181 |
| 49. | Travelers Rest | 8 | 4,513(0.18%)#49 | 1,034,299(0.00%)#4,226 |
| 50. | St Matthews | 8 | 4,513(0.18%)#50 | 1,034,299(0.00%)#4,275 |
| 51. | Myrtle Beach | 7 | 4,513(0.16%)#51 | 1,034,299(0.00%)#4,316 |
| 52. | Port Royal | 7 | 4,513(0.16%)#52 | 1,034,299(0.00%)#4,330 |
| 53. | Oak Grove | 7 | 4,513(0.16%)#53 | 1,034,299(0.00%)#4,344 |
| 54. | Landrum | 6 | 4,513(0.13%)#54 | 1,034,299(0.00%)#4,521 |
| 55. | South Congaree | 6 | 4,513(0.13%)#55 | 1,034,299(0.00%)#4,526 |
| 56. | Jackson | 6 | 4,513(0.13%)#56 | 1,034,299(0.00%)#4,532 |
| 57. | Eutawville | 6 | 4,513(0.13%)#57 | 1,034,299(0.00%)#4,574 |
| 58. | Gantt | 3 | 4,513(0.07%)#58 | 1,034,299(0.00%)#4,884 |
| 59. | Hartsville | 3 | 4,513(0.07%)#59 | 1,034,299(0.00%)#4,891 |
| 60. | Olar | 3 | 4,513(0.07%)#60 | 1,034,299(0.00%)#5,035 |
| 61. | Carolina Forest | 2 | 4,513(0.04%)#61 | 1,034,299(0.00%)#5,043 |
Common Questions
What are the Top 10 Cities with the Most Immigrants from Korea in South Carolina?
Top 10 Cities with the Most Immigrants from Korea in South Carolina are:
#1
219
#2
141
#3
132
#4
116
#5
112
#6
110
#7
95
#8
86
#9
82
#10
77
What city has the Most Immigrants from Korea in South Carolina?
Charleston has the Most Immigrants from Korea in South Carolina with 219.
What is the Total Immigrants from Korea in the State of South Carolina?
Total Immigrants from Korea in South Carolina is 4,513.
What is the Total Immigrants from Korea in the United States?
Total Immigrants from Korea in the United States is 1,034,299.