Cities with the Most Immigrants from Korea in Pennsylvania
RELATED REPORTS & OPTIONS
Korea
Pennsylvania
Compare Cities
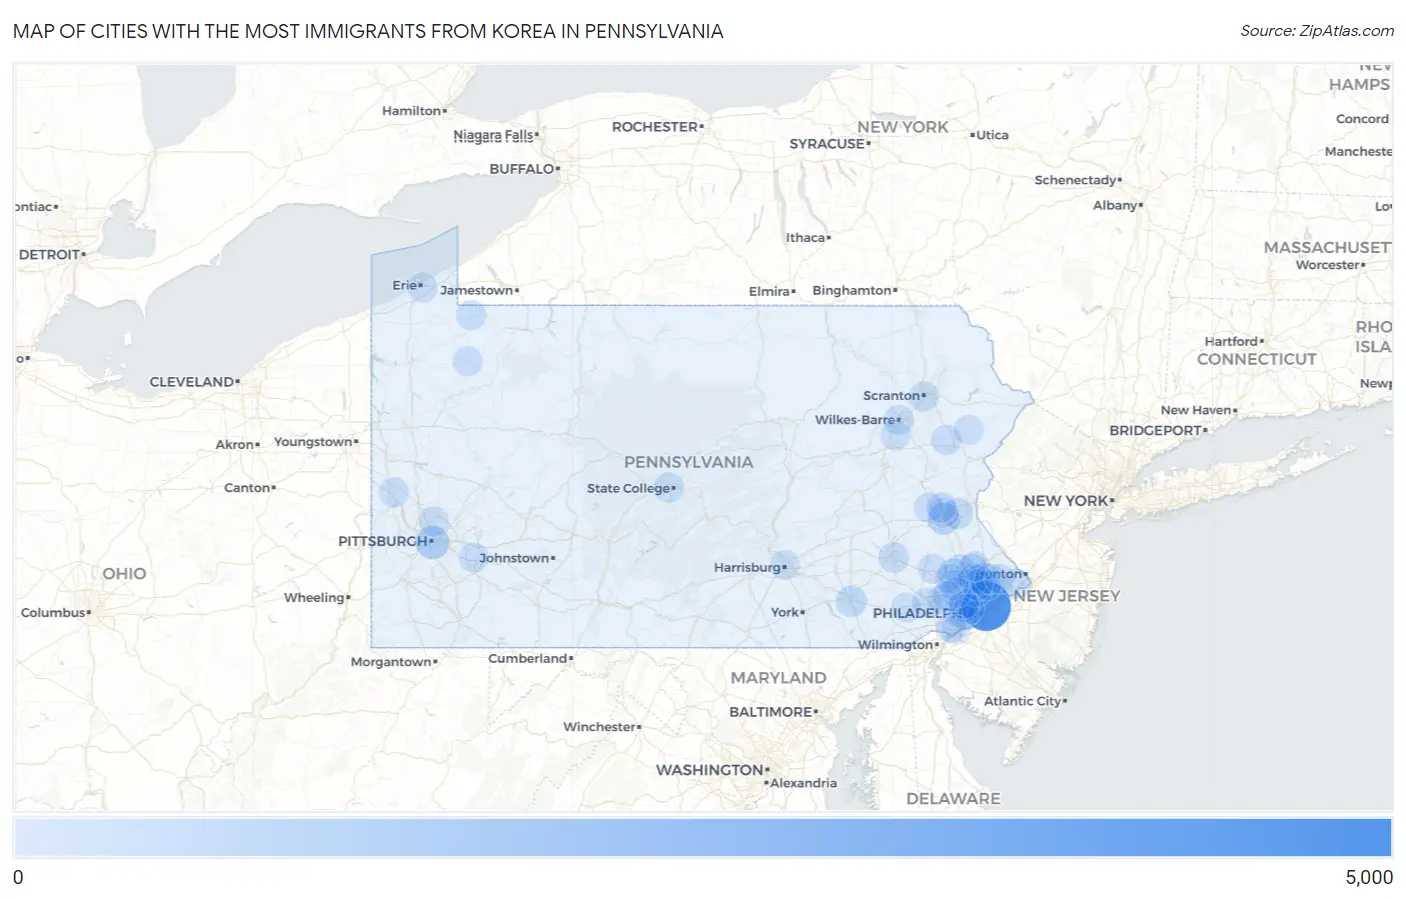
Map of Cities with the Most Immigrants from Korea in Pennsylvania
0
5,000
Cities with the Most Immigrants from Korea in Pennsylvania
| City | Korea | vs State | vs National | |
| 1. | Philadelphia | 4,435 | 27,433(16.17%)#1 | 1,034,299(0.43%)#18 |
| 2. | Pittsburgh | 802 | 27,433(2.92%)#2 | 1,034,299(0.08%)#191 |
| 3. | Allentown | 424 | 27,433(1.55%)#3 | 1,034,299(0.04%)#374 |
| 4. | State College Borough | 390 | 27,433(1.42%)#4 | 1,034,299(0.04%)#398 |
| 5. | Montgomeryville | 347 | 27,433(1.26%)#5 | 1,034,299(0.03%)#438 |
| 6. | Horsham | 302 | 27,433(1.10%)#6 | 1,034,299(0.03%)#505 |
| 7. | Lancaster | 279 | 27,433(1.02%)#7 | 1,034,299(0.03%)#541 |
| 8. | Kulpsville | 258 | 27,433(0.94%)#8 | 1,034,299(0.02%)#580 |
| 9. | Bethlehem | 207 | 27,433(0.75%)#9 | 1,034,299(0.02%)#721 |
| 10. | Broomall | 206 | 27,433(0.75%)#10 | 1,034,299(0.02%)#727 |
| 11. | Lansdale Borough | 198 | 27,433(0.72%)#11 | 1,034,299(0.02%)#753 |
| 12. | Stroudsburg Borough | 175 | 27,433(0.64%)#12 | 1,034,299(0.02%)#830 |
| 13. | Norristown Borough | 171 | 27,433(0.62%)#13 | 1,034,299(0.02%)#842 |
| 14. | Maple Glen | 168 | 27,433(0.61%)#14 | 1,034,299(0.02%)#862 |
| 15. | Phoenixville Borough | 166 | 27,433(0.61%)#15 | 1,034,299(0.02%)#868 |
| 16. | Blue Bell | 157 | 27,433(0.57%)#16 | 1,034,299(0.02%)#898 |
| 17. | Hatboro Borough | 142 | 27,433(0.52%)#17 | 1,034,299(0.01%)#981 |
| 18. | Reading | 132 | 27,433(0.48%)#18 | 1,034,299(0.01%)#1,028 |
| 19. | Skippack | 129 | 27,433(0.47%)#19 | 1,034,299(0.01%)#1,046 |
| 20. | Willow Grove | 126 | 27,433(0.46%)#20 | 1,034,299(0.01%)#1,060 |
| 21. | Elkins Park | 125 | 27,433(0.46%)#21 | 1,034,299(0.01%)#1,075 |
| 22. | Flourtown | 125 | 27,433(0.46%)#22 | 1,034,299(0.01%)#1,076 |
| 23. | Spring House | 122 | 27,433(0.44%)#23 | 1,034,299(0.01%)#1,096 |
| 24. | Eagleville Cdp Montgomery County | 117 | 27,433(0.43%)#24 | 1,034,299(0.01%)#1,133 |
| 25. | Ardmore | 113 | 27,433(0.41%)#25 | 1,034,299(0.01%)#1,160 |
| 26. | Fort Washington | 113 | 27,433(0.41%)#26 | 1,034,299(0.01%)#1,162 |
| 27. | Millersville Borough | 102 | 27,433(0.37%)#27 | 1,034,299(0.01%)#1,247 |
| 28. | Ambler Borough | 100 | 27,433(0.36%)#28 | 1,034,299(0.01%)#1,258 |
| 29. | Exton | 99 | 27,433(0.36%)#29 | 1,034,299(0.01%)#1,270 |
| 30. | Warminster Heights | 99 | 27,433(0.36%)#30 | 1,034,299(0.01%)#1,271 |
| 31. | Paoli | 98 | 27,433(0.36%)#31 | 1,034,299(0.01%)#1,276 |
| 32. | Aspinwall Borough | 98 | 27,433(0.36%)#32 | 1,034,299(0.01%)#1,277 |
| 33. | Drexel Hill | 95 | 27,433(0.35%)#33 | 1,034,299(0.01%)#1,300 |
| 34. | West Mifflin Borough | 90 | 27,433(0.33%)#34 | 1,034,299(0.01%)#1,347 |
| 35. | Wilkinsburg Borough | 87 | 27,433(0.32%)#35 | 1,034,299(0.01%)#1,377 |
| 36. | King Of Prussia | 86 | 27,433(0.31%)#36 | 1,034,299(0.01%)#1,385 |
| 37. | Trooper | 85 | 27,433(0.31%)#37 | 1,034,299(0.01%)#1,402 |
| 38. | Pocono Pines | 83 | 27,433(0.30%)#38 | 1,034,299(0.01%)#1,424 |
| 39. | Munhall Borough | 82 | 27,433(0.30%)#39 | 1,034,299(0.01%)#1,435 |
| 40. | Chesterbrook | 82 | 27,433(0.30%)#40 | 1,034,299(0.01%)#1,438 |
| 41. | Levittown | 78 | 27,433(0.28%)#41 | 1,034,299(0.01%)#1,476 |
| 42. | Penn Wynne | 77 | 27,433(0.28%)#42 | 1,034,299(0.01%)#1,502 |
| 43. | Malvern Borough | 75 | 27,433(0.27%)#43 | 1,034,299(0.01%)#1,526 |
| 44. | Conshohocken Borough | 74 | 27,433(0.27%)#44 | 1,034,299(0.01%)#1,534 |
| 45. | Hatfield Borough | 73 | 27,433(0.27%)#45 | 1,034,299(0.01%)#1,551 |
| 46. | Park Forest Village | 62 | 27,433(0.23%)#46 | 1,034,299(0.01%)#1,707 |
| 47. | Fox Chapel Borough | 62 | 27,433(0.23%)#47 | 1,034,299(0.01%)#1,710 |
| 48. | Villanova | 60 | 27,433(0.22%)#48 | 1,034,299(0.01%)#1,737 |
| 49. | Wilkes Barre | 55 | 27,433(0.20%)#49 | 1,034,299(0.01%)#1,817 |
| 50. | Moosic Borough | 53 | 27,433(0.19%)#50 | 1,034,299(0.01%)#1,871 |
| 51. | Palmyra Borough | 52 | 27,433(0.19%)#51 | 1,034,299(0.01%)#1,886 |
| 52. | Trafford Borough | 52 | 27,433(0.19%)#52 | 1,034,299(0.01%)#1,889 |
| 53. | Scranton | 50 | 27,433(0.18%)#53 | 1,034,299(0.00%)#1,918 |
| 54. | Lansdowne Borough | 47 | 27,433(0.17%)#54 | 1,034,299(0.00%)#1,992 |
| 55. | Jeannette | 47 | 27,433(0.17%)#55 | 1,034,299(0.00%)#1,995 |
| 56. | Brookhaven Borough | 45 | 27,433(0.16%)#56 | 1,034,299(0.00%)#2,043 |
| 57. | Carlisle Borough | 44 | 27,433(0.16%)#57 | 1,034,299(0.00%)#2,057 |
| 58. | Fullerton | 44 | 27,433(0.16%)#58 | 1,034,299(0.00%)#2,062 |
| 59. | Emmaus Borough | 42 | 27,433(0.15%)#59 | 1,034,299(0.00%)#2,120 |
| 60. | Swarthmore Borough | 42 | 27,433(0.15%)#60 | 1,034,299(0.00%)#2,125 |
| 61. | Allison Park | 40 | 27,433(0.15%)#61 | 1,034,299(0.00%)#2,170 |
| 62. | Corry | 40 | 27,433(0.15%)#62 | 1,034,299(0.00%)#2,184 |
| 63. | Camp Hill Borough | 39 | 27,433(0.14%)#63 | 1,034,299(0.00%)#2,209 |
| 64. | Jenkintown Borough | 39 | 27,433(0.14%)#64 | 1,034,299(0.00%)#2,214 |
| 65. | Mechanicsburg Borough | 38 | 27,433(0.14%)#65 | 1,034,299(0.00%)#2,236 |
| 66. | Wayne | 38 | 27,433(0.14%)#66 | 1,034,299(0.00%)#2,239 |
| 67. | Franklin Park Borough | 37 | 27,433(0.13%)#67 | 1,034,299(0.00%)#2,260 |
| 68. | Morgan Hill | 36 | 27,433(0.13%)#68 | 1,034,299(0.00%)#2,311 |
| 69. | Erie | 35 | 27,433(0.13%)#69 | 1,034,299(0.00%)#2,312 |
| 70. | Schnecksville | 34 | 27,433(0.12%)#70 | 1,034,299(0.00%)#2,374 |
| 71. | Harrisburg | 33 | 27,433(0.12%)#71 | 1,034,299(0.00%)#2,386 |
| 72. | Shippensburg Borough | 33 | 27,433(0.12%)#72 | 1,034,299(0.00%)#2,415 |
| 73. | Stiles | 32 | 27,433(0.12%)#73 | 1,034,299(0.00%)#2,462 |
| 74. | Bristol Borough | 31 | 27,433(0.11%)#74 | 1,034,299(0.00%)#2,486 |
| 75. | St. Davids | 31 | 27,433(0.11%)#75 | 1,034,299(0.00%)#2,498 |
| 76. | Chester | 29 | 27,433(0.11%)#76 | 1,034,299(0.00%)#2,556 |
| 77. | Quakertown Borough | 29 | 27,433(0.11%)#77 | 1,034,299(0.00%)#2,576 |
| 78. | Bryn Mawr | 29 | 27,433(0.11%)#78 | 1,034,299(0.00%)#2,583 |
| 79. | Evansburg | 29 | 27,433(0.11%)#79 | 1,034,299(0.00%)#2,589 |
| 80. | Mountainhome | 29 | 27,433(0.11%)#80 | 1,034,299(0.00%)#2,592 |
| 81. | Mountain Top | 28 | 27,433(0.10%)#81 | 1,034,299(0.00%)#2,617 |
| 82. | Hughestown Borough | 28 | 27,433(0.10%)#82 | 1,034,299(0.00%)#2,641 |
| 83. | Brittany Farms The Highlands | 27 | 27,433(0.10%)#83 | 1,034,299(0.00%)#2,679 |
| 84. | Dunmore Borough | 26 | 27,433(0.09%)#84 | 1,034,299(0.00%)#2,711 |
| 85. | Coatesville | 26 | 27,433(0.09%)#85 | 1,034,299(0.00%)#2,713 |
| 86. | Village Green Green Ridge | 26 | 27,433(0.09%)#86 | 1,034,299(0.00%)#2,718 |
| 87. | Chestnut Hill | 26 | 27,433(0.09%)#87 | 1,034,299(0.00%)#2,725 |
| 88. | Rosemont | 26 | 27,433(0.09%)#88 | 1,034,299(0.00%)#2,733 |
| 89. | Punxsutawney Borough | 25 | 27,433(0.09%)#89 | 1,034,299(0.00%)#2,776 |
| 90. | Mount Oliver Borough | 24 | 27,433(0.09%)#90 | 1,034,299(0.00%)#2,836 |
| 91. | Sanatoga | 23 | 27,433(0.08%)#91 | 1,034,299(0.00%)#2,880 |
| 92. | Middletown Borough | 22 | 27,433(0.08%)#92 | 1,034,299(0.00%)#2,930 |
| 93. | Doylestown Borough | 22 | 27,433(0.08%)#93 | 1,034,299(0.00%)#2,934 |
| 94. | Glassport Borough | 22 | 27,433(0.08%)#94 | 1,034,299(0.00%)#2,946 |
| 95. | Penn Farms | 22 | 27,433(0.08%)#95 | 1,034,299(0.00%)#2,951 |
| 96. | Plum Borough | 21 | 27,433(0.08%)#96 | 1,034,299(0.00%)#2,970 |
| 97. | Beaver Falls | 21 | 27,433(0.08%)#97 | 1,034,299(0.00%)#3,002 |
| 98. | Churchville | 21 | 27,433(0.08%)#98 | 1,034,299(0.00%)#3,012 |
| 99. | Titusville | 21 | 27,433(0.08%)#99 | 1,034,299(0.00%)#3,014 |
| 100. | Collegeville Borough | 21 | 27,433(0.08%)#100 | 1,034,299(0.00%)#3,015 |
Common Questions
What are the Top 10 Cities with the Most Immigrants from Korea in Pennsylvania?
Top 10 Cities with the Most Immigrants from Korea in Pennsylvania are:
#1
4,435
#2
802
#3
424
#4
347
#5
302
#6
279
#7
258
#8
207
#9
206
#10
168
What city has the Most Immigrants from Korea in Pennsylvania?
Philadelphia has the Most Immigrants from Korea in Pennsylvania with 4,435.
What is the Total Immigrants from Korea in the State of Pennsylvania?
Total Immigrants from Korea in Pennsylvania is 27,433.
What is the Total Immigrants from Korea in the United States?
Total Immigrants from Korea in the United States is 1,034,299.