Cities with the Most Immigrants from Korea in Tennessee
RELATED REPORTS & OPTIONS
Korea
Tennessee
Compare Cities
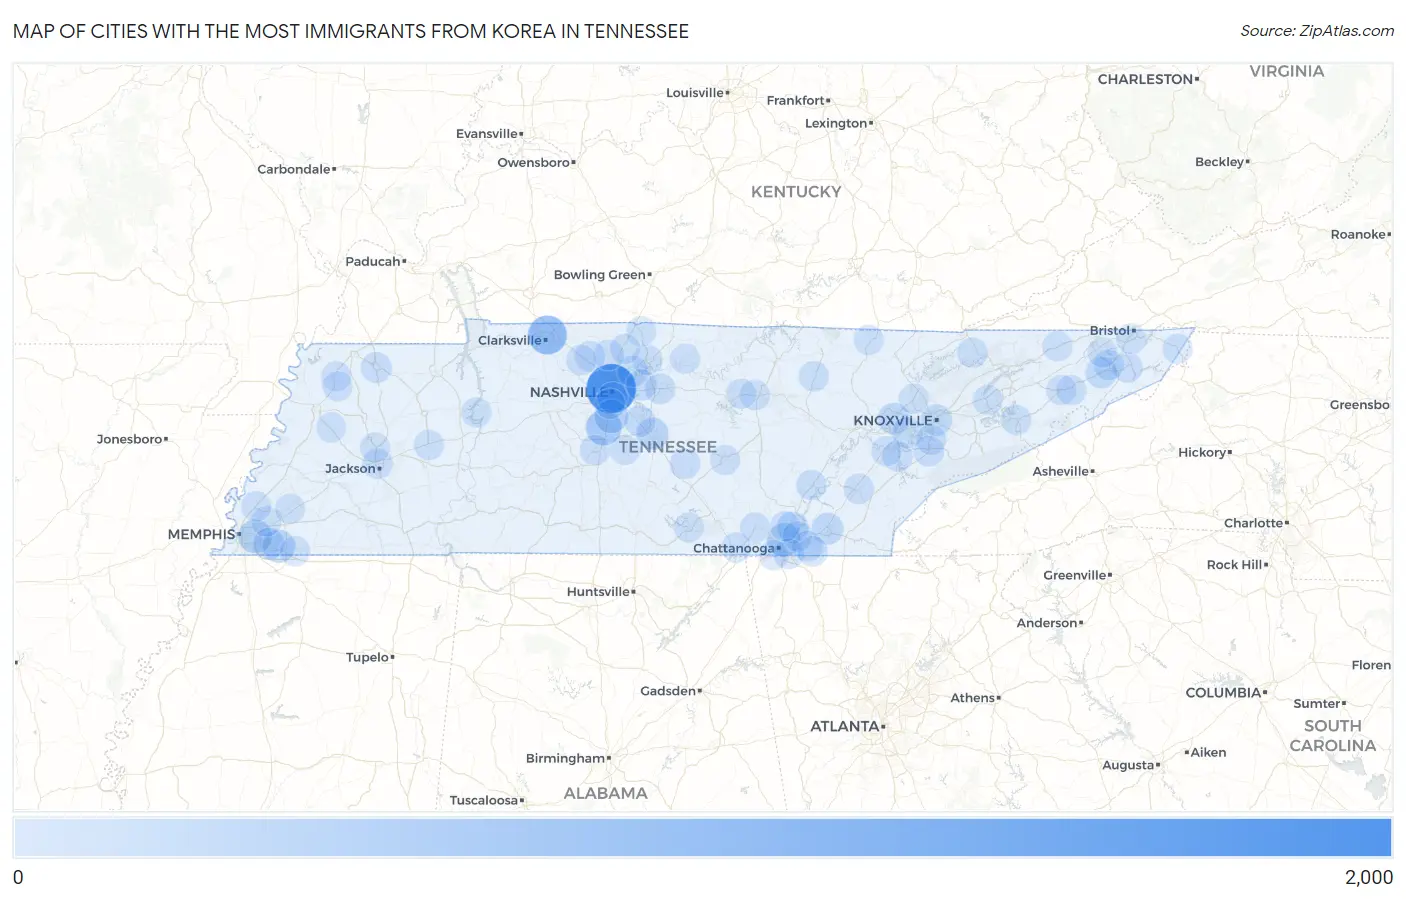
Map of Cities with the Most Immigrants from Korea in Tennessee
0
2,000
Cities with the Most Immigrants from Korea in Tennessee
| City | Korea | vs State | vs National | |
| 1. | Nashville | 1,846 | 8,490(21.74%)#1 | 1,034,299(0.18%)#68 |
| 2. | Clarksville | 808 | 8,490(9.52%)#2 | 1,034,299(0.08%)#188 |
| 3. | Franklin | 490 | 8,490(5.77%)#3 | 1,034,299(0.05%)#326 |
| 4. | Brentwood | 319 | 8,490(3.76%)#4 | 1,034,299(0.03%)#476 |
| 5. | Chattanooga | 305 | 8,490(3.59%)#5 | 1,034,299(0.03%)#500 |
| 6. | Memphis | 304 | 8,490(3.58%)#6 | 1,034,299(0.03%)#503 |
| 7. | Collierville | 248 | 8,490(2.92%)#7 | 1,034,299(0.02%)#603 |
| 8. | Murfreesboro | 195 | 8,490(2.30%)#8 | 1,034,299(0.02%)#762 |
| 9. | Oak Ridge | 152 | 8,490(1.79%)#9 | 1,034,299(0.01%)#927 |
| 10. | Germantown | 148 | 8,490(1.74%)#10 | 1,034,299(0.01%)#947 |
| 11. | Cleveland | 143 | 8,490(1.68%)#11 | 1,034,299(0.01%)#973 |
| 12. | Knoxville | 128 | 8,490(1.51%)#12 | 1,034,299(0.01%)#1,047 |
| 13. | Jonesborough | 120 | 8,490(1.41%)#13 | 1,034,299(0.01%)#1,112 |
| 14. | Middle Valley | 119 | 8,490(1.40%)#14 | 1,034,299(0.01%)#1,120 |
| 15. | Hendersonville | 104 | 8,490(1.22%)#15 | 1,034,299(0.01%)#1,229 |
| 16. | Smyrna | 91 | 8,490(1.07%)#16 | 1,034,299(0.01%)#1,333 |
| 17. | Mount Juliet | 73 | 8,490(0.86%)#17 | 1,034,299(0.01%)#1,540 |
| 18. | Martin | 68 | 8,490(0.80%)#18 | 1,034,299(0.01%)#1,621 |
| 19. | Farragut | 62 | 8,490(0.73%)#19 | 1,034,299(0.01%)#1,698 |
| 20. | Maryville | 54 | 8,490(0.64%)#20 | 1,034,299(0.01%)#1,842 |
| 21. | Lebanon | 49 | 8,490(0.58%)#21 | 1,034,299(0.00%)#1,944 |
| 22. | Greenbrier | 44 | 8,490(0.52%)#22 | 1,034,299(0.00%)#2,071 |
| 23. | Elizabethton | 37 | 8,490(0.44%)#23 | 1,034,299(0.00%)#2,263 |
| 24. | Berry Hill | 37 | 8,490(0.44%)#24 | 1,034,299(0.00%)#2,282 |
| 25. | Collegedale | 35 | 8,490(0.41%)#25 | 1,034,299(0.00%)#2,325 |
| 26. | Jackson | 32 | 8,490(0.38%)#26 | 1,034,299(0.00%)#2,427 |
| 27. | Lakewood Park | 30 | 8,490(0.35%)#27 | 1,034,299(0.00%)#2,550 |
| 28. | Tellico Village | 29 | 8,490(0.34%)#28 | 1,034,299(0.00%)#2,582 |
| 29. | Athens | 28 | 8,490(0.33%)#29 | 1,034,299(0.00%)#2,614 |
| 30. | Harrison | 28 | 8,490(0.33%)#30 | 1,034,299(0.00%)#2,628 |
| 31. | East Ridge | 26 | 8,490(0.31%)#31 | 1,034,299(0.00%)#2,702 |
| 32. | Johnson City | 25 | 8,490(0.29%)#32 | 1,034,299(0.00%)#2,747 |
| 33. | Spring Hill | 25 | 8,490(0.29%)#33 | 1,034,299(0.00%)#2,749 |
| 34. | Gallatin | 24 | 8,490(0.28%)#34 | 1,034,299(0.00%)#2,793 |
| 35. | Coopertown | 24 | 8,490(0.28%)#35 | 1,034,299(0.00%)#2,833 |
| 36. | Dayton | 23 | 8,490(0.27%)#36 | 1,034,299(0.00%)#2,887 |
| 37. | Oak Hill | 23 | 8,490(0.27%)#37 | 1,034,299(0.00%)#2,891 |
| 38. | Grimsley | 21 | 8,490(0.25%)#38 | 1,034,299(0.00%)#3,032 |
| 39. | Pleasant View | 17 | 8,490(0.20%)#39 | 1,034,299(0.00%)#3,296 |
| 40. | Apison | 17 | 8,490(0.20%)#40 | 1,034,299(0.00%)#3,298 |
| 41. | Bartlett | 15 | 8,490(0.18%)#41 | 1,034,299(0.00%)#3,408 |
| 42. | Cookeville | 15 | 8,490(0.18%)#42 | 1,034,299(0.00%)#3,416 |
| 43. | Alcoa | 15 | 8,490(0.18%)#43 | 1,034,299(0.00%)#3,438 |
| 44. | Millington | 15 | 8,490(0.18%)#44 | 1,034,299(0.00%)#3,442 |
| 45. | New Tazewell | 15 | 8,490(0.18%)#45 | 1,034,299(0.00%)#3,475 |
| 46. | Mountain City | 14 | 8,490(0.16%)#46 | 1,034,299(0.00%)#3,571 |
| 47. | Clinton | 13 | 8,490(0.15%)#47 | 1,034,299(0.00%)#3,634 |
| 48. | Portland | 12 | 8,490(0.14%)#48 | 1,034,299(0.00%)#3,744 |
| 49. | Loudon | 12 | 8,490(0.14%)#49 | 1,034,299(0.00%)#3,776 |
| 50. | Falling Water | 12 | 8,490(0.14%)#50 | 1,034,299(0.00%)#3,807 |
| 51. | Kimball | 11 | 8,490(0.13%)#51 | 1,034,299(0.00%)#3,919 |
| 52. | Greeneville | 10 | 8,490(0.12%)#52 | 1,034,299(0.00%)#3,958 |
| 53. | Hartsville Trousdale County | 10 | 8,490(0.12%)#53 | 1,034,299(0.00%)#3,968 |
| 54. | Newport | 10 | 8,490(0.12%)#54 | 1,034,299(0.00%)#3,989 |
| 55. | Mcminnville | 9 | 8,490(0.11%)#55 | 1,034,299(0.00%)#4,078 |
| 56. | Tusculum | 9 | 8,490(0.11%)#56 | 1,034,299(0.00%)#4,138 |
| 57. | Three Way | 8 | 8,490(0.09%)#57 | 1,034,299(0.00%)#4,279 |
| 58. | Spurgeon | 7 | 8,490(0.08%)#58 | 1,034,299(0.00%)#4,375 |
| 59. | Bristol | 6 | 8,490(0.07%)#59 | 1,034,299(0.00%)#4,446 |
| 60. | White House | 6 | 8,490(0.07%)#60 | 1,034,299(0.00%)#4,459 |
| 61. | Winchester | 6 | 8,490(0.07%)#61 | 1,034,299(0.00%)#4,470 |
| 62. | Jefferson City | 6 | 8,490(0.07%)#62 | 1,034,299(0.00%)#4,475 |
| 63. | Surgoinsville | 5 | 8,490(0.06%)#63 | 1,034,299(0.00%)#4,656 |
| 64. | New Johnsonville | 5 | 8,490(0.06%)#64 | 1,034,299(0.00%)#4,667 |
| 65. | Whitwell | 5 | 8,490(0.06%)#65 | 1,034,299(0.00%)#4,672 |
| 66. | Obion | 5 | 8,490(0.06%)#66 | 1,034,299(0.00%)#4,693 |
| 67. | Eagleville | 4 | 8,490(0.05%)#67 | 1,034,299(0.00%)#4,826 |
| 68. | Friendship | 4 | 8,490(0.05%)#68 | 1,034,299(0.00%)#4,842 |
| 69. | Oneida | 3 | 8,490(0.04%)#69 | 1,034,299(0.00%)#4,901 |
| 70. | Trimble | 3 | 8,490(0.04%)#70 | 1,034,299(0.00%)#5,006 |
| 71. | Lookout Mountain | 2 | 8,490(0.02%)#71 | 1,034,299(0.00%)#5,084 |
| 72. | Rossville | 2 | 8,490(0.02%)#72 | 1,034,299(0.00%)#5,127 |
| 73. | Parker S Crossroads | 2 | 8,490(0.02%)#73 | 1,034,299(0.00%)#5,164 |
| 74. | Baxter | 1 | 8,490(0.01%)#74 | 1,034,299(0.00%)#5,267 |
| 75. | Gallaway | 1 | 8,490(0.01%)#75 | 1,034,299(0.00%)#5,301 |
Common Questions
What are the Top 10 Cities with the Most Immigrants from Korea in Tennessee?
Top 10 Cities with the Most Immigrants from Korea in Tennessee are:
#1
1,846
#2
808
#3
490
#4
319
#5
305
#6
304
#7
248
#8
195
#9
152
#10
148
What city has the Most Immigrants from Korea in Tennessee?
Nashville has the Most Immigrants from Korea in Tennessee with 1,846.
What is the Total Immigrants from Korea in the State of Tennessee?
Total Immigrants from Korea in Tennessee is 8,490.
What is the Total Immigrants from Korea in the United States?
Total Immigrants from Korea in the United States is 1,034,299.