Campton Hills, IL
Campton Hills Map
Campton Hills Overview
10,556
TOTAL POPULATION
5,446
MALE POPULATION
5,110
FEMALE POPULATION
106.58
MALES / 100 FEMALES
93.83
FEMALES / 100 MALES
43.2
MEDIAN AGE
3.2
AVG FAMILY SIZE
3.1
AVG HOUSEHOLD SIZE
$74,354
PER CAPITA INCOME
$196,106
AVG FAMILY INCOME
$192,432
AVG HOUSEHOLD INCOME
59.8%
WAGE / INCOME GAP [ % ]
40.2¢/ $1
WAGE / INCOME GAP [ $ ]
$9,273
FAMILY INCOME DEFICIT
0.39
INEQUALITY / GINI INDEX
5,798
LABOR FORCE [ PEOPLE ]
70.3%
PERCENT IN LABOR FORCE
5.9%
UNEMPLOYMENT RATE
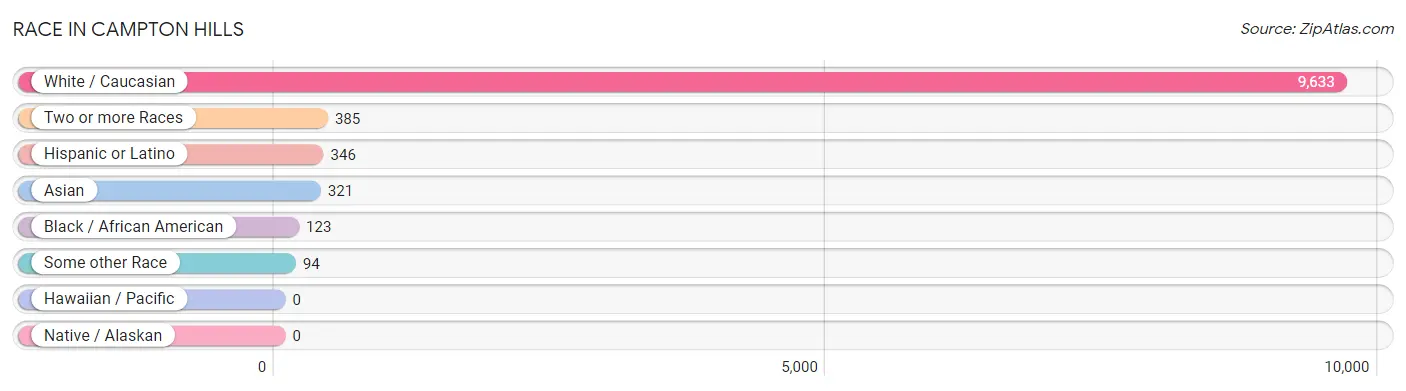
Race in Campton Hills
The most populous races in Campton Hills are White / Caucasian (9,633 | 91.3%), Two or more Races (385 | 3.6%), and Hispanic or Latino (346 | 3.3%).
| Race | # Population | % Population |
| Asian | 321 | 3.0% |
| Black / African American | 123 | 1.2% |
| Hawaiian / Pacific | 0 | 0.0% |
| Hispanic or Latino | 346 | 3.3% |
| Native / Alaskan | 0 | 0.0% |
| White / Caucasian | 9,633 | 91.3% |
| Two or more Races | 385 | 3.6% |
| Some other Race | 94 | 0.9% |
| Total | 10,556 | 100.0% |
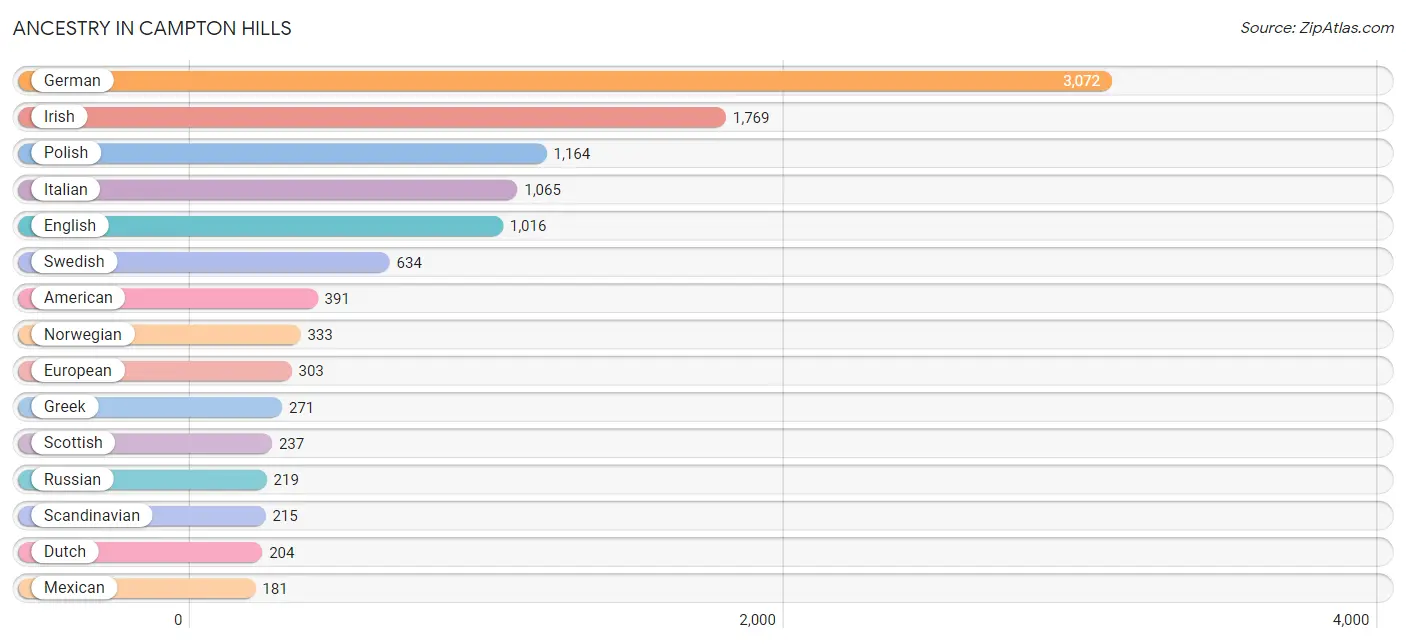
Ancestry in Campton Hills
The most populous ancestries reported in Campton Hills are German (3,072 | 29.1%), Irish (1,769 | 16.8%), Polish (1,164 | 11.0%), Italian (1,065 | 10.1%), and English (1,016 | 9.6%), together accounting for 76.6% of all Campton Hills residents.
| Ancestry | # Population | % Population |
| American | 391 | 3.7% |
| Arab | 18 | 0.2% |
| Austrian | 15 | 0.1% |
| Belgian | 6 | 0.1% |
| Bhutanese | 47 | 0.4% |
| Bulgarian | 6 | 0.1% |
| Burmese | 138 | 1.3% |
| Central American | 21 | 0.2% |
| Czech | 127 | 1.2% |
| Danish | 48 | 0.4% |
| Dutch | 204 | 1.9% |
| Eastern European | 15 | 0.1% |
| Ecuadorian | 43 | 0.4% |
| English | 1,016 | 9.6% |
| European | 303 | 2.9% |
| French | 156 | 1.5% |
| French Canadian | 132 | 1.3% |
| German | 3,072 | 29.1% |
| Greek | 271 | 2.6% |
| Hungarian | 34 | 0.3% |
| Indian (Asian) | 37 | 0.4% |
| Irish | 1,769 | 16.8% |
| Italian | 1,065 | 10.1% |
| Korean | 98 | 0.9% |
| Latvian | 8 | 0.1% |
| Lebanese | 18 | 0.2% |
| Lithuanian | 74 | 0.7% |
| Mexican | 181 | 1.7% |
| Norwegian | 333 | 3.2% |
| Polish | 1,164 | 11.0% |
| Portuguese | 3 | 0.0% |
| Puerto Rican | 101 | 1.0% |
| Romanian | 28 | 0.3% |
| Russian | 219 | 2.1% |
| Salvadoran | 21 | 0.2% |
| Scandinavian | 215 | 2.0% |
| Scotch-Irish | 66 | 0.6% |
| Scottish | 237 | 2.2% |
| Serbian | 61 | 0.6% |
| Slovak | 15 | 0.1% |
| South American | 43 | 0.4% |
| Swedish | 634 | 6.0% |
| Thai | 52 | 0.5% |
| Ukrainian | 20 | 0.2% |
| Welsh | 71 | 0.7% |
| Yugoslavian | 69 | 0.6% | View All 46 Rows |
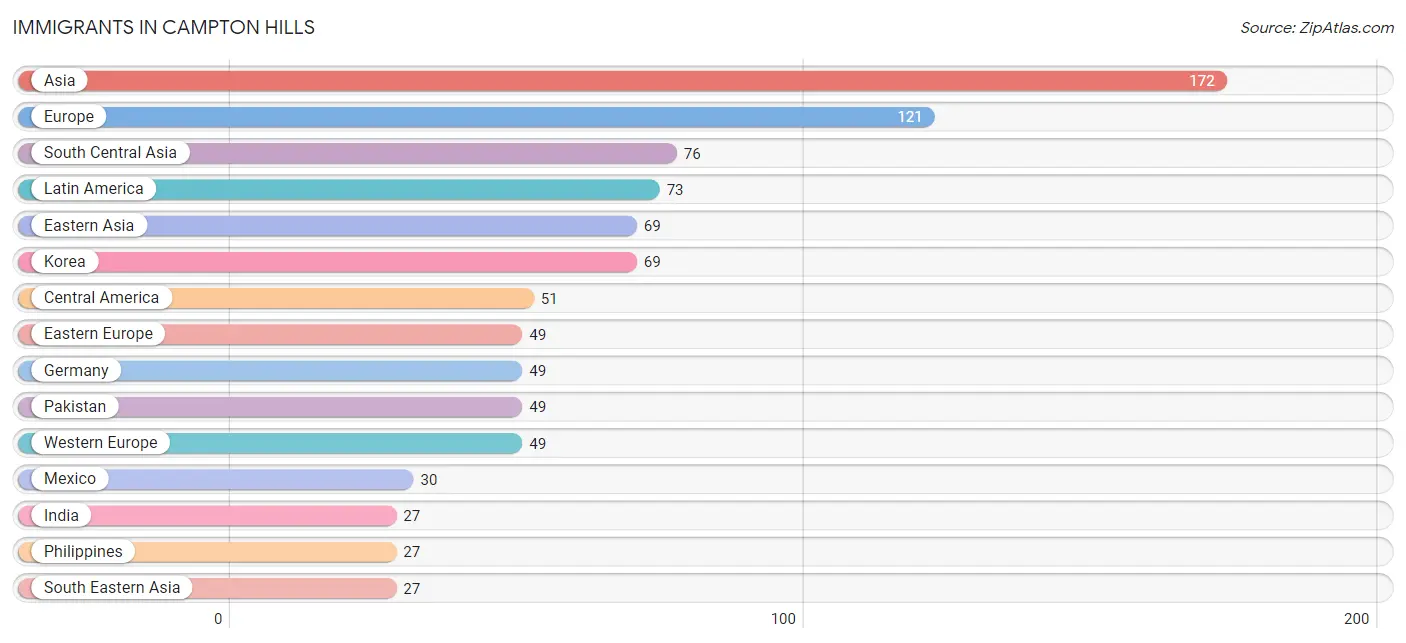
Immigrants in Campton Hills
The most numerous immigrant groups reported in Campton Hills came from Asia (172 | 1.6%), Europe (121 | 1.1%), South Central Asia (76 | 0.7%), Latin America (73 | 0.7%), and Eastern Asia (69 | 0.6%), together accounting for 4.8% of all Campton Hills residents.
| Immigration Origin | # Population | % Population |
| Asia | 172 | 1.6% |
| Central America | 51 | 0.5% |
| Eastern Asia | 69 | 0.6% |
| Eastern Europe | 49 | 0.5% |
| Ecuador | 22 | 0.2% |
| El Salvador | 21 | 0.2% |
| Europe | 121 | 1.1% |
| Germany | 49 | 0.5% |
| India | 27 | 0.3% |
| Korea | 69 | 0.6% |
| Latin America | 73 | 0.7% |
| Mexico | 30 | 0.3% |
| Northern Europe | 23 | 0.2% |
| Pakistan | 49 | 0.5% |
| Philippines | 27 | 0.3% |
| Poland | 16 | 0.2% |
| Romania | 13 | 0.1% |
| Scotland | 17 | 0.2% |
| South America | 22 | 0.2% |
| South Central Asia | 76 | 0.7% |
| South Eastern Asia | 27 | 0.3% |
| Sweden | 6 | 0.1% |
| Ukraine | 20 | 0.2% |
| Western Europe | 49 | 0.5% | View All 24 Rows |
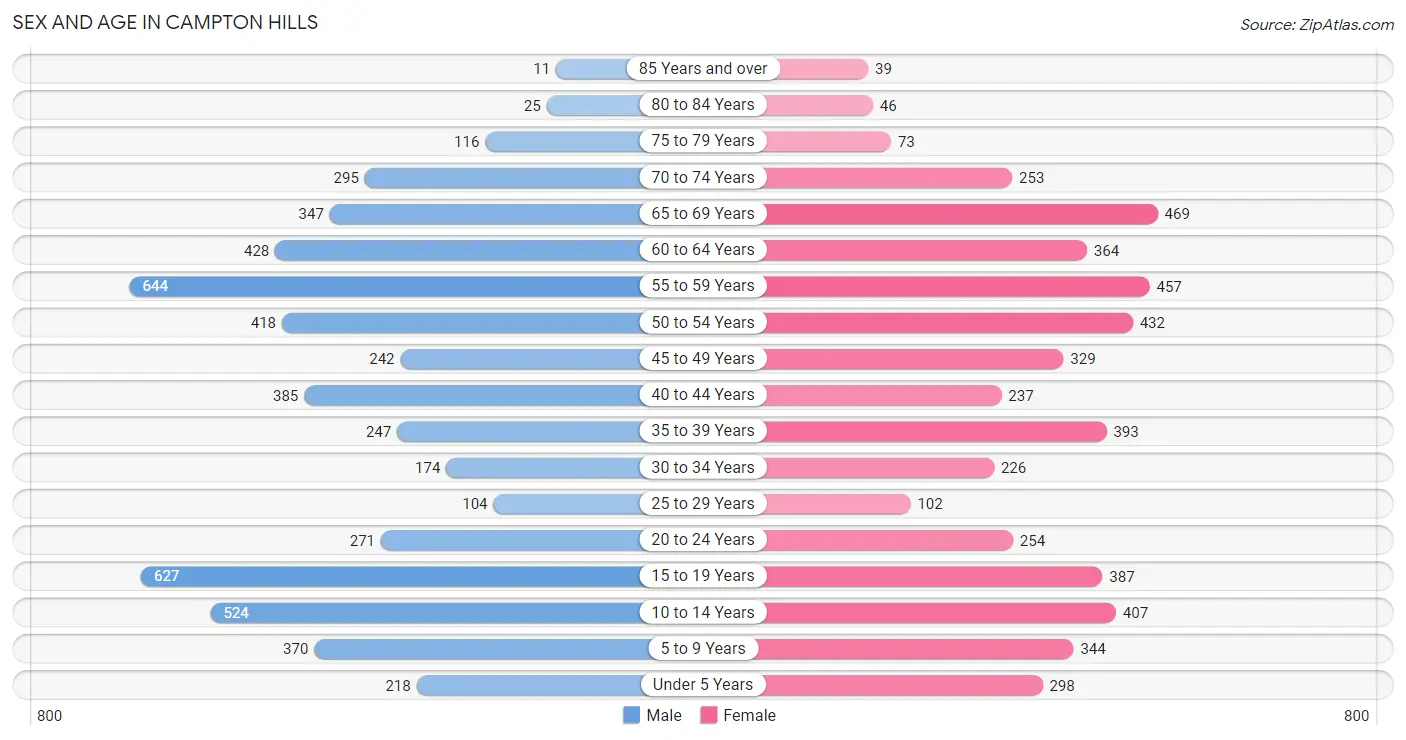
Sex and Age in Campton Hills
Sex and Age in Campton Hills
The most populous age groups in Campton Hills are 55 to 59 Years (644 | 11.8%) for men and 65 to 69 Years (469 | 9.2%) for women.
| Age Bracket | Male | Female |
| Under 5 Years | 218 (4.0%) | 298 (5.8%) |
| 5 to 9 Years | 370 (6.8%) | 344 (6.7%) |
| 10 to 14 Years | 524 (9.6%) | 407 (8.0%) |
| 15 to 19 Years | 627 (11.5%) | 387 (7.6%) |
| 20 to 24 Years | 271 (5.0%) | 254 (5.0%) |
| 25 to 29 Years | 104 (1.9%) | 102 (2.0%) |
| 30 to 34 Years | 174 (3.2%) | 226 (4.4%) |
| 35 to 39 Years | 247 (4.5%) | 393 (7.7%) |
| 40 to 44 Years | 385 (7.1%) | 237 (4.6%) |
| 45 to 49 Years | 242 (4.4%) | 329 (6.4%) |
| 50 to 54 Years | 418 (7.7%) | 432 (8.5%) |
| 55 to 59 Years | 644 (11.8%) | 457 (8.9%) |
| 60 to 64 Years | 428 (7.9%) | 364 (7.1%) |
| 65 to 69 Years | 347 (6.4%) | 469 (9.2%) |
| 70 to 74 Years | 295 (5.4%) | 253 (5.0%) |
| 75 to 79 Years | 116 (2.1%) | 73 (1.4%) |
| 80 to 84 Years | 25 (0.5%) | 46 (0.9%) |
| 85 Years and over | 11 (0.2%) | 39 (0.8%) |
| Total | 5,446 (100.0%) | 5,110 (100.0%) |
Families and Households in Campton Hills
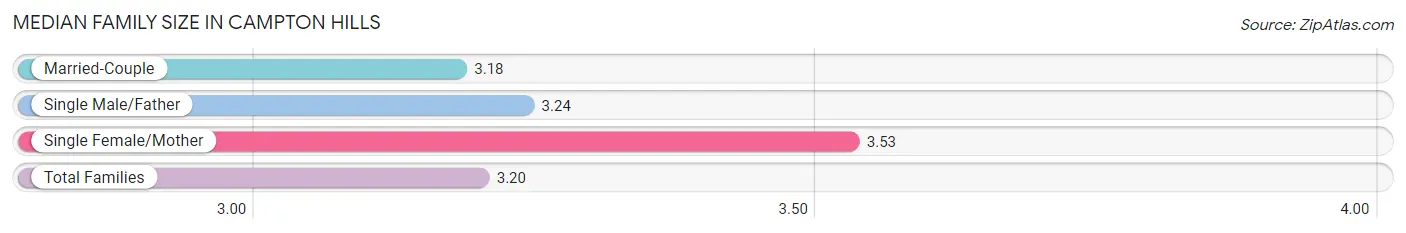
Median Family Size in Campton Hills
The median family size in Campton Hills is 3.20 persons per family, with single female/mother families (124 | 3.9%) accounting for the largest median family size of 3.53 persons per family. On the other hand, married-couple families (2,961 | 92.2%) represent the smallest median family size with 3.18 persons per family.
| Family Type | # Families | Family Size |
| Married-Couple | 2,961 (92.2%) | 3.18 |
| Single Male/Father | 127 (4.0%) | 3.24 |
| Single Female/Mother | 124 (3.9%) | 3.53 |
| Total Families | 3,212 (100.0%) | 3.20 |
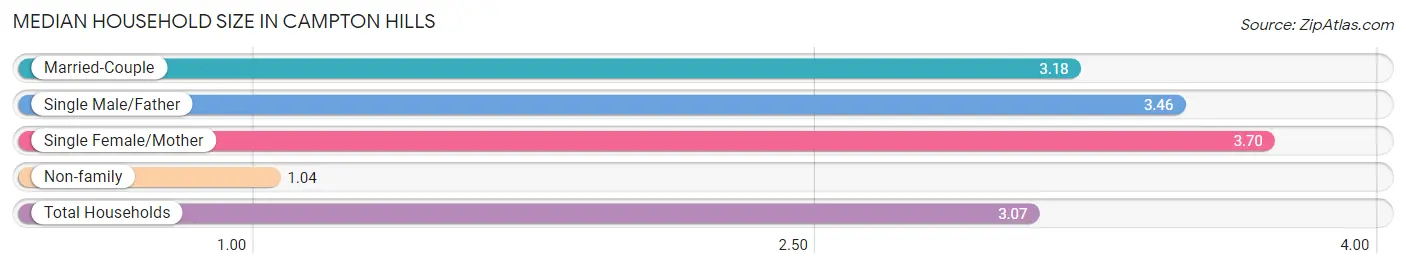
Median Household Size in Campton Hills
The median household size in Campton Hills is 3.07 persons per household, with single female/mother households (124 | 3.6%) accounting for the largest median household size of 3.7 persons per household. non-family households (224 | 6.5%) represent the smallest median household size with 1.04 persons per household.
| Household Type | # Households | Household Size |
| Married-Couple | 2,961 (86.2%) | 3.18 |
| Single Male/Father | 127 (3.7%) | 3.46 |
| Single Female/Mother | 124 (3.6%) | 3.70 |
| Non-family | 224 (6.5%) | 1.04 |
| Total Households | 3,436 (100.0%) | 3.07 |
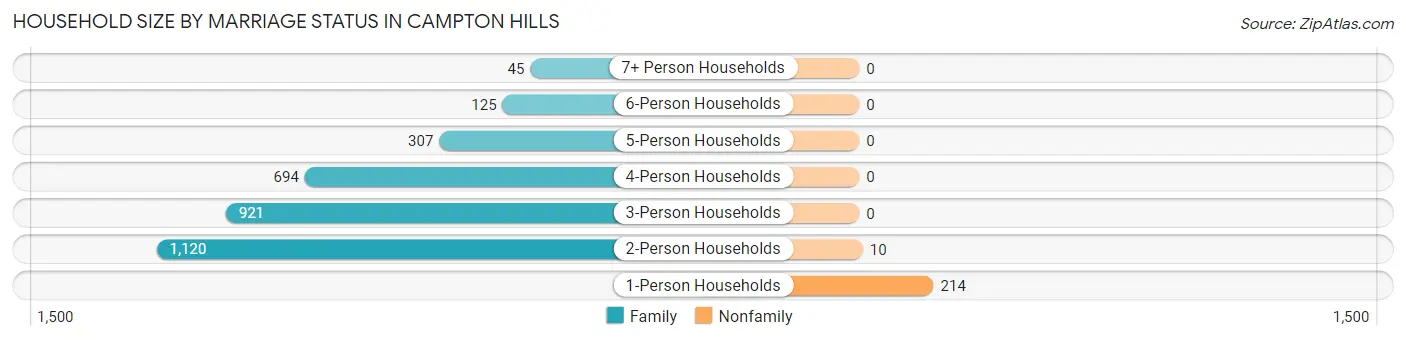
Household Size by Marriage Status in Campton Hills
Out of a total of 3,436 households in Campton Hills, 3,212 (93.5%) are family households, while 224 (6.5%) are nonfamily households. The most numerous type of family households are 2-person households, comprising 1,120, and the most common type of nonfamily households are 1-person households, comprising 214.
| Household Size | Family Households | Nonfamily Households |
| 1-Person Households | - | 214 (6.2%) |
| 2-Person Households | 1,120 (32.6%) | 10 (0.3%) |
| 3-Person Households | 921 (26.8%) | 0 (0.0%) |
| 4-Person Households | 694 (20.2%) | 0 (0.0%) |
| 5-Person Households | 307 (8.9%) | 0 (0.0%) |
| 6-Person Households | 125 (3.6%) | 0 (0.0%) |
| 7+ Person Households | 45 (1.3%) | 0 (0.0%) |
| Total | 3,212 (93.5%) | 224 (6.5%) |
Female Fertility in Campton Hills
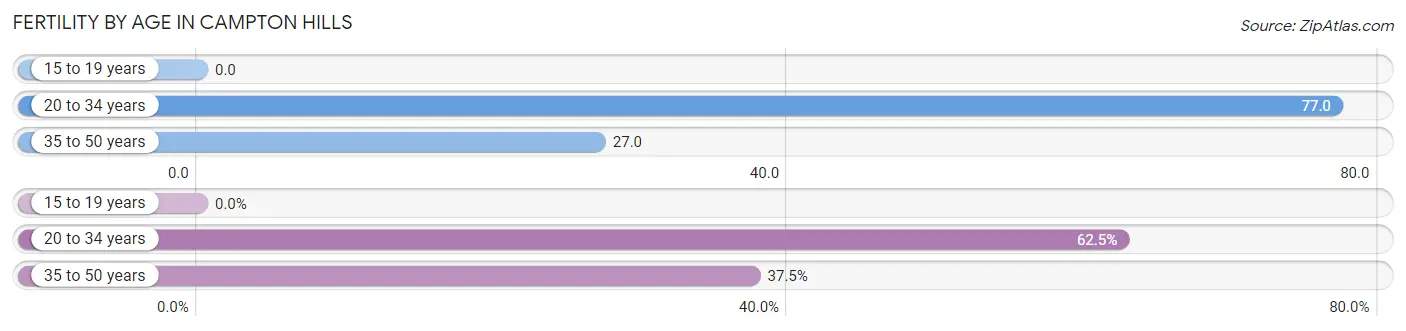
Fertility by Age in Campton Hills
Average fertility rate in Campton Hills is 37.0 births per 1,000 women. Women in the age bracket of 20 to 34 years have the highest fertility rate with 77.0 births per 1,000 women. Women in the age bracket of 20 to 34 years acount for 62.5% of all women with births.
| Age Bracket | Women with Births | Births / 1,000 Women |
| 15 to 19 years | 0 (0.0%) | 0.0 |
| 20 to 34 years | 45 (62.5%) | 77.0 |
| 35 to 50 years | 27 (37.5%) | 27.0 |
| Total | 72 (100.0%) | 37.0 |
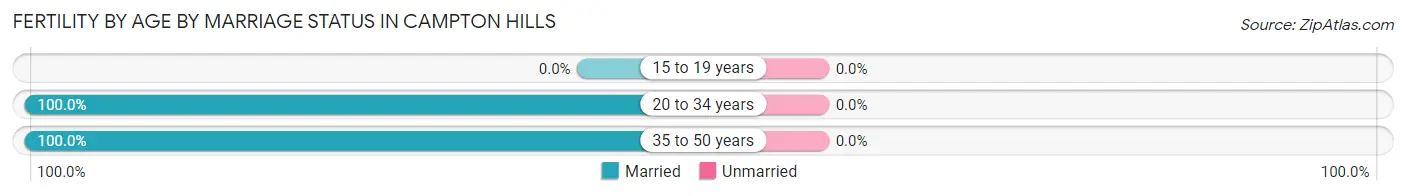
Fertility by Age by Marriage Status in Campton Hills
| Age Bracket | Married | Unmarried |
| 15 to 19 years | 0 (0.0%) | 0 (0.0%) |
| 20 to 34 years | 45 (100.0%) | 0 (0.0%) |
| 35 to 50 years | 27 (100.0%) | 0 (0.0%) |
| Total | 72 (100.0%) | 0 (0.0%) |
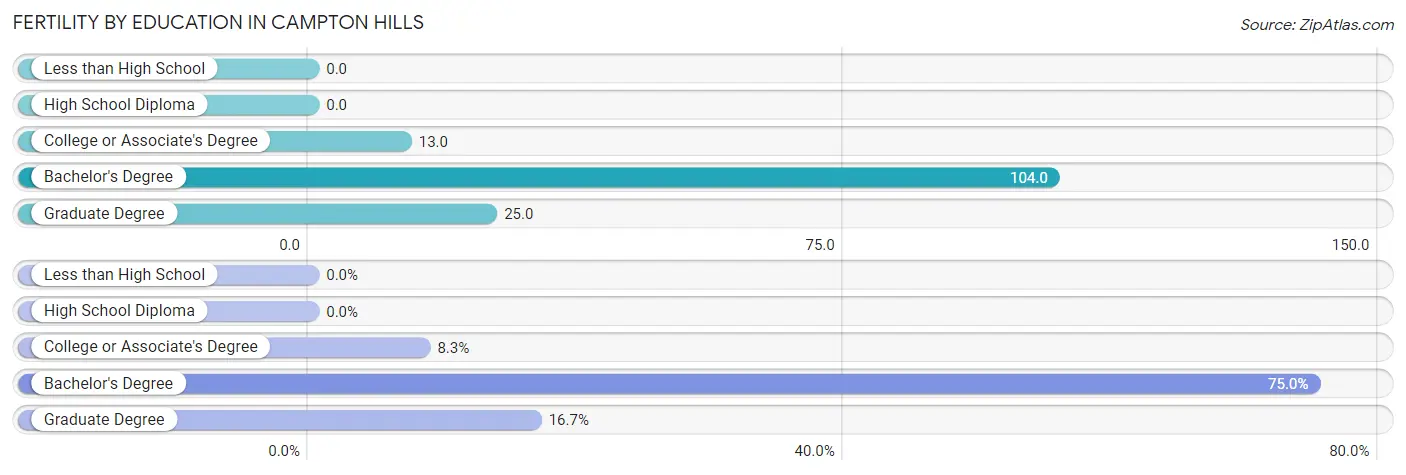
Fertility by Education in Campton Hills
| Educational Attainment | Women with Births | Births / 1,000 Women |
| Less than High School | 0 (0.0%) | 0.0 |
| High School Diploma | 0 (0.0%) | 0.0 |
| College or Associate's Degree | 6 (8.3%) | 13.0 |
| Bachelor's Degree | 54 (75.0%) | 104.0 |
| Graduate Degree | 12 (16.7%) | 25.0 |
| Total | 72 (100.0%) | 37.0 |
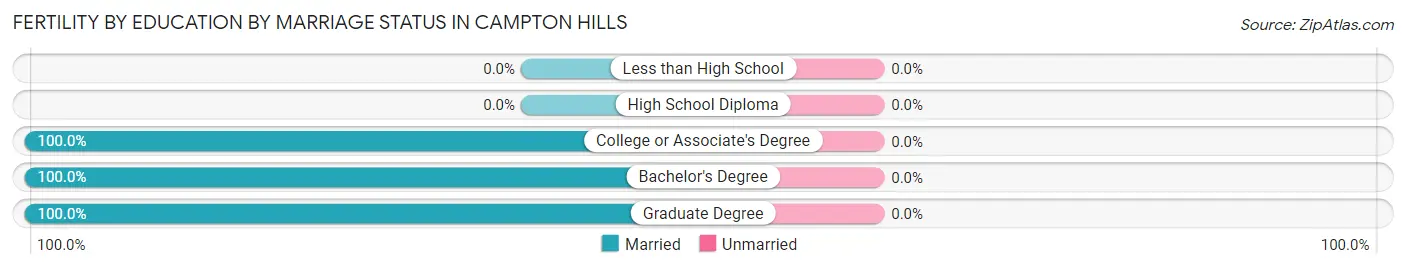
Fertility by Education by Marriage Status in Campton Hills
| Educational Attainment | Married | Unmarried |
| Less than High School | 0 (0.0%) | 0 (0.0%) |
| High School Diploma | 0 (0.0%) | 0 (0.0%) |
| College or Associate's Degree | 6 (100.0%) | 0 (0.0%) |
| Bachelor's Degree | 54 (100.0%) | 0 (0.0%) |
| Graduate Degree | 12 (100.0%) | 0 (0.0%) |
| Total | 72 (100.0%) | 0 (0.0%) |
Income in Campton Hills
Income Overview in Campton Hills
Per Capita Income in Campton Hills is $74,354, while median incomes of families and households are $196,106 and $192,432 respectively.
| Characteristic | Number | Measure |
| Per Capita Income | 10,556 | $74,354 |
| Median Family Income | 3,212 | $196,106 |
| Mean Family Income | 3,212 | $254,056 |
| Median Household Income | 3,436 | $192,432 |
| Mean Household Income | 3,436 | $244,825 |
| Income Deficit | 3,212 | $9,273 |
| Wage / Income Gap (%) | 10,556 | 59.75% |
| Wage / Income Gap ($) | 10,556 | 40.25¢ per $1 |
| Gini / Inequality Index | 10,556 | 0.39 |
Earnings by Sex in Campton Hills
Average Earnings in Campton Hills are $72,514, $100,483 for men and $40,441 for women, a difference of 59.8%.
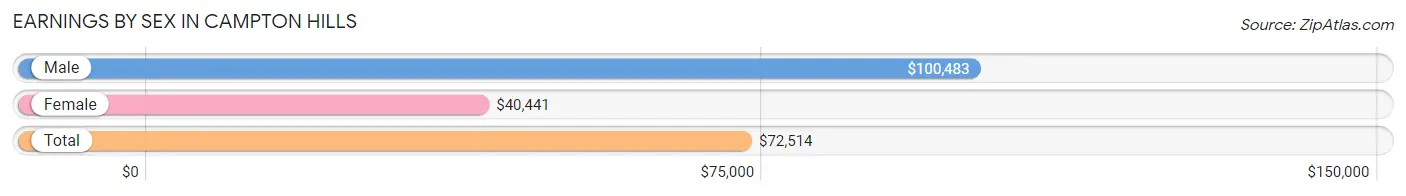
| Sex | Number | Average Earnings |
| Male | 3,313 (55.9%) | $100,483 |
| Female | 2,616 (44.1%) | $40,441 |
| Total | 5,929 (100.0%) | $72,514 |
Earnings by Sex by Income Bracket in Campton Hills
The most common earnings brackets in Campton Hills are $100,000+ for men (1,665 | 50.3%) and $100,000+ for women (587 | 22.4%).
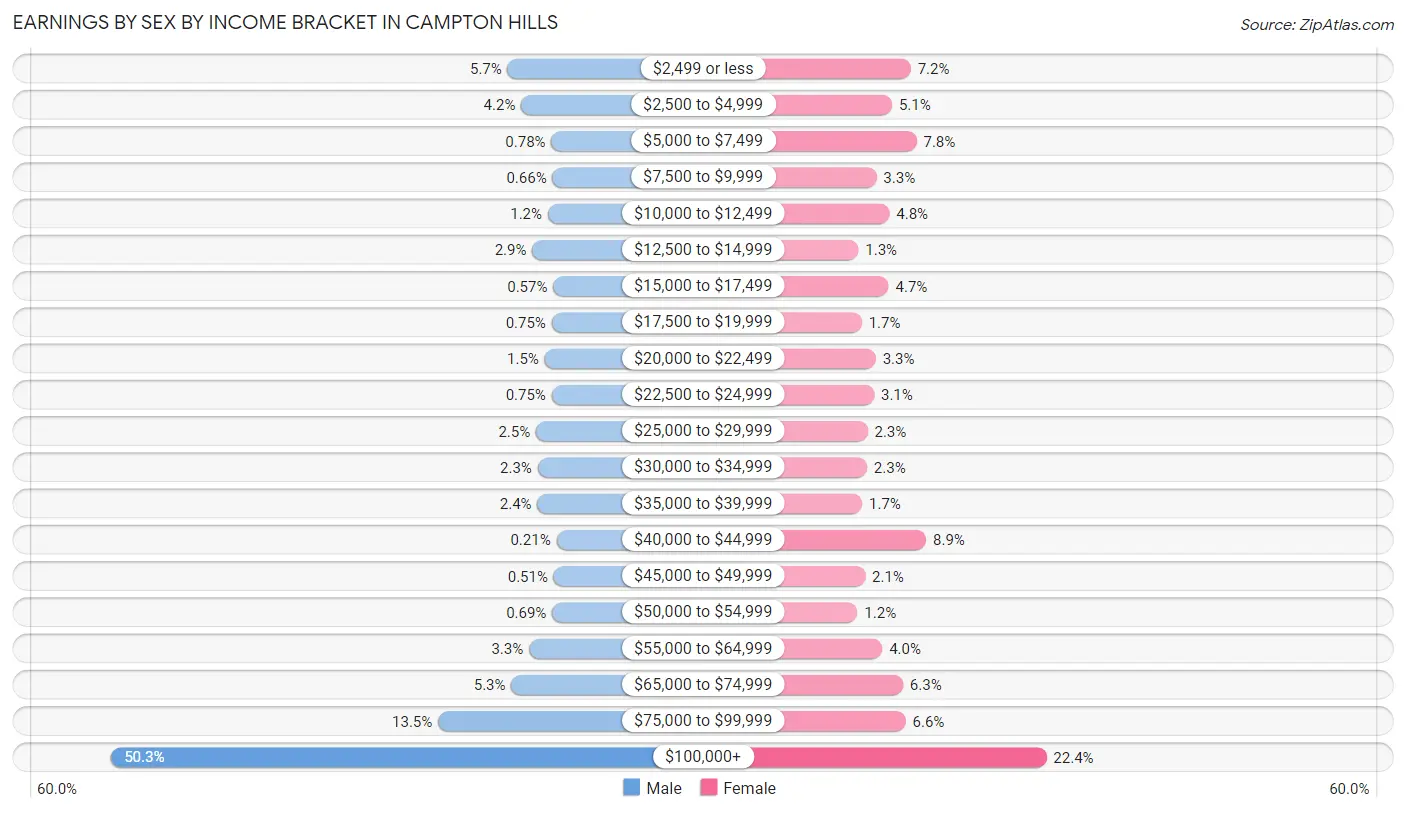
| Income | Male | Female |
| $2,499 or less | 189 (5.7%) | 188 (7.2%) |
| $2,500 to $4,999 | 138 (4.2%) | 133 (5.1%) |
| $5,000 to $7,499 | 26 (0.8%) | 205 (7.8%) |
| $7,500 to $9,999 | 22 (0.7%) | 87 (3.3%) |
| $10,000 to $12,499 | 39 (1.2%) | 125 (4.8%) |
| $12,500 to $14,999 | 97 (2.9%) | 34 (1.3%) |
| $15,000 to $17,499 | 19 (0.6%) | 123 (4.7%) |
| $17,500 to $19,999 | 25 (0.7%) | 44 (1.7%) |
| $20,000 to $22,499 | 51 (1.5%) | 85 (3.3%) |
| $22,500 to $24,999 | 25 (0.7%) | 80 (3.1%) |
| $25,000 to $29,999 | 83 (2.5%) | 61 (2.3%) |
| $30,000 to $34,999 | 77 (2.3%) | 59 (2.3%) |
| $35,000 to $39,999 | 78 (2.4%) | 45 (1.7%) |
| $40,000 to $44,999 | 7 (0.2%) | 233 (8.9%) |
| $45,000 to $49,999 | 17 (0.5%) | 54 (2.1%) |
| $50,000 to $54,999 | 23 (0.7%) | 31 (1.2%) |
| $55,000 to $64,999 | 109 (3.3%) | 104 (4.0%) |
| $65,000 to $74,999 | 175 (5.3%) | 165 (6.3%) |
| $75,000 to $99,999 | 448 (13.5%) | 173 (6.6%) |
| $100,000+ | 1,665 (50.3%) | 587 (22.4%) |
| Total | 3,313 (100.0%) | 2,616 (100.0%) |
Earnings by Sex by Educational Attainment in Campton Hills
Average earnings in Campton Hills are $116,105 for men and $45,139 for women, a difference of 61.1%. Men with an educational attainment of graduate degree enjoy the highest average annual earnings of $171,111, while those with high school diploma education earn the least with $77,917. Women with an educational attainment of graduate degree earn the most with the average annual earnings of $104,659, while those with college or associate's degree education have the smallest earnings of $40,939.
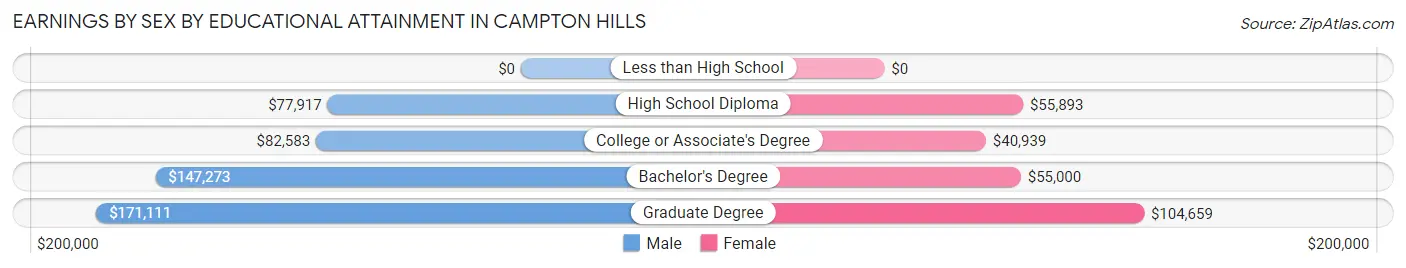
| Educational Attainment | Male Income | Female Income |
| Less than High School | - | - |
| High School Diploma | $77,917 | $55,893 |
| College or Associate's Degree | $82,583 | $40,939 |
| Bachelor's Degree | $147,273 | $55,000 |
| Graduate Degree | $171,111 | $104,659 |
| Total | $116,105 | $45,139 |
Family Income in Campton Hills
Family Income Brackets in Campton Hills
According to the Campton Hills family income data, there are 1,519 families falling into the $200,000+ income range, which is the most common income bracket and makes up 47.3% of all families. Conversely, the $10,000 to $14,999 income bracket is the least frequent group with only 6 families (0.2%) belonging to this category.
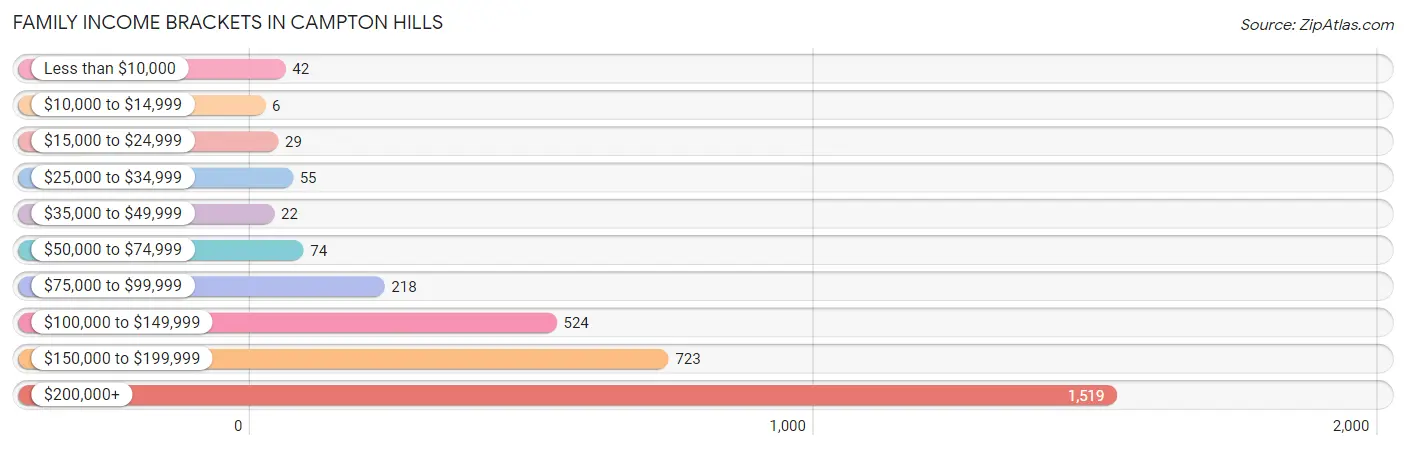
| Income Bracket | # Families | % Families |
| Less than $10,000 | 42 | 1.3% |
| $10,000 to $14,999 | 6 | 0.2% |
| $15,000 to $24,999 | 29 | 0.9% |
| $25,000 to $34,999 | 55 | 1.7% |
| $35,000 to $49,999 | 22 | 0.7% |
| $50,000 to $74,999 | 74 | 2.3% |
| $75,000 to $99,999 | 218 | 6.8% |
| $100,000 to $149,999 | 524 | 16.3% |
| $150,000 to $199,999 | 723 | 22.5% |
| $200,000+ | 1,519 | 47.3% |
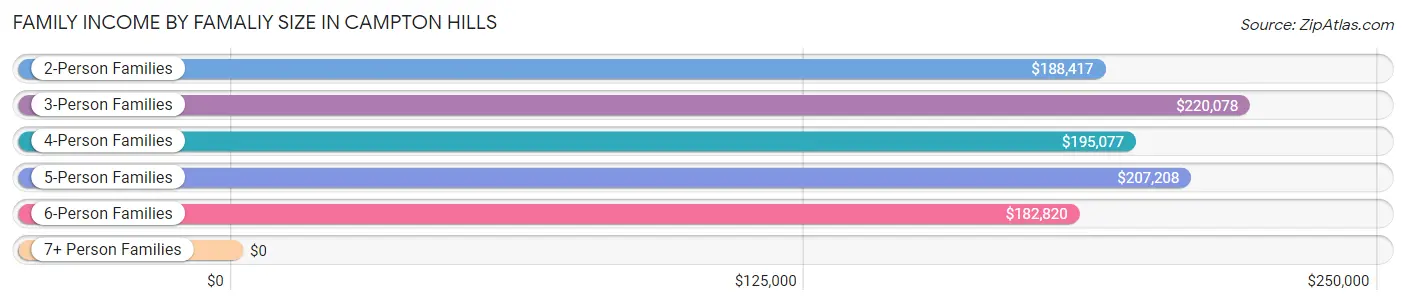
Family Income by Famaliy Size in Campton Hills
3-person families (937 | 29.2%) account for the highest median family income in Campton Hills with $220,078 per family, while 2-person families (1,133 | 35.3%) have the highest median income of $94,208 per family member.
| Income Bracket | # Families | Median Income |
| 2-Person Families | 1,133 (35.3%) | $188,417 |
| 3-Person Families | 937 (29.2%) | $220,078 |
| 4-Person Families | 665 (20.7%) | $195,077 |
| 5-Person Families | 307 (9.6%) | $207,208 |
| 6-Person Families | 125 (3.9%) | $182,820 |
| 7+ Person Families | 45 (1.4%) | $0 |
| Total | 3,212 (100.0%) | $196,106 |
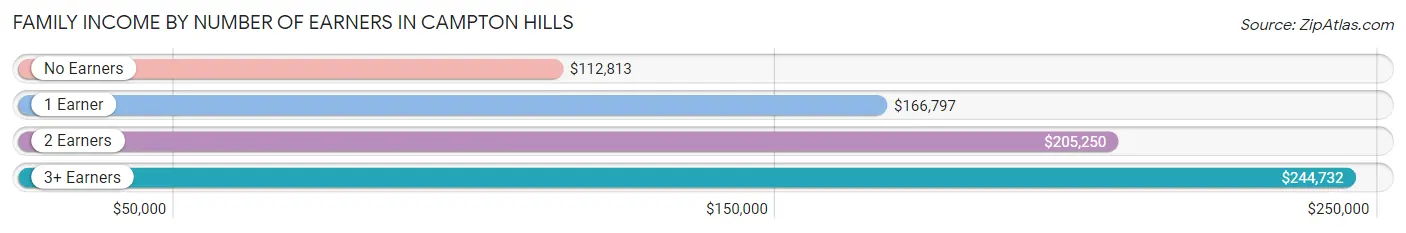
Family Income by Number of Earners in Campton Hills
The median family income in Campton Hills is $196,106, with families comprising 3+ earners (645) having the highest median family income of $244,732, while families with no earners (286) have the lowest median family income of $112,813, accounting for 20.1% and 8.9% of families, respectively.
| Number of Earners | # Families | Median Income |
| No Earners | 286 (8.9%) | $112,813 |
| 1 Earner | 765 (23.8%) | $166,797 |
| 2 Earners | 1,516 (47.2%) | $205,250 |
| 3+ Earners | 645 (20.1%) | $244,732 |
| Total | 3,212 (100.0%) | $196,106 |
Household Income in Campton Hills
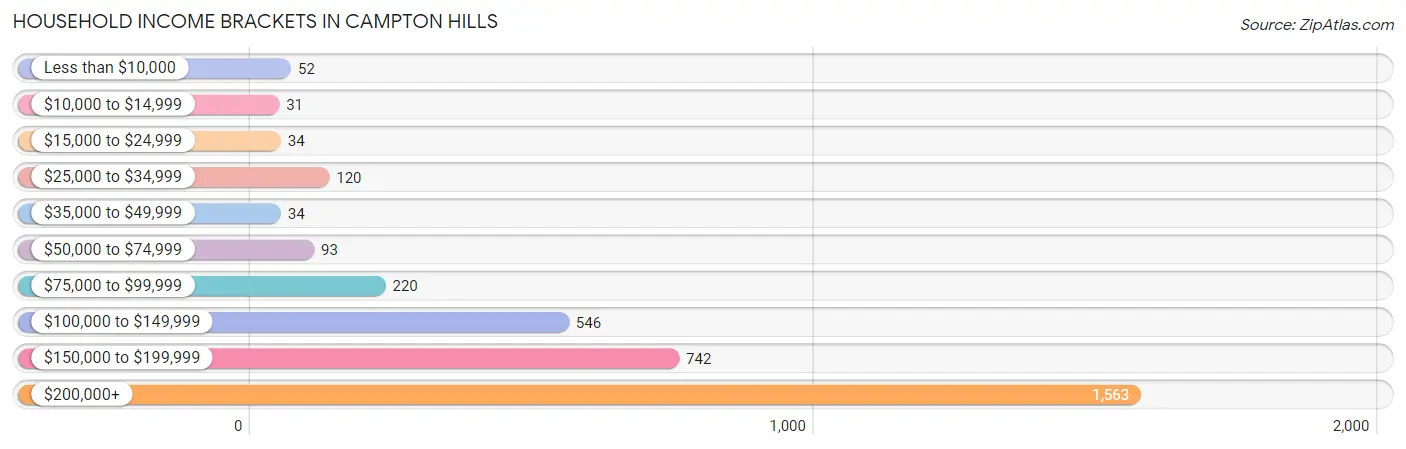
Household Income Brackets in Campton Hills
With 1,563 households falling in the category, the $200,000+ income range is the most frequent in Campton Hills, accounting for 45.5% of all households. In contrast, only 31 households (0.9%) fall into the $10,000 to $14,999 income bracket, making it the least populous group.
| Income Bracket | # Households | % Households |
| Less than $10,000 | 52 | 1.5% |
| $10,000 to $14,999 | 31 | 0.9% |
| $15,000 to $24,999 | 34 | 1.0% |
| $25,000 to $34,999 | 120 | 3.5% |
| $35,000 to $49,999 | 34 | 1.0% |
| $50,000 to $74,999 | 93 | 2.7% |
| $75,000 to $99,999 | 220 | 6.4% |
| $100,000 to $149,999 | 546 | 15.9% |
| $150,000 to $199,999 | 742 | 21.6% |
| $200,000+ | 1,563 | 45.5% |
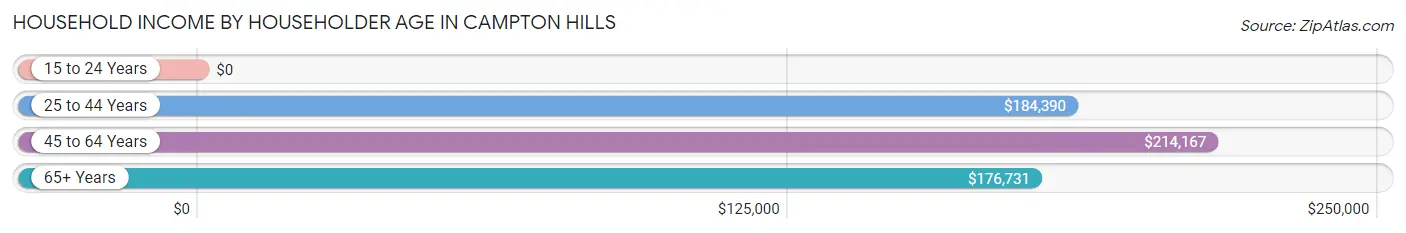
Household Income by Householder Age in Campton Hills
The median household income in Campton Hills is $192,432, with the highest median household income of $214,167 found in the 45 to 64 years age bracket for the primary householder. A total of 1,578 households (45.9%) fall into this category. Meanwhile, the 15 to 24 years age bracket for the primary householder has the lowest median household income of $0, with 21 households (0.6%) in this group.
| Income Bracket | # Households | Median Income |
| 15 to 24 Years | 21 (0.6%) | $0 |
| 25 to 44 Years | 769 (22.4%) | $184,390 |
| 45 to 64 Years | 1,578 (45.9%) | $214,167 |
| 65+ Years | 1,068 (31.1%) | $176,731 |
| Total | 3,436 (100.0%) | $192,432 |
Poverty in Campton Hills
Income Below Poverty by Sex and Age in Campton Hills
With 2.5% poverty level for males and 4.5% for females among the residents of Campton Hills, 75 year old and over males and 18 to 24 year old females are the most vulnerable to poverty, with 19 males (12.5%) and 57 females (13.7%) in their respective age groups living below the poverty level.
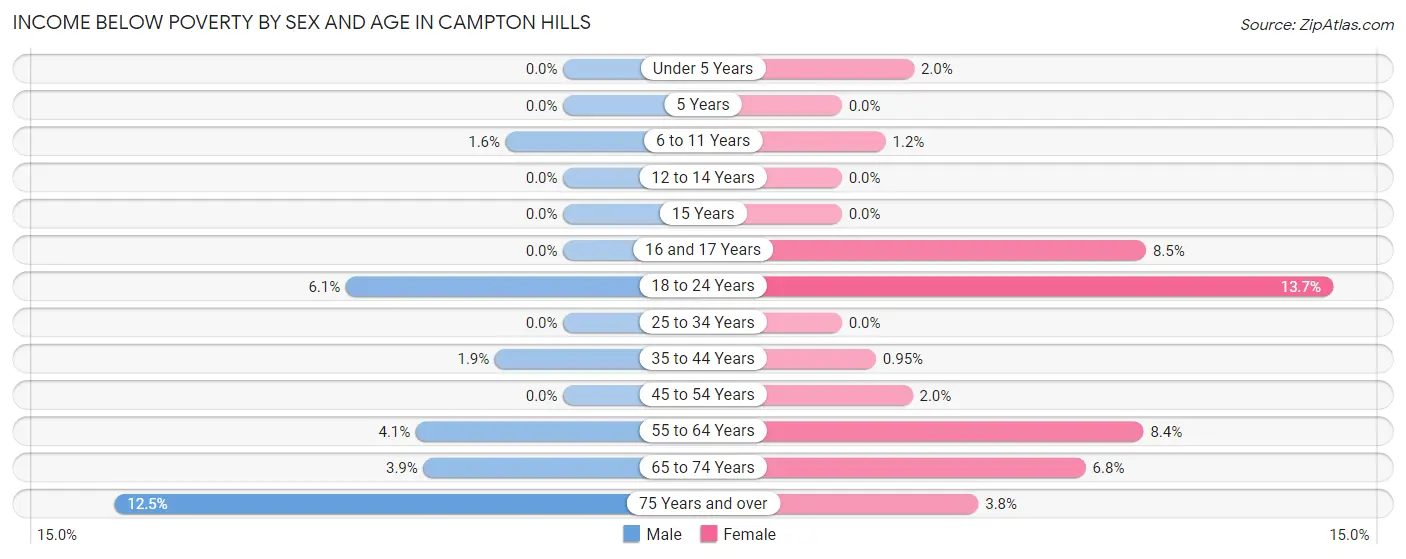
| Age Bracket | Male | Female |
| Under 5 Years | 0 (0.0%) | 6 (2.0%) |
| 5 Years | 0 (0.0%) | 0 (0.0%) |
| 6 to 11 Years | 7 (1.6%) | 6 (1.2%) |
| 12 to 14 Years | 0 (0.0%) | 0 (0.0%) |
| 15 Years | 0 (0.0%) | 0 (0.0%) |
| 16 and 17 Years | 0 (0.0%) | 15 (8.5%) |
| 18 to 24 Years | 32 (6.0%) | 57 (13.7%) |
| 25 to 34 Years | 0 (0.0%) | 0 (0.0%) |
| 35 to 44 Years | 12 (1.9%) | 6 (0.9%) |
| 45 to 54 Years | 0 (0.0%) | 15 (2.0%) |
| 55 to 64 Years | 44 (4.1%) | 69 (8.4%) |
| 65 to 74 Years | 25 (3.9%) | 49 (6.8%) |
| 75 Years and over | 19 (12.5%) | 6 (3.8%) |
| Total | 139 (2.5%) | 229 (4.5%) |
Income Above Poverty by Sex and Age in Campton Hills
According to the poverty statistics in Campton Hills, males aged under 5 years and females aged 5 years are the age groups that are most secure financially, with 100.0% of males and 100.0% of females in these age groups living above the poverty line.
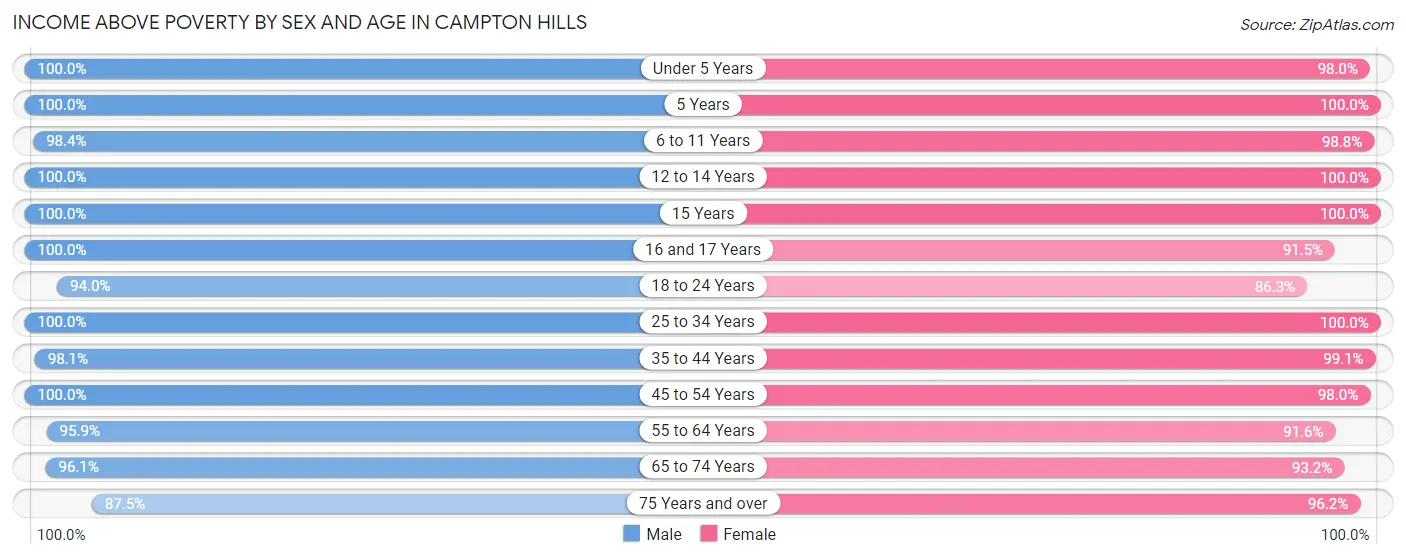
| Age Bracket | Male | Female |
| Under 5 Years | 218 (100.0%) | 292 (98.0%) |
| 5 Years | 95 (100.0%) | 64 (100.0%) |
| 6 to 11 Years | 430 (98.4%) | 485 (98.8%) |
| 12 to 14 Years | 362 (100.0%) | 196 (100.0%) |
| 15 Years | 100 (100.0%) | 47 (100.0%) |
| 16 and 17 Years | 269 (100.0%) | 162 (91.5%) |
| 18 to 24 Years | 497 (94.0%) | 360 (86.3%) |
| 25 to 34 Years | 278 (100.0%) | 328 (100.0%) |
| 35 to 44 Years | 620 (98.1%) | 624 (99.1%) |
| 45 to 54 Years | 660 (100.0%) | 746 (98.0%) |
| 55 to 64 Years | 1,028 (95.9%) | 752 (91.6%) |
| 65 to 74 Years | 617 (96.1%) | 673 (93.2%) |
| 75 Years and over | 133 (87.5%) | 152 (96.2%) |
| Total | 5,307 (97.5%) | 4,881 (95.5%) |
Income Below Poverty Among Married-Couple Families in Campton Hills
The poverty statistics for married-couple families in Campton Hills show that 3.1% or 93 of the total 2,961 families live below the poverty line. Families with no children have the highest poverty rate of 4.2%, comprising of 71 families. On the other hand, families with 5 or more children have the lowest poverty rate of 0.0%, which includes 0 families.
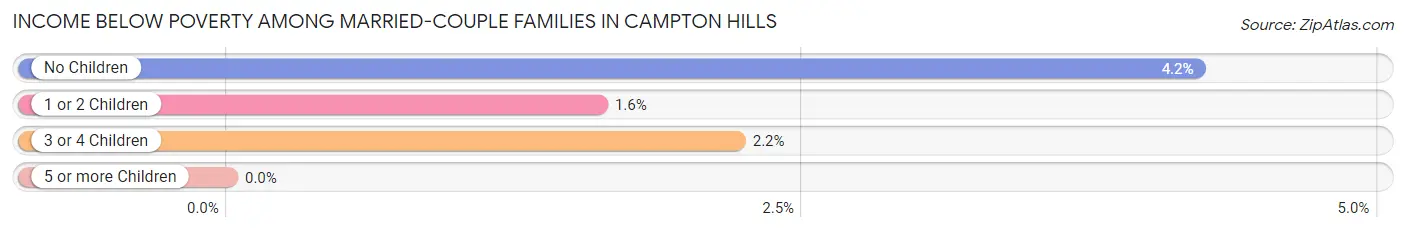
| Children | Above Poverty | Below Poverty |
| No Children | 1,616 (95.8%) | 71 (4.2%) |
| 1 or 2 Children | 977 (98.4%) | 16 (1.6%) |
| 3 or 4 Children | 266 (97.8%) | 6 (2.2%) |
| 5 or more Children | 9 (100.0%) | 0 (0.0%) |
| Total | 2,868 (96.9%) | 93 (3.1%) |
Income Below Poverty Among Single-Parent Households in Campton Hills
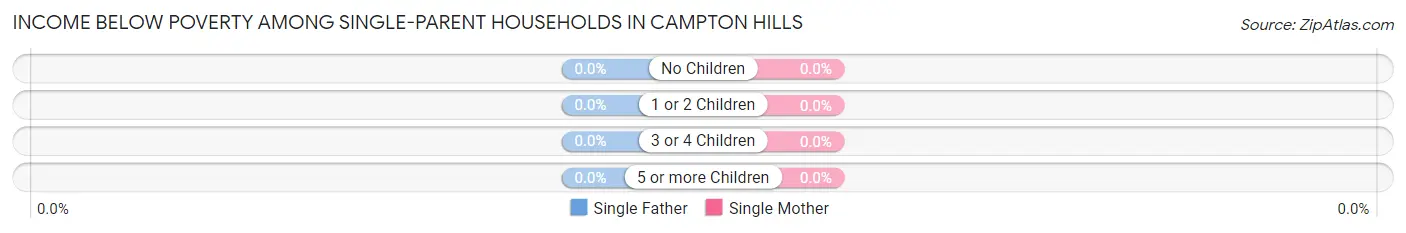
| Children | Single Father | Single Mother |
| No Children | 0 (0.0%) | 0 (0.0%) |
| 1 or 2 Children | 0 (0.0%) | 0 (0.0%) |
| 3 or 4 Children | 0 (0.0%) | 0 (0.0%) |
| 5 or more Children | 0 (0.0%) | 0 (0.0%) |
| Total | 0 (0.0%) | 0 (0.0%) |
Income Below Poverty Among Married-Couple vs Single-Parent Households in Campton Hills
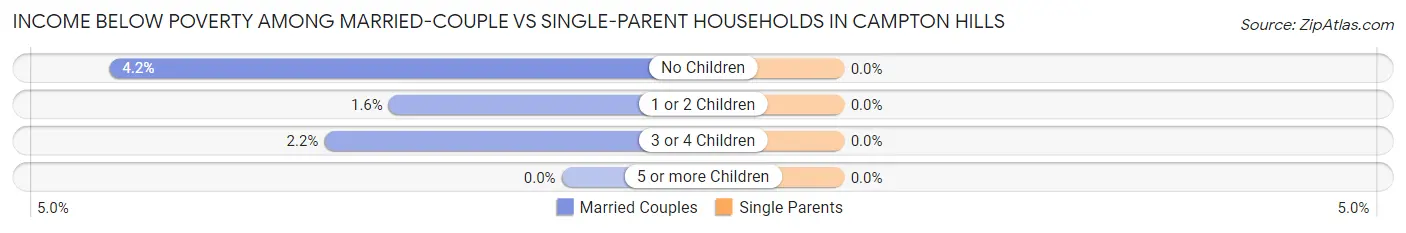
| Children | Married-Couple Families | Single-Parent Households |
| No Children | 71 (4.2%) | 0 (0.0%) |
| 1 or 2 Children | 16 (1.6%) | 0 (0.0%) |
| 3 or 4 Children | 6 (2.2%) | 0 (0.0%) |
| 5 or more Children | 0 (0.0%) | 0 (0.0%) |
| Total | 93 (3.1%) | 0 (0.0%) |
Employment Characteristics in Campton Hills
Employment by Class of Employer in Campton Hills
Among the 5,140 employed individuals in Campton Hills, private company employees (3,476 | 67.6%), self-employed (incorporated) (436 | 8.5%), and self-employed (not incorporated) (385 | 7.5%) make up the most common classes of employment.
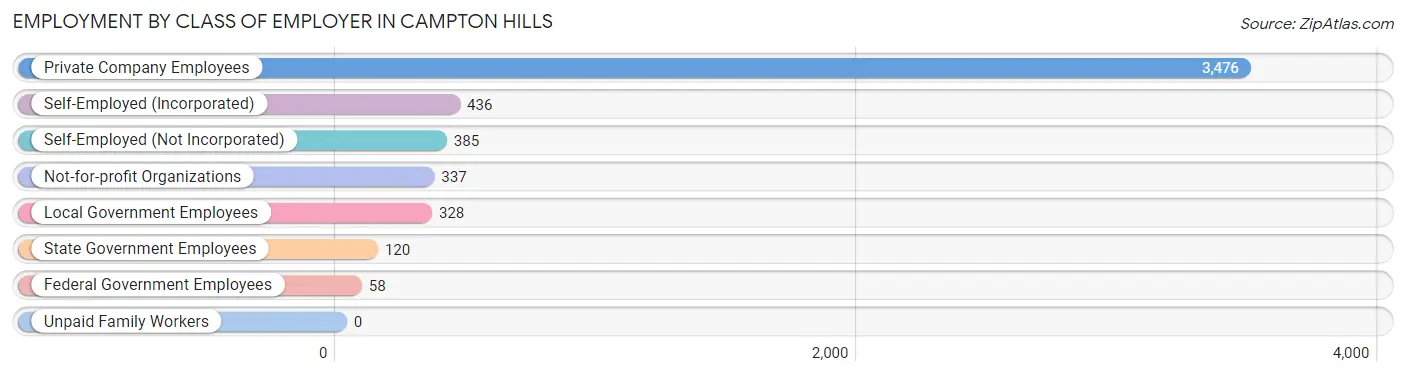
| Employer Class | # Employees | % Employees |
| Private Company Employees | 3,476 | 67.6% |
| Self-Employed (Incorporated) | 436 | 8.5% |
| Self-Employed (Not Incorporated) | 385 | 7.5% |
| Not-for-profit Organizations | 337 | 6.6% |
| Local Government Employees | 328 | 6.4% |
| State Government Employees | 120 | 2.3% |
| Federal Government Employees | 58 | 1.1% |
| Unpaid Family Workers | 0 | 0.0% |
| Total | 5,140 | 100.0% |
Employment Status by Age in Campton Hills
According to the labor force statistics for Campton Hills, out of the total population over 16 years of age (8,248), 70.3% or 5,798 individuals are in the labor force, with 5.9% or 342 of them unemployed. The age group with the highest labor force participation rate is 25 to 29 years, with 100.0% or 206 individuals in the labor force. Within the labor force, the 20 to 24 years age range has the highest percentage of unemployed individuals, with 33.2% or 148 of them being unemployed.
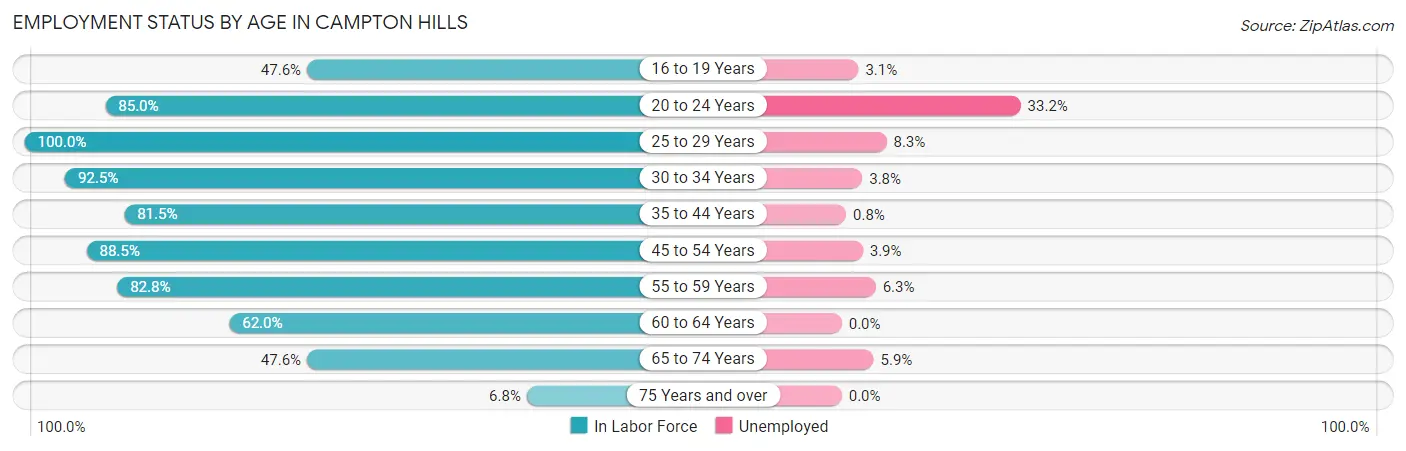
| Age Bracket | In Labor Force | Unemployed |
| 16 to 19 Years | 413 (47.6%) | 13 (3.1%) |
| 20 to 24 Years | 446 (85.0%) | 148 (33.2%) |
| 25 to 29 Years | 206 (100.0%) | 17 (8.3%) |
| 30 to 34 Years | 370 (92.5%) | 14 (3.8%) |
| 35 to 44 Years | 1,029 (81.5%) | 8 (0.8%) |
| 45 to 54 Years | 1,258 (88.5%) | 49 (3.9%) |
| 55 to 59 Years | 912 (82.8%) | 57 (6.3%) |
| 60 to 64 Years | 491 (62.0%) | 0 (0.0%) |
| 65 to 74 Years | 649 (47.6%) | 38 (5.9%) |
| 75 Years and over | 21 (6.8%) | 0 (0.0%) |
| Total | 5,798 (70.3%) | 342 (5.9%) |
Employment Status by Educational Attainment in Campton Hills
According to labor force statistics for Campton Hills, 82.3% of individuals (4,265) out of the total population between 25 and 64 years of age (5,182) are in the labor force, with 3.4% or 145 of them being unemployed. The group with the highest labor force participation rate are those with the educational attainment of less than high school, with 100.0% or 40 individuals in the labor force. Within the labor force, individuals with college / associate degree education have the highest percentage of unemployment, with 5.5% or 52 of them being unemployed.
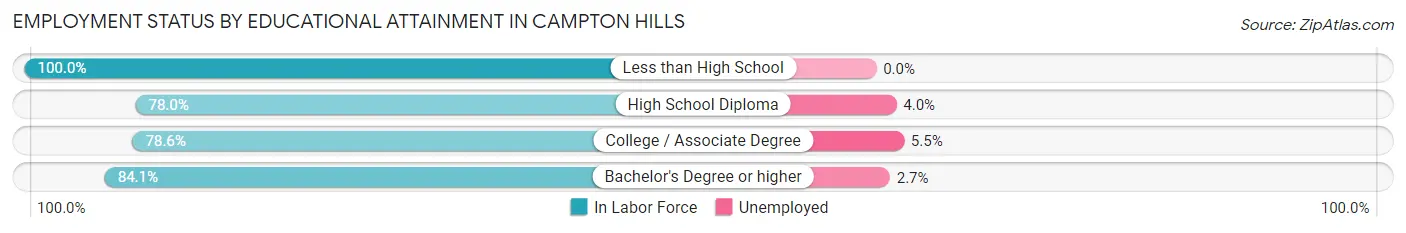
| Educational Attainment | In Labor Force | Unemployed |
| Less than High School | 40 (100.0%) | 0 (0.0%) |
| High School Diploma | 400 (78.0%) | 21 (4.0%) |
| College / Associate Degree | 946 (78.6%) | 66 (5.5%) |
| Bachelor's Degree or higher | 2,880 (84.1%) | 92 (2.7%) |
| Total | 4,265 (82.3%) | 176 (3.4%) |
Employment Occupations by Sex in Campton Hills
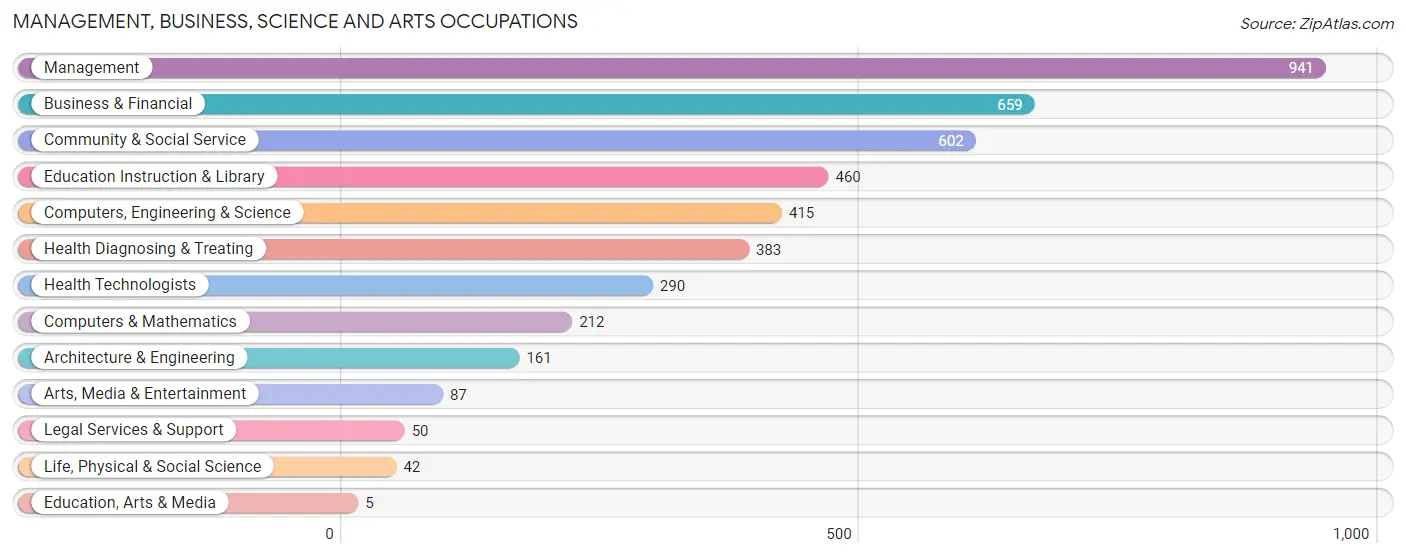
Management, Business, Science and Arts Occupations
The most common Management, Business, Science and Arts occupations in Campton Hills are Management (941 | 17.3%), Business & Financial (659 | 12.1%), Community & Social Service (602 | 11.0%), Education Instruction & Library (460 | 8.4%), and Computers, Engineering & Science (415 | 7.6%).
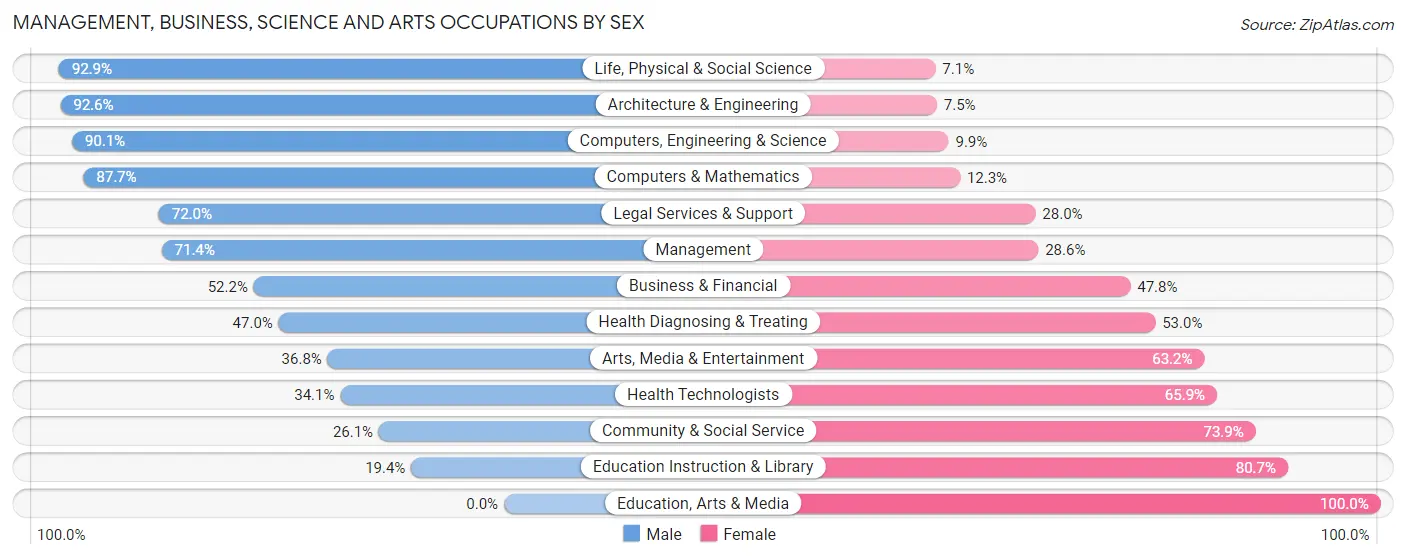
Management, Business, Science and Arts Occupations by Sex
Within the Management, Business, Science and Arts occupations in Campton Hills, the most male-oriented occupations are Life, Physical & Social Science (92.9%), Architecture & Engineering (92.5%), and Computers, Engineering & Science (90.1%), while the most female-oriented occupations are Education, Arts & Media (100.0%), Education Instruction & Library (80.6%), and Community & Social Service (73.9%).
| Occupation | Male | Female |
| Management | 672 (71.4%) | 269 (28.6%) |
| Business & Financial | 344 (52.2%) | 315 (47.8%) |
| Computers, Engineering & Science | 374 (90.1%) | 41 (9.9%) |
| Computers & Mathematics | 186 (87.7%) | 26 (12.3%) |
| Architecture & Engineering | 149 (92.5%) | 12 (7.4%) |
| Life, Physical & Social Science | 39 (92.9%) | 3 (7.1%) |
| Community & Social Service | 157 (26.1%) | 445 (73.9%) |
| Education, Arts & Media | 0 (0.0%) | 5 (100.0%) |
| Legal Services & Support | 36 (72.0%) | 14 (28.0%) |
| Education Instruction & Library | 89 (19.4%) | 371 (80.6%) |
| Arts, Media & Entertainment | 32 (36.8%) | 55 (63.2%) |
| Health Diagnosing & Treating | 180 (47.0%) | 203 (53.0%) |
| Health Technologists | 99 (34.1%) | 191 (65.9%) |
| Total (Category) | 1,727 (57.6%) | 1,273 (42.4%) |
| Total (Overall) | 3,088 (56.7%) | 2,363 (43.3%) |
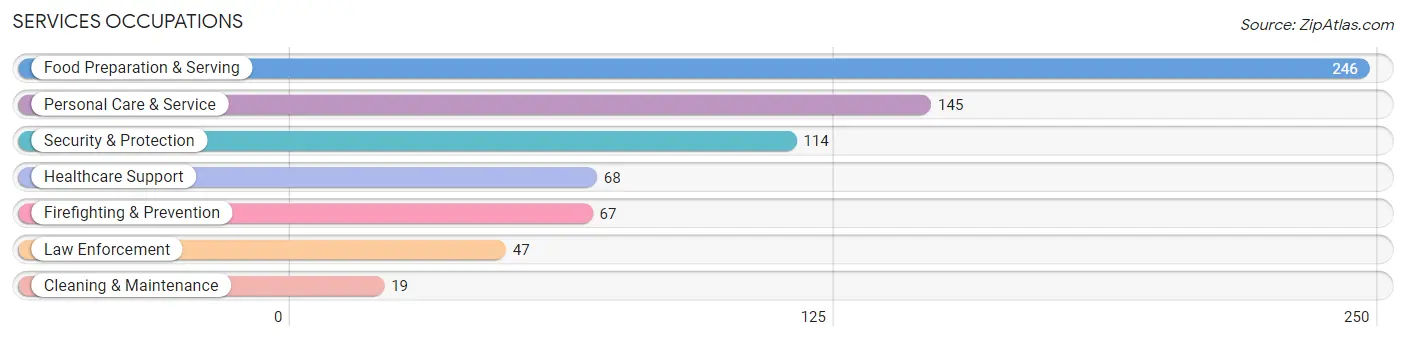
Services Occupations
The most common Services occupations in Campton Hills are Food Preparation & Serving (246 | 4.5%), Personal Care & Service (145 | 2.7%), Security & Protection (114 | 2.1%), Healthcare Support (68 | 1.3%), and Firefighting & Prevention (67 | 1.2%).
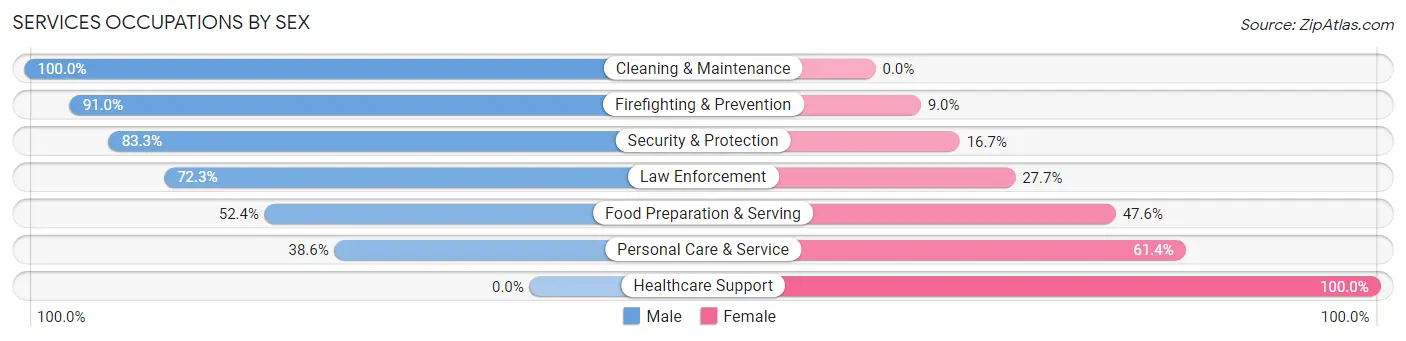
Services Occupations by Sex
Within the Services occupations in Campton Hills, the most male-oriented occupations are Cleaning & Maintenance (100.0%), Firefighting & Prevention (91.0%), and Security & Protection (83.3%), while the most female-oriented occupations are Healthcare Support (100.0%), Personal Care & Service (61.4%), and Food Preparation & Serving (47.6%).
| Occupation | Male | Female |
| Healthcare Support | 0 (0.0%) | 68 (100.0%) |
| Security & Protection | 95 (83.3%) | 19 (16.7%) |
| Firefighting & Prevention | 61 (91.0%) | 6 (9.0%) |
| Law Enforcement | 34 (72.3%) | 13 (27.7%) |
| Food Preparation & Serving | 129 (52.4%) | 117 (47.6%) |
| Cleaning & Maintenance | 19 (100.0%) | 0 (0.0%) |
| Personal Care & Service | 56 (38.6%) | 89 (61.4%) |
| Total (Category) | 299 (50.5%) | 293 (49.5%) |
| Total (Overall) | 3,088 (56.7%) | 2,363 (43.3%) |
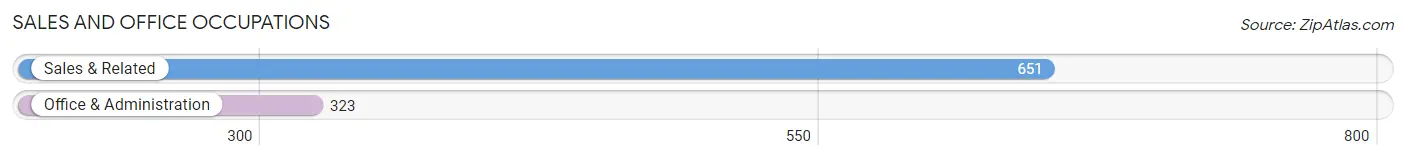
Sales and Office Occupations
The most common Sales and Office occupations in Campton Hills are Sales & Related (651 | 11.9%), and Office & Administration (323 | 5.9%).
Sales and Office Occupations by Sex
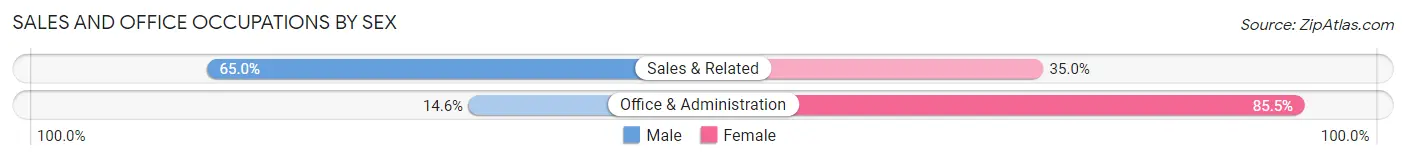
| Occupation | Male | Female |
| Sales & Related | 423 (65.0%) | 228 (35.0%) |
| Office & Administration | 47 (14.5%) | 276 (85.5%) |
| Total (Category) | 470 (48.2%) | 504 (51.7%) |
| Total (Overall) | 3,088 (56.7%) | 2,363 (43.3%) |
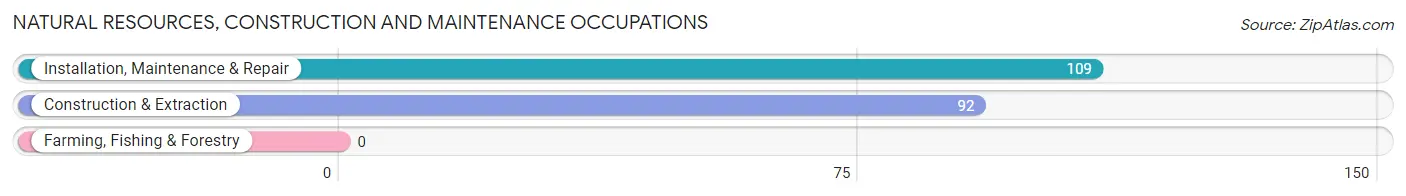
Natural Resources, Construction and Maintenance Occupations
The most common Natural Resources, Construction and Maintenance occupations in Campton Hills are Installation, Maintenance & Repair (109 | 2.0%), and Construction & Extraction (92 | 1.7%).
Natural Resources, Construction and Maintenance Occupations by Sex
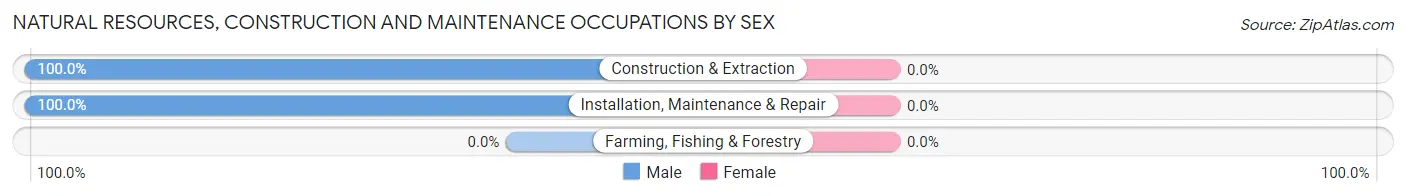
| Occupation | Male | Female |
| Farming, Fishing & Forestry | 0 (0.0%) | 0 (0.0%) |
| Construction & Extraction | 92 (100.0%) | 0 (0.0%) |
| Installation, Maintenance & Repair | 109 (100.0%) | 0 (0.0%) |
| Total (Category) | 201 (100.0%) | 0 (0.0%) |
| Total (Overall) | 3,088 (56.7%) | 2,363 (43.3%) |
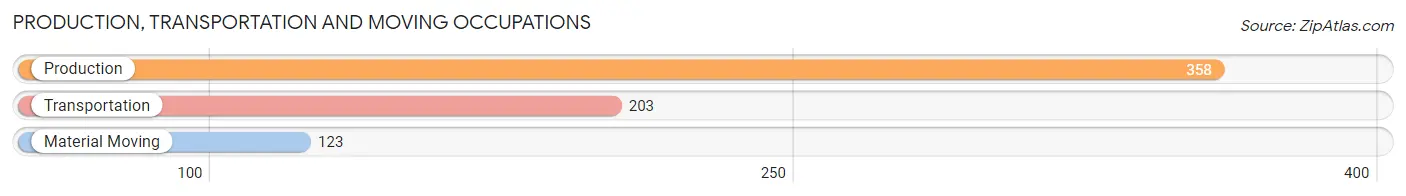
Production, Transportation and Moving Occupations
The most common Production, Transportation and Moving occupations in Campton Hills are Production (358 | 6.6%), Transportation (203 | 3.7%), and Material Moving (123 | 2.3%).
Production, Transportation and Moving Occupations by Sex
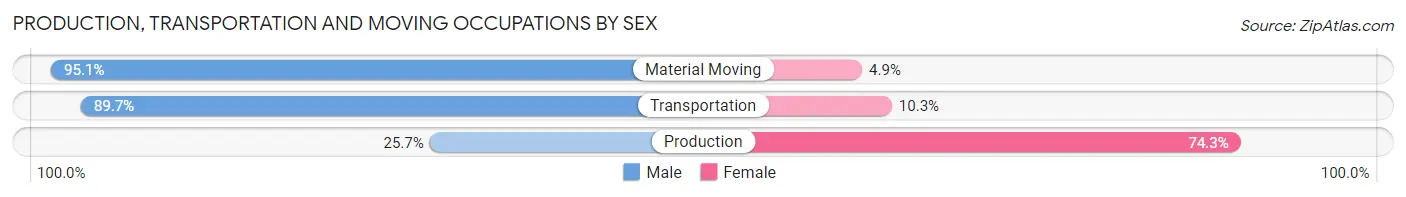
| Occupation | Male | Female |
| Production | 92 (25.7%) | 266 (74.3%) |
| Transportation | 182 (89.7%) | 21 (10.3%) |
| Material Moving | 117 (95.1%) | 6 (4.9%) |
| Total (Category) | 391 (57.2%) | 293 (42.8%) |
| Total (Overall) | 3,088 (56.7%) | 2,363 (43.3%) |
Employment Industries by Sex in Campton Hills
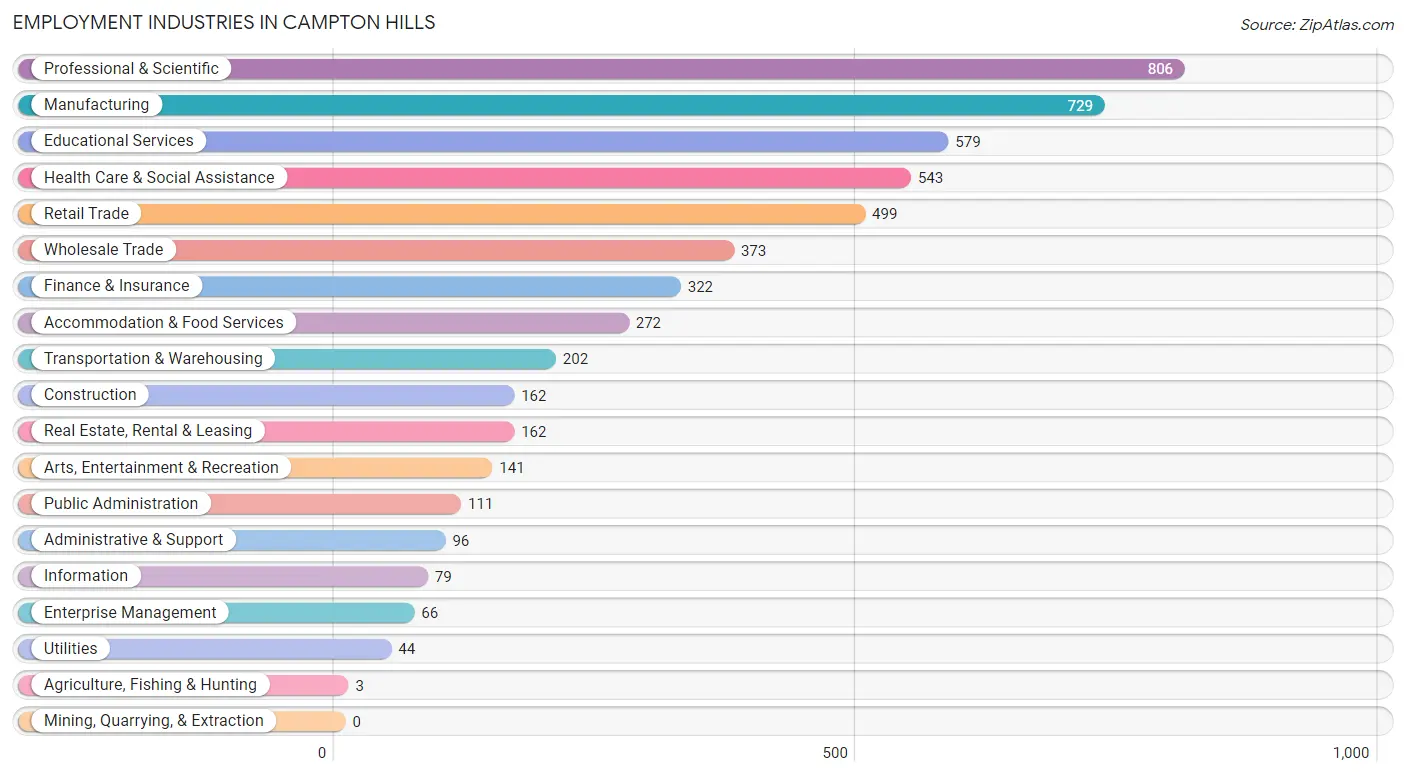
Employment Industries in Campton Hills
The major employment industries in Campton Hills include Professional & Scientific (806 | 14.8%), Manufacturing (729 | 13.4%), Educational Services (579 | 10.6%), Health Care & Social Assistance (543 | 10.0%), and Retail Trade (499 | 9.1%).
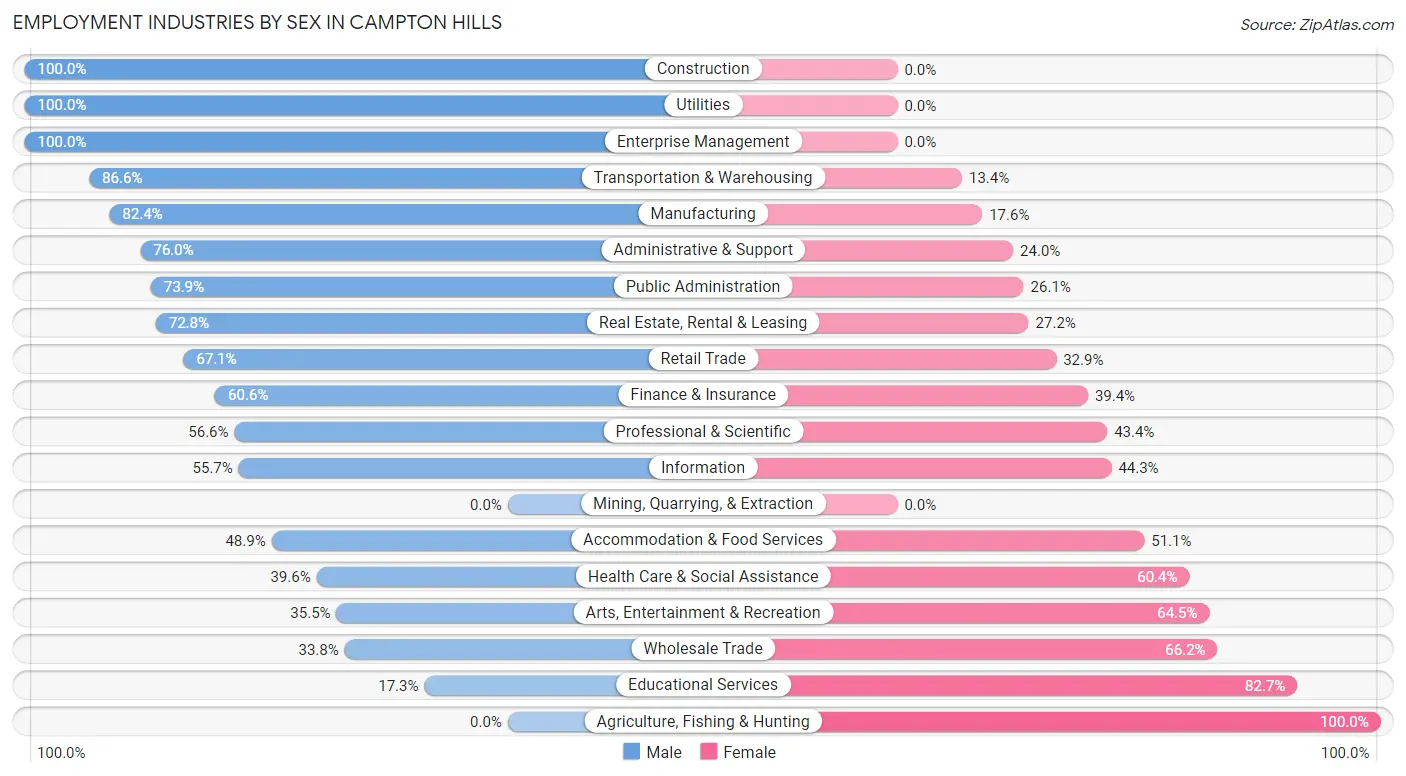
Employment Industries by Sex in Campton Hills
The Campton Hills industries that see more men than women are Construction (100.0%), Utilities (100.0%), and Enterprise Management (100.0%), whereas the industries that tend to have a higher number of women are Agriculture, Fishing & Hunting (100.0%), Educational Services (82.7%), and Wholesale Trade (66.2%).
| Industry | Male | Female |
| Agriculture, Fishing & Hunting | 0 (0.0%) | 3 (100.0%) |
| Mining, Quarrying, & Extraction | 0 (0.0%) | 0 (0.0%) |
| Construction | 162 (100.0%) | 0 (0.0%) |
| Manufacturing | 601 (82.4%) | 128 (17.6%) |
| Wholesale Trade | 126 (33.8%) | 247 (66.2%) |
| Retail Trade | 335 (67.1%) | 164 (32.9%) |
| Transportation & Warehousing | 175 (86.6%) | 27 (13.4%) |
| Utilities | 44 (100.0%) | 0 (0.0%) |
| Information | 44 (55.7%) | 35 (44.3%) |
| Finance & Insurance | 195 (60.6%) | 127 (39.4%) |
| Real Estate, Rental & Leasing | 118 (72.8%) | 44 (27.2%) |
| Professional & Scientific | 456 (56.6%) | 350 (43.4%) |
| Enterprise Management | 66 (100.0%) | 0 (0.0%) |
| Administrative & Support | 73 (76.0%) | 23 (24.0%) |
| Educational Services | 100 (17.3%) | 479 (82.7%) |
| Health Care & Social Assistance | 215 (39.6%) | 328 (60.4%) |
| Arts, Entertainment & Recreation | 50 (35.5%) | 91 (64.5%) |
| Accommodation & Food Services | 133 (48.9%) | 139 (51.1%) |
| Public Administration | 82 (73.9%) | 29 (26.1%) |
| Total | 3,088 (56.7%) | 2,363 (43.3%) |
Education in Campton Hills
School Enrollment in Campton Hills
The most common levels of schooling among the 3,119 students in Campton Hills are high school (996 | 31.9%), elementary school (680 | 21.8%), and middle school (633 | 20.3%).
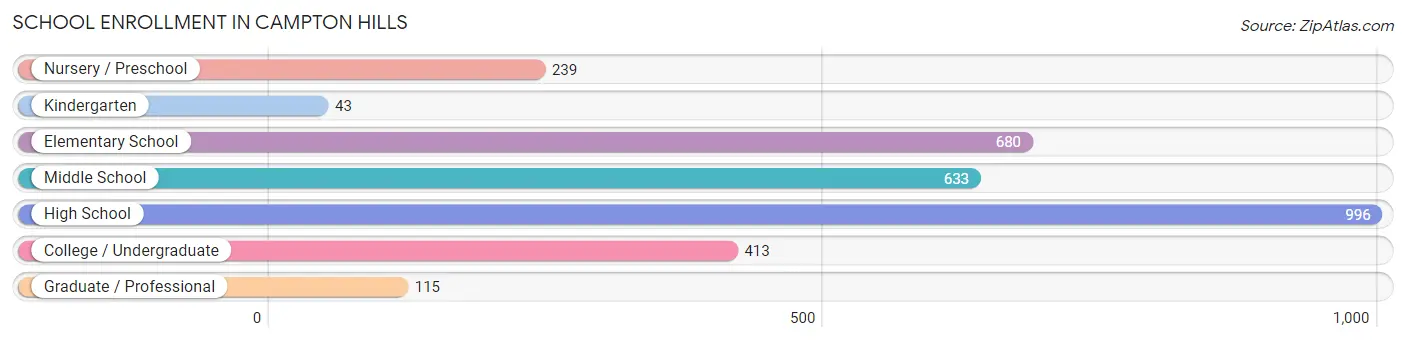
| School Level | # Students | % Students |
| Nursery / Preschool | 239 | 7.7% |
| Kindergarten | 43 | 1.4% |
| Elementary School | 680 | 21.8% |
| Middle School | 633 | 20.3% |
| High School | 996 | 31.9% |
| College / Undergraduate | 413 | 13.2% |
| Graduate / Professional | 115 | 3.7% |
| Total | 3,119 | 100.0% |
School Enrollment by Age by Funding Source in Campton Hills
Out of a total of 3,119 students who are enrolled in schools in Campton Hills, 471 (15.1%) attend a private institution, while the remaining 2,648 (84.9%) are enrolled in public schools. The age group of 25 to 34 year olds has the highest likelihood of being enrolled in private schools, with 40 (50.0% in the age bracket) enrolled. Conversely, the age group of 20 to 24 year olds has the lowest likelihood of being enrolled in a private school, with 248 (100.0% in the age bracket) attending a public institution.
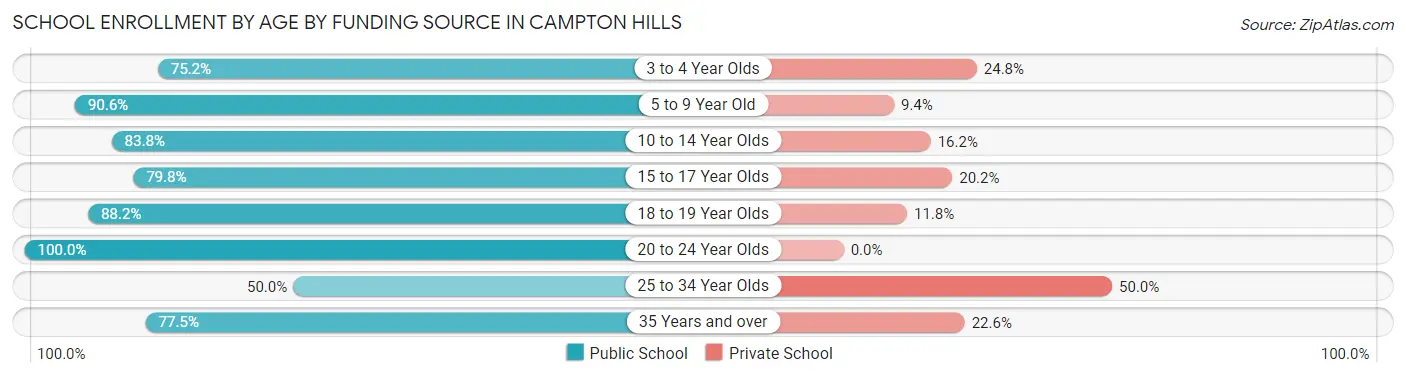
| Age Bracket | Public School | Private School |
| 3 to 4 Year Olds | 97 (75.2%) | 32 (24.8%) |
| 5 to 9 Year Old | 609 (90.6%) | 63 (9.4%) |
| 10 to 14 Year Olds | 780 (83.8%) | 151 (16.2%) |
| 15 to 17 Year Olds | 473 (79.8%) | 120 (20.2%) |
| 18 to 19 Year Olds | 321 (88.2%) | 43 (11.8%) |
| 20 to 24 Year Olds | 248 (100.0%) | 0 (0.0%) |
| 25 to 34 Year Olds | 40 (50.0%) | 40 (50.0%) |
| 35 Years and over | 79 (77.4%) | 23 (22.6%) |
| Total | 2,648 (84.9%) | 471 (15.1%) |
Educational Attainment by Field of Study in Campton Hills
Business (1,342 | 30.1%), education (434 | 9.8%), engineering (400 | 9.0%), arts & humanities (334 | 7.5%), and bio, nature & agricultural (268 | 6.0%) are the most common fields of study among 4,452 individuals in Campton Hills who have obtained a bachelor's degree or higher.
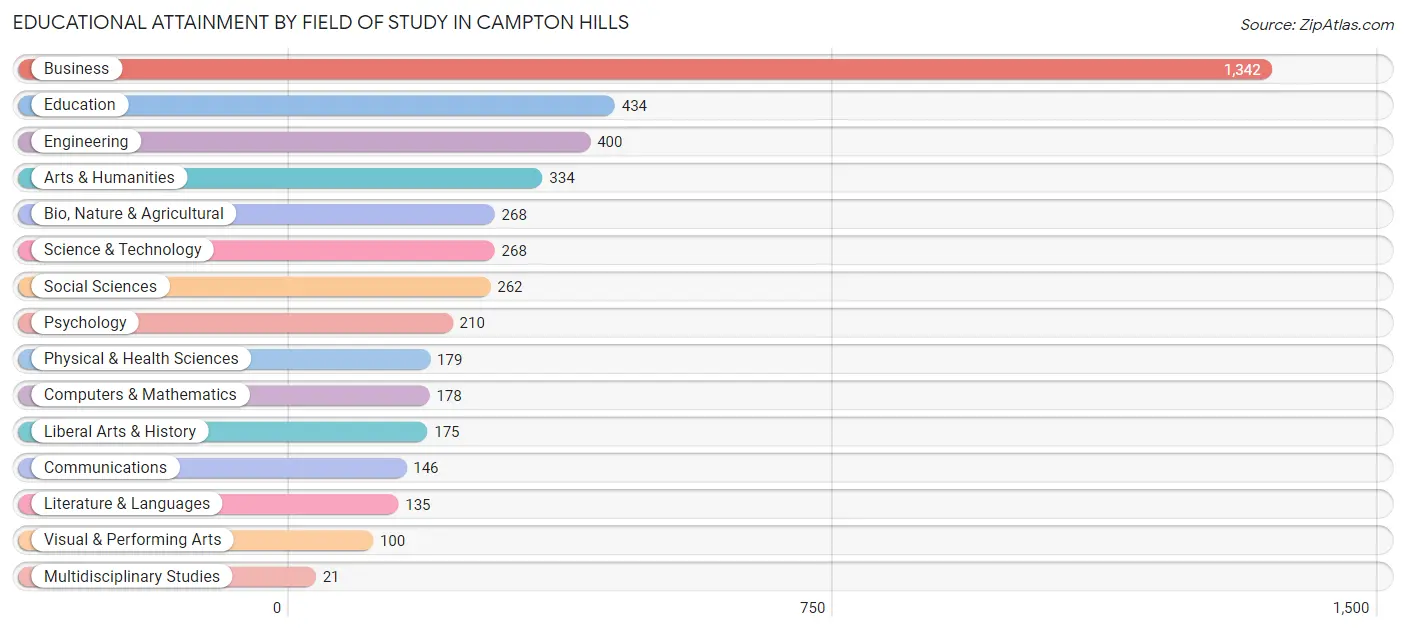
| Field of Study | # Graduates | % Graduates |
| Computers & Mathematics | 178 | 4.0% |
| Bio, Nature & Agricultural | 268 | 6.0% |
| Physical & Health Sciences | 179 | 4.0% |
| Psychology | 210 | 4.7% |
| Social Sciences | 262 | 5.9% |
| Engineering | 400 | 9.0% |
| Multidisciplinary Studies | 21 | 0.5% |
| Science & Technology | 268 | 6.0% |
| Business | 1,342 | 30.1% |
| Education | 434 | 9.8% |
| Literature & Languages | 135 | 3.0% |
| Liberal Arts & History | 175 | 3.9% |
| Visual & Performing Arts | 100 | 2.2% |
| Communications | 146 | 3.3% |
| Arts & Humanities | 334 | 7.5% |
| Total | 4,452 | 100.0% |
Transportation & Commute in Campton Hills
Vehicle Availability by Sex in Campton Hills
The most prevalent vehicle ownership categories in Campton Hills are males with 2 vehicles (1,327, accounting for 43.1%) and females with 2 vehicles (838, making up 64.3%).
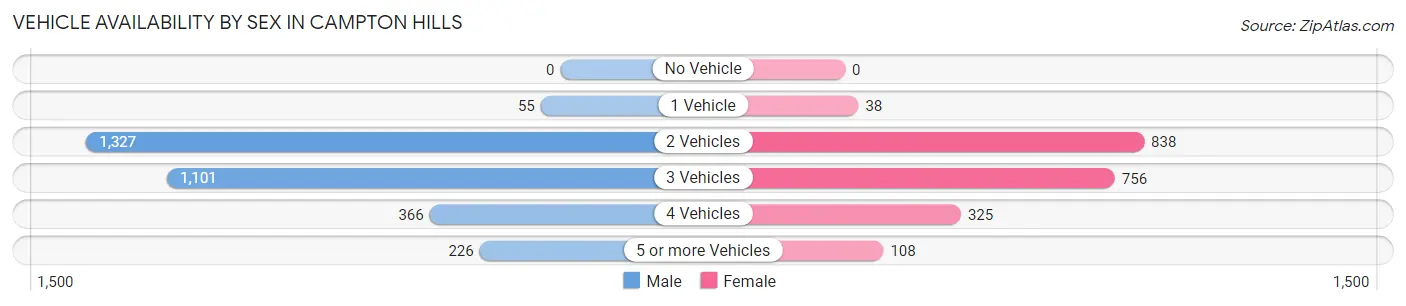
| Vehicles Available | Male | Female |
| No Vehicle | 0 (0.0%) | 0 (0.0%) |
| 1 Vehicle | 55 (1.8%) | 38 (1.8%) |
| 2 Vehicles | 1,327 (43.1%) | 838 (40.6%) |
| 3 Vehicles | 1,101 (35.8%) | 756 (36.6%) |
| 4 Vehicles | 366 (11.9%) | 325 (15.7%) |
| 5 or more Vehicles | 226 (7.3%) | 108 (5.2%) |
| Total | 3,075 (100.0%) | 2,065 (100.0%) |
Commute Time in Campton Hills
The most frequently occuring commute durations in Campton Hills are 45 to 59 minutes (773 commuters, 18.0%), 20 to 24 minutes (555 commuters, 13.0%), and 15 to 19 minutes (514 commuters, 12.0%).
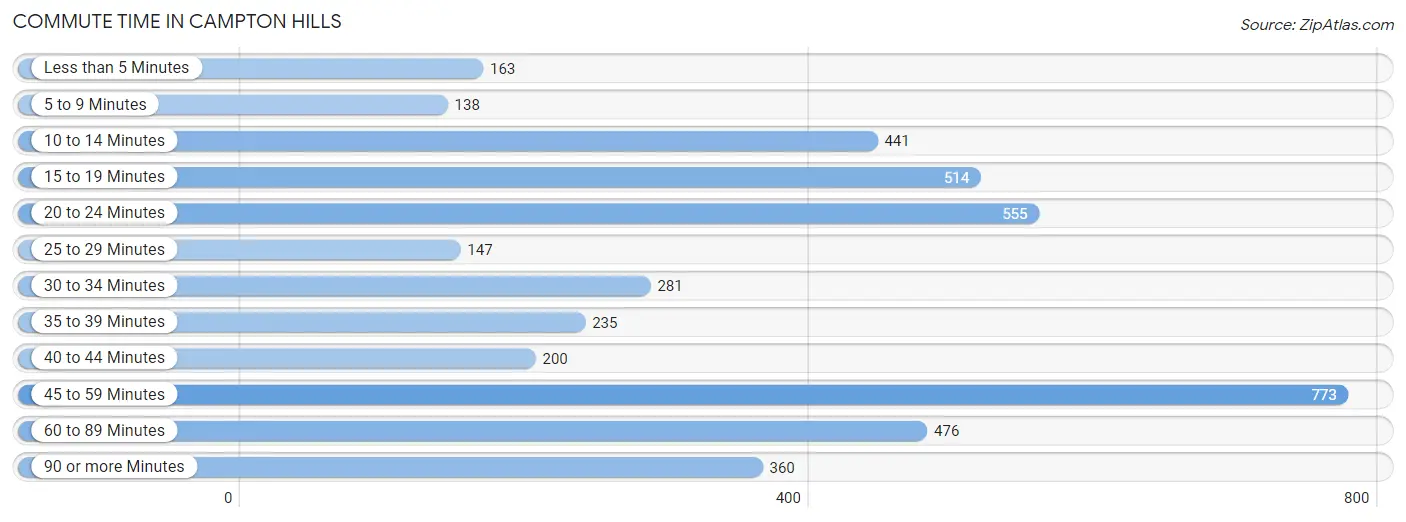
| Commute Time | # Commuters | % Commuters |
| Less than 5 Minutes | 163 | 3.8% |
| 5 to 9 Minutes | 138 | 3.2% |
| 10 to 14 Minutes | 441 | 10.3% |
| 15 to 19 Minutes | 514 | 12.0% |
| 20 to 24 Minutes | 555 | 13.0% |
| 25 to 29 Minutes | 147 | 3.4% |
| 30 to 34 Minutes | 281 | 6.6% |
| 35 to 39 Minutes | 235 | 5.5% |
| 40 to 44 Minutes | 200 | 4.7% |
| 45 to 59 Minutes | 773 | 18.0% |
| 60 to 89 Minutes | 476 | 11.1% |
| 90 or more Minutes | 360 | 8.4% |
Commute Time by Sex in Campton Hills
The most common commute times in Campton Hills are 45 to 59 minutes (550 commuters, 21.1%) for males and 15 to 19 minutes (258 commuters, 15.4%) for females.
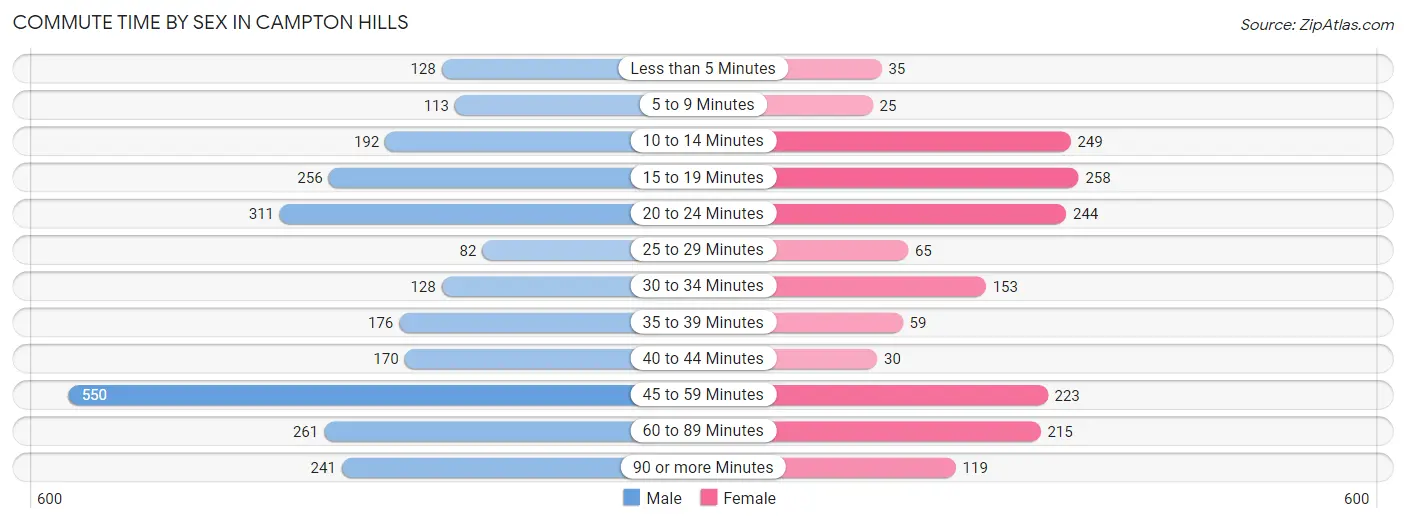
| Commute Time | Male | Female |
| Less than 5 Minutes | 128 (4.9%) | 35 (2.1%) |
| 5 to 9 Minutes | 113 (4.3%) | 25 (1.5%) |
| 10 to 14 Minutes | 192 (7.4%) | 249 (14.9%) |
| 15 to 19 Minutes | 256 (9.8%) | 258 (15.4%) |
| 20 to 24 Minutes | 311 (11.9%) | 244 (14.6%) |
| 25 to 29 Minutes | 82 (3.1%) | 65 (3.9%) |
| 30 to 34 Minutes | 128 (4.9%) | 153 (9.1%) |
| 35 to 39 Minutes | 176 (6.8%) | 59 (3.5%) |
| 40 to 44 Minutes | 170 (6.5%) | 30 (1.8%) |
| 45 to 59 Minutes | 550 (21.1%) | 223 (13.3%) |
| 60 to 89 Minutes | 261 (10.0%) | 215 (12.8%) |
| 90 or more Minutes | 241 (9.2%) | 119 (7.1%) |
Time of Departure to Work by Sex in Campton Hills
The most frequent times of departure to work in Campton Hills are 6:00 AM to 6:29 AM (460, 17.6%) for males and 6:30 AM to 6:59 AM (279, 16.7%) for females.
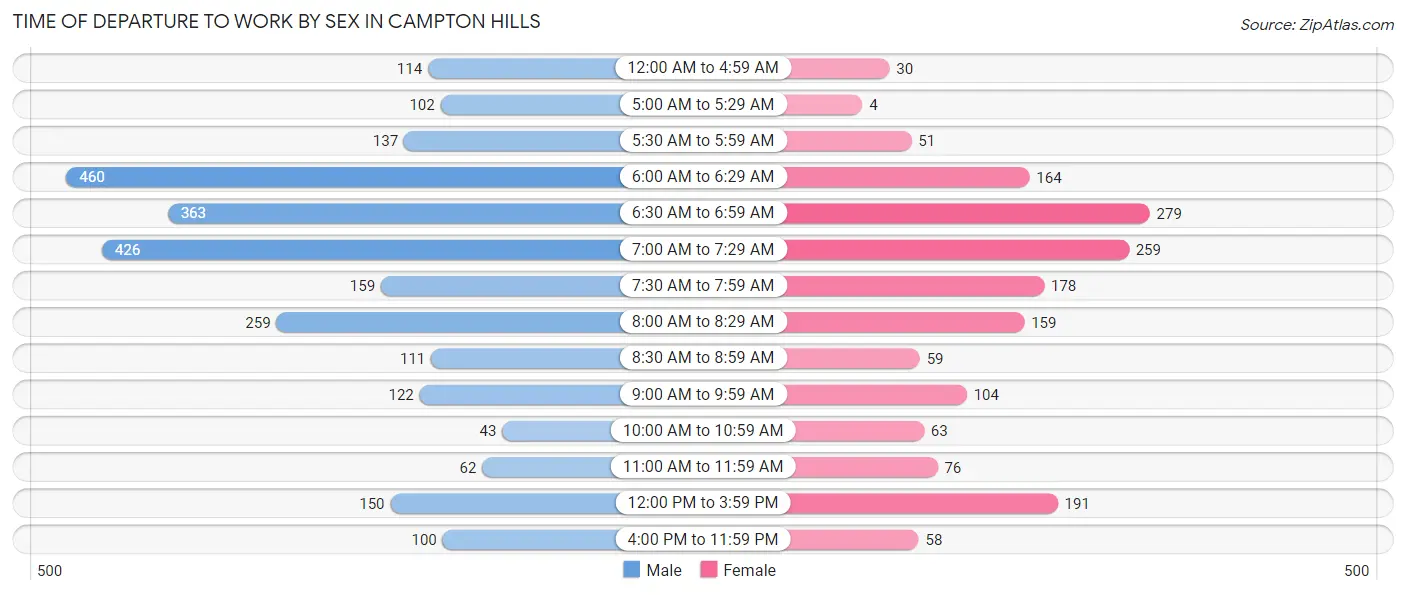
| Time of Departure | Male | Female |
| 12:00 AM to 4:59 AM | 114 (4.4%) | 30 (1.8%) |
| 5:00 AM to 5:29 AM | 102 (3.9%) | 4 (0.2%) |
| 5:30 AM to 5:59 AM | 137 (5.2%) | 51 (3.0%) |
| 6:00 AM to 6:29 AM | 460 (17.6%) | 164 (9.8%) |
| 6:30 AM to 6:59 AM | 363 (13.9%) | 279 (16.7%) |
| 7:00 AM to 7:29 AM | 426 (16.3%) | 259 (15.5%) |
| 7:30 AM to 7:59 AM | 159 (6.1%) | 178 (10.6%) |
| 8:00 AM to 8:29 AM | 259 (9.9%) | 159 (9.5%) |
| 8:30 AM to 8:59 AM | 111 (4.3%) | 59 (3.5%) |
| 9:00 AM to 9:59 AM | 122 (4.7%) | 104 (6.2%) |
| 10:00 AM to 10:59 AM | 43 (1.7%) | 63 (3.8%) |
| 11:00 AM to 11:59 AM | 62 (2.4%) | 76 (4.5%) |
| 12:00 PM to 3:59 PM | 150 (5.8%) | 191 (11.4%) |
| 4:00 PM to 11:59 PM | 100 (3.8%) | 58 (3.5%) |
| Total | 2,608 (100.0%) | 1,675 (100.0%) |
Housing Occupancy in Campton Hills
Occupancy by Ownership in Campton Hills
Of the total 3,436 dwellings in Campton Hills, owner-occupied units account for 3,370 (98.1%), while renter-occupied units make up 66 (1.9%).
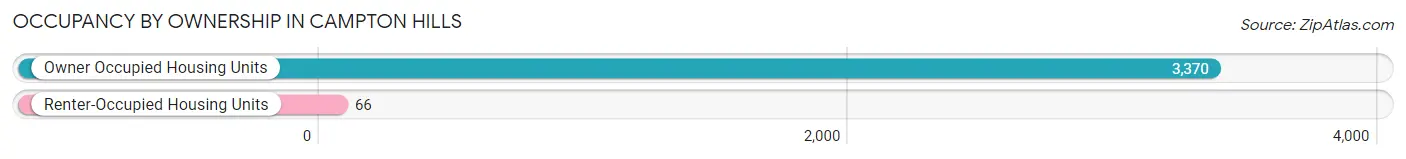
| Occupancy | # Housing Units | % Housing Units |
| Owner Occupied Housing Units | 3,370 | 98.1% |
| Renter-Occupied Housing Units | 66 | 1.9% |
| Total Occupied Housing Units | 3,436 | 100.0% |
Occupancy by Household Size in Campton Hills
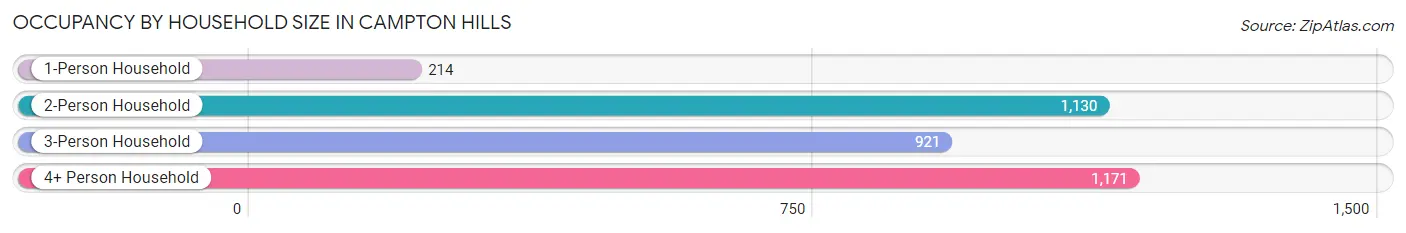
| Household Size | # Housing Units | % Housing Units |
| 1-Person Household | 214 | 6.2% |
| 2-Person Household | 1,130 | 32.9% |
| 3-Person Household | 921 | 26.8% |
| 4+ Person Household | 1,171 | 34.1% |
| Total Housing Units | 3,436 | 100.0% |
Occupancy by Ownership by Household Size in Campton Hills
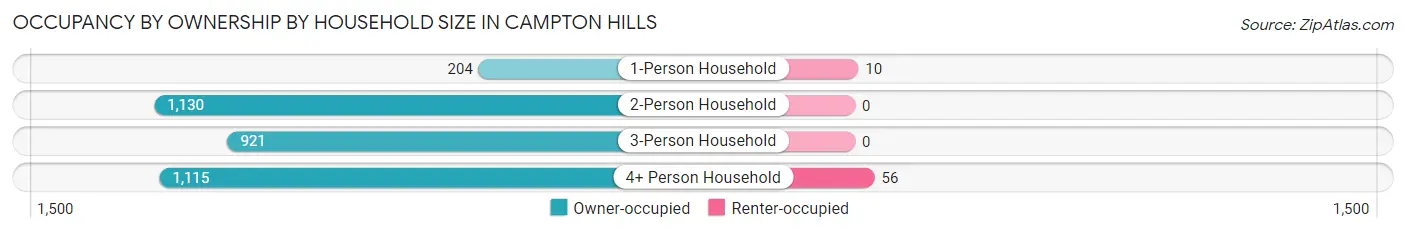
| Household Size | Owner-occupied | Renter-occupied |
| 1-Person Household | 204 (95.3%) | 10 (4.7%) |
| 2-Person Household | 1,130 (100.0%) | 0 (0.0%) |
| 3-Person Household | 921 (100.0%) | 0 (0.0%) |
| 4+ Person Household | 1,115 (95.2%) | 56 (4.8%) |
| Total Housing Units | 3,370 (98.1%) | 66 (1.9%) |
Occupancy by Educational Attainment in Campton Hills
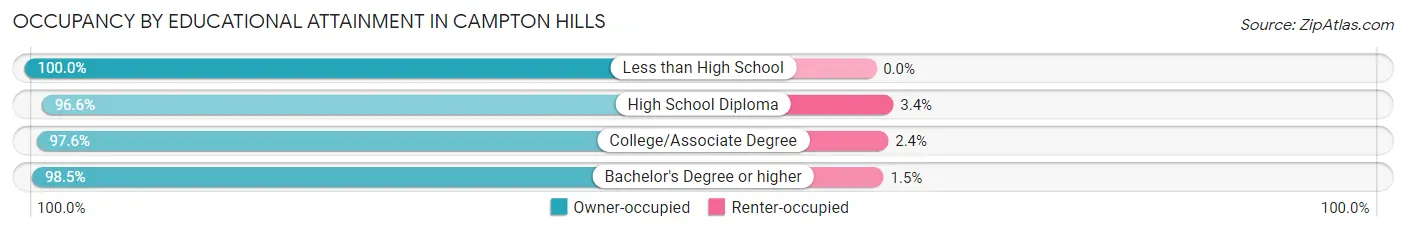
| Household Size | Owner-occupied | Renter-occupied |
| Less than High School | 23 (100.0%) | 0 (0.0%) |
| High School Diploma | 284 (96.6%) | 10 (3.4%) |
| College/Associate Degree | 1,058 (97.6%) | 26 (2.4%) |
| Bachelor's Degree or higher | 2,005 (98.5%) | 30 (1.5%) |
Occupancy by Age of Householder in Campton Hills
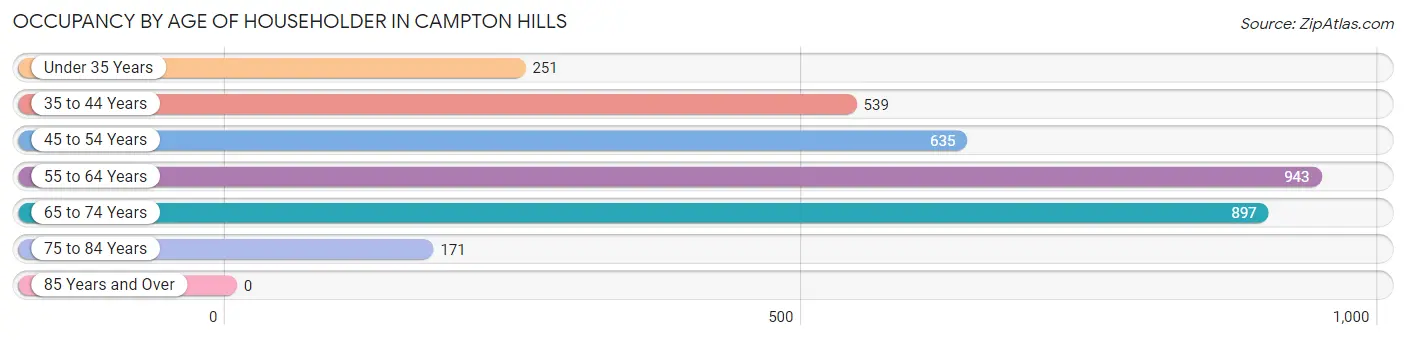
| Age Bracket | # Households | % Households |
| Under 35 Years | 251 | 7.3% |
| 35 to 44 Years | 539 | 15.7% |
| 45 to 54 Years | 635 | 18.5% |
| 55 to 64 Years | 943 | 27.4% |
| 65 to 74 Years | 897 | 26.1% |
| 75 to 84 Years | 171 | 5.0% |
| 85 Years and Over | 0 | 0.0% |
| Total | 3,436 | 100.0% |
Housing Finances in Campton Hills
Median Income by Occupancy in Campton Hills
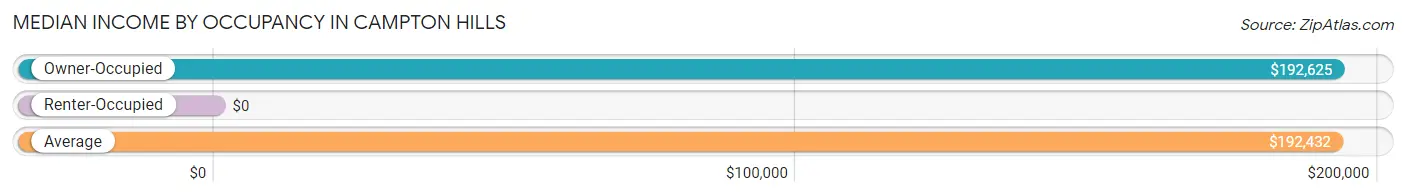
| Occupancy Type | # Households | Median Income |
| Owner-Occupied | 3,370 (98.1%) | $192,625 |
| Renter-Occupied | 66 (1.9%) | $0 |
| Average | 3,436 (100.0%) | $192,432 |
Occupancy by Householder Income Bracket in Campton Hills
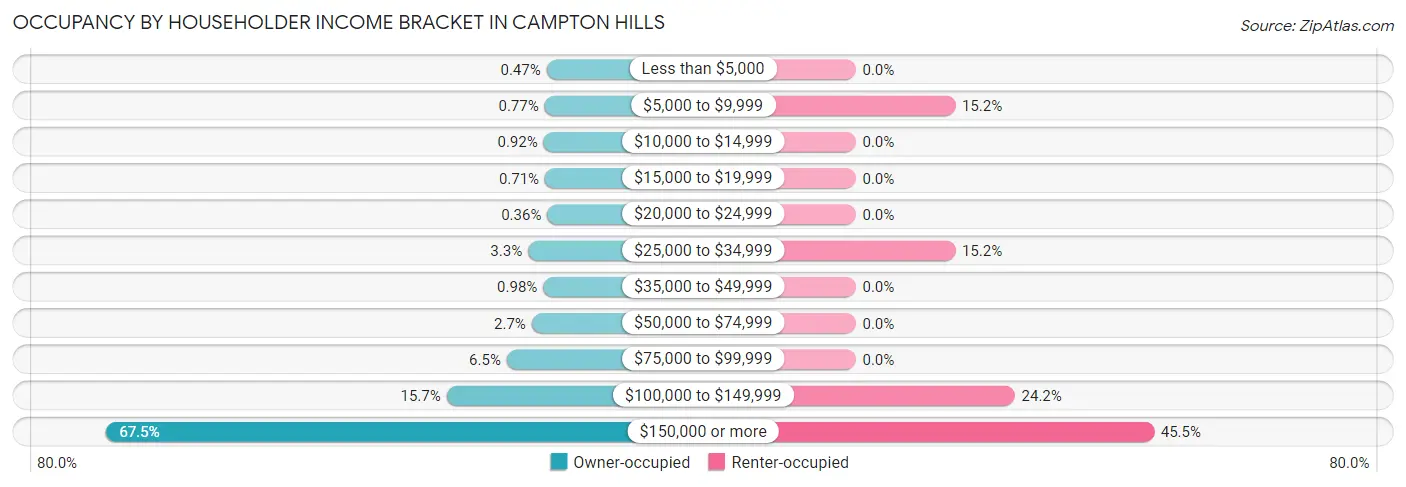
| Income Bracket | Owner-occupied | Renter-occupied |
| Less than $5,000 | 16 (0.5%) | 0 (0.0%) |
| $5,000 to $9,999 | 26 (0.8%) | 10 (15.1%) |
| $10,000 to $14,999 | 31 (0.9%) | 0 (0.0%) |
| $15,000 to $19,999 | 24 (0.7%) | 0 (0.0%) |
| $20,000 to $24,999 | 12 (0.4%) | 0 (0.0%) |
| $25,000 to $34,999 | 111 (3.3%) | 10 (15.1%) |
| $35,000 to $49,999 | 33 (1.0%) | 0 (0.0%) |
| $50,000 to $74,999 | 92 (2.7%) | 0 (0.0%) |
| $75,000 to $99,999 | 220 (6.5%) | 0 (0.0%) |
| $100,000 to $149,999 | 529 (15.7%) | 16 (24.2%) |
| $150,000 or more | 2,276 (67.5%) | 30 (45.5%) |
| Total | 3,370 (100.0%) | 66 (100.0%) |
Monthly Housing Cost Tiers in Campton Hills
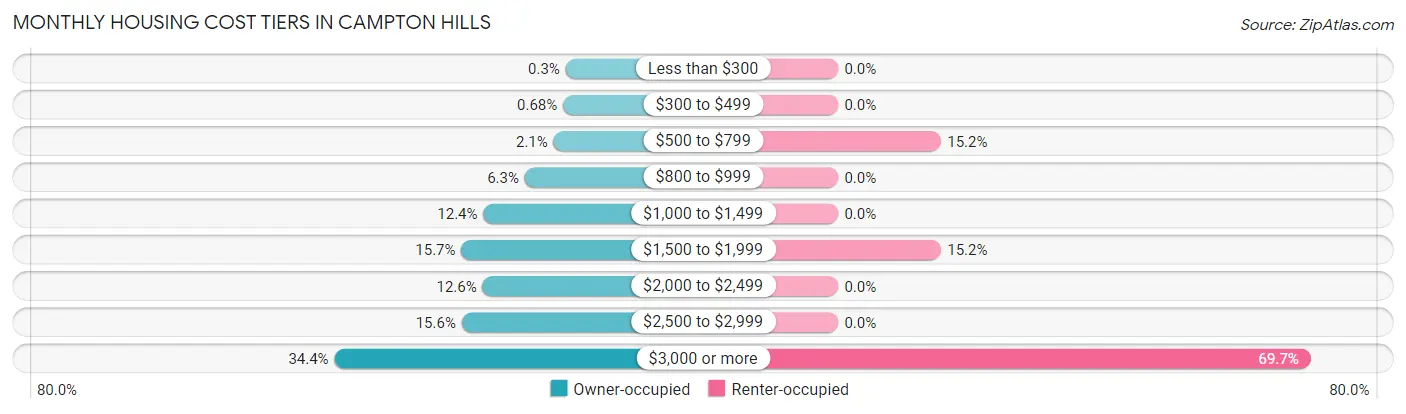
| Monthly Cost | Owner-occupied | Renter-occupied |
| Less than $300 | 10 (0.3%) | 0 (0.0%) |
| $300 to $499 | 23 (0.7%) | 0 (0.0%) |
| $500 to $799 | 70 (2.1%) | 10 (15.1%) |
| $800 to $999 | 213 (6.3%) | 0 (0.0%) |
| $1,000 to $1,499 | 419 (12.4%) | 0 (0.0%) |
| $1,500 to $1,999 | 528 (15.7%) | 10 (15.1%) |
| $2,000 to $2,499 | 423 (12.6%) | 0 (0.0%) |
| $2,500 to $2,999 | 526 (15.6%) | 0 (0.0%) |
| $3,000 or more | 1,158 (34.4%) | 46 (69.7%) |
| Total | 3,370 (100.0%) | 66 (100.0%) |
Physical Housing Characteristics in Campton Hills
Housing Structures in Campton Hills
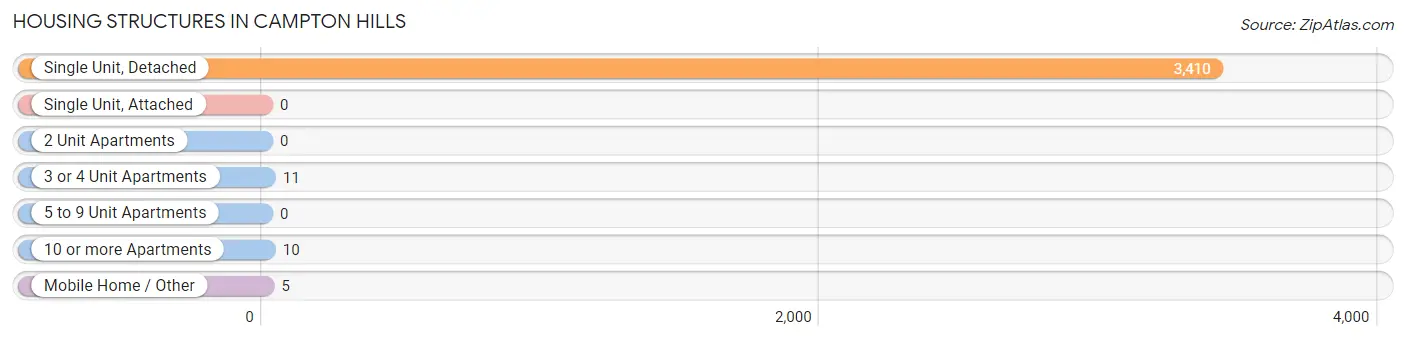
| Structure Type | # Housing Units | % Housing Units |
| Single Unit, Detached | 3,410 | 99.2% |
| Single Unit, Attached | 0 | 0.0% |
| 2 Unit Apartments | 0 | 0.0% |
| 3 or 4 Unit Apartments | 11 | 0.3% |
| 5 to 9 Unit Apartments | 0 | 0.0% |
| 10 or more Apartments | 10 | 0.3% |
| Mobile Home / Other | 5 | 0.2% |
| Total | 3,436 | 100.0% |
Housing Structures by Occupancy in Campton Hills
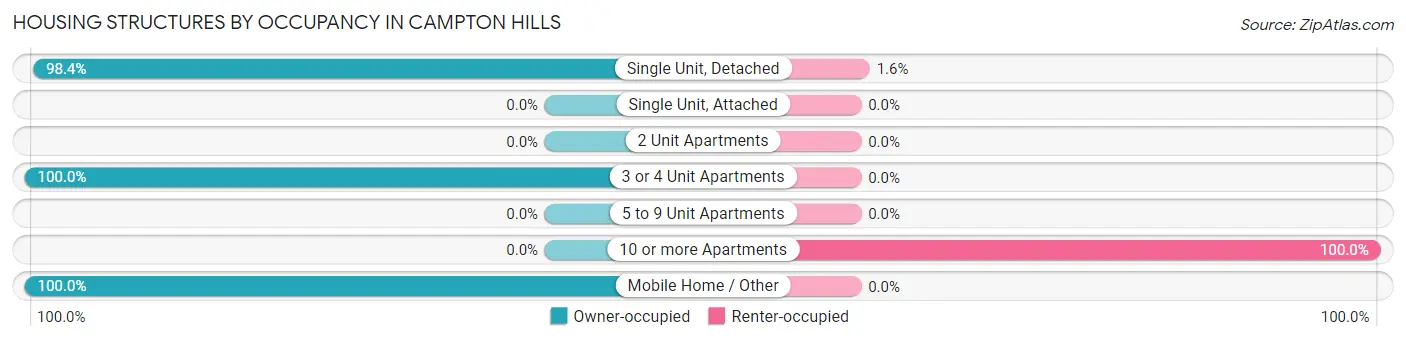
| Structure Type | Owner-occupied | Renter-occupied |
| Single Unit, Detached | 3,354 (98.4%) | 56 (1.6%) |
| Single Unit, Attached | 0 (0.0%) | 0 (0.0%) |
| 2 Unit Apartments | 0 (0.0%) | 0 (0.0%) |
| 3 or 4 Unit Apartments | 11 (100.0%) | 0 (0.0%) |
| 5 to 9 Unit Apartments | 0 (0.0%) | 0 (0.0%) |
| 10 or more Apartments | 0 (0.0%) | 10 (100.0%) |
| Mobile Home / Other | 5 (100.0%) | 0 (0.0%) |
| Total | 3,370 (98.1%) | 66 (1.9%) |
Housing Structures by Number of Rooms in Campton Hills
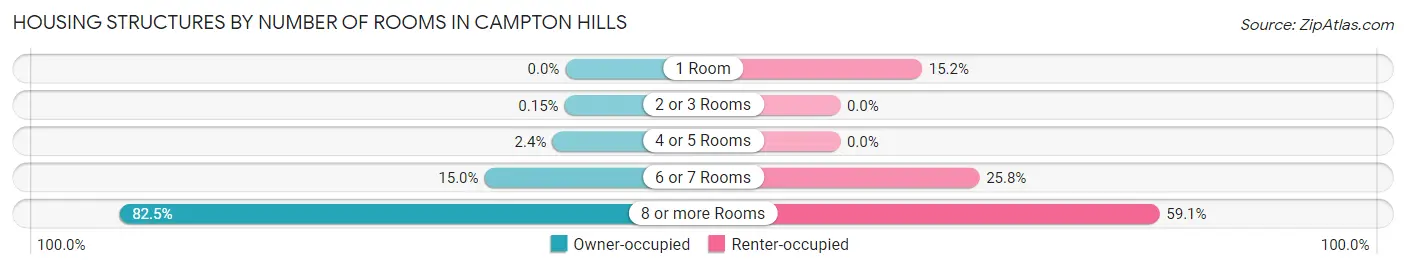
| Number of Rooms | Owner-occupied | Renter-occupied |
| 1 Room | 0 (0.0%) | 10 (15.1%) |
| 2 or 3 Rooms | 5 (0.2%) | 0 (0.0%) |
| 4 or 5 Rooms | 81 (2.4%) | 0 (0.0%) |
| 6 or 7 Rooms | 504 (15.0%) | 17 (25.8%) |
| 8 or more Rooms | 2,780 (82.5%) | 39 (59.1%) |
| Total | 3,370 (100.0%) | 66 (100.0%) |
Housing Structure by Heating Type in Campton Hills
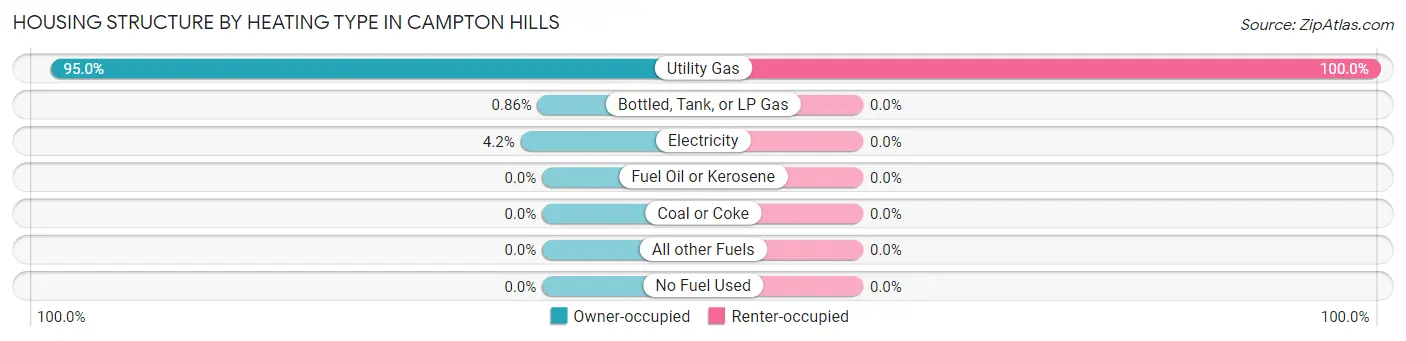
| Heating Type | Owner-occupied | Renter-occupied |
| Utility Gas | 3,200 (95.0%) | 66 (100.0%) |
| Bottled, Tank, or LP Gas | 29 (0.9%) | 0 (0.0%) |
| Electricity | 141 (4.2%) | 0 (0.0%) |
| Fuel Oil or Kerosene | 0 (0.0%) | 0 (0.0%) |
| Coal or Coke | 0 (0.0%) | 0 (0.0%) |
| All other Fuels | 0 (0.0%) | 0 (0.0%) |
| No Fuel Used | 0 (0.0%) | 0 (0.0%) |
| Total | 3,370 (100.0%) | 66 (100.0%) |
Household Vehicle Usage in Campton Hills
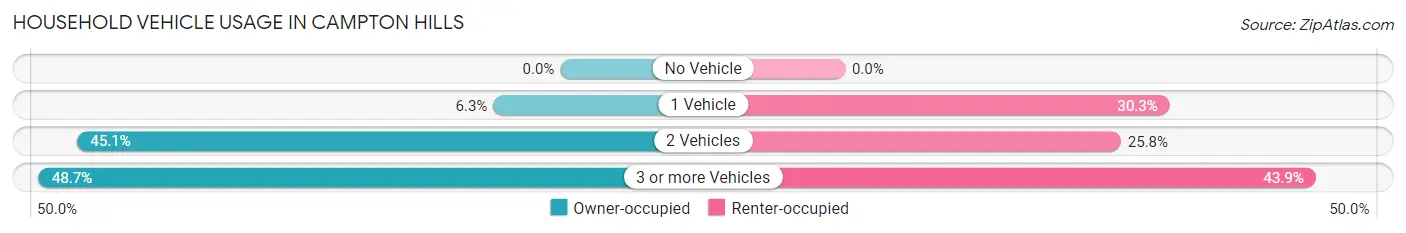
| Vehicles per Household | Owner-occupied | Renter-occupied |
| No Vehicle | 0 (0.0%) | 0 (0.0%) |
| 1 Vehicle | 211 (6.3%) | 20 (30.3%) |
| 2 Vehicles | 1,519 (45.1%) | 17 (25.8%) |
| 3 or more Vehicles | 1,640 (48.7%) | 29 (43.9%) |
| Total | 3,370 (100.0%) | 66 (100.0%) |
Real Estate & Mortgages in Campton Hills
Real Estate and Mortgage Overview in Campton Hills
| Characteristic | Without Mortgage | With Mortgage |
| Housing Units | 978 | 2,392 |
| Median Property Value | $463,000 | $502,200 |
| Median Household Income | $170,714 | $1,667 |
| Monthly Housing Costs | $1,318 | $1,137 |
| Real Estate Taxes | $10,001 | $0 |
Property Value by Mortgage Status in Campton Hills
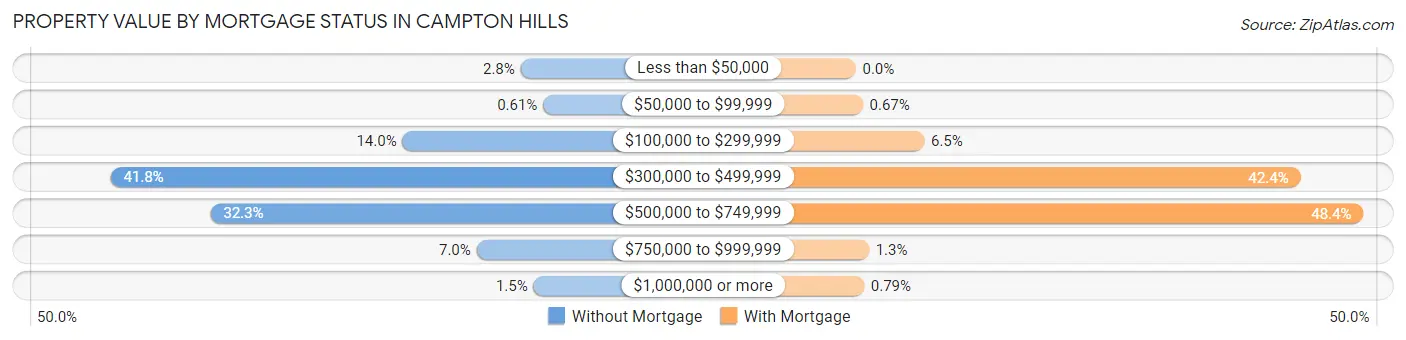
| Property Value | Without Mortgage | With Mortgage |
| Less than $50,000 | 27 (2.8%) | 0 (0.0%) |
| $50,000 to $99,999 | 6 (0.6%) | 16 (0.7%) |
| $100,000 to $299,999 | 137 (14.0%) | 156 (6.5%) |
| $300,000 to $499,999 | 409 (41.8%) | 1,014 (42.4%) |
| $500,000 to $749,999 | 316 (32.3%) | 1,157 (48.4%) |
| $750,000 to $999,999 | 68 (7.0%) | 30 (1.3%) |
| $1,000,000 or more | 15 (1.5%) | 19 (0.8%) |
| Total | 978 (100.0%) | 2,392 (100.0%) |
Household Income by Mortgage Status in Campton Hills
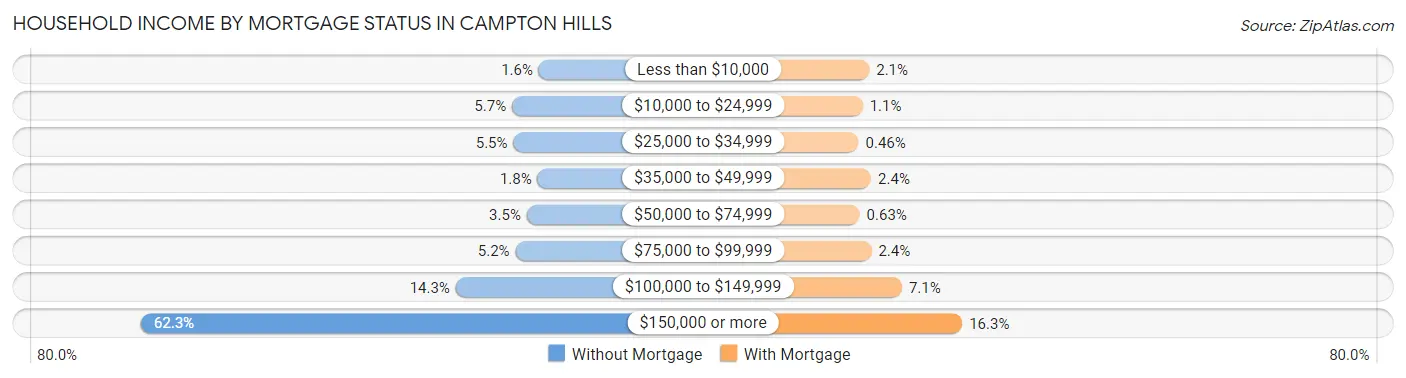
| Household Income | Without Mortgage | With Mortgage |
| Less than $10,000 | 16 (1.6%) | 50 (2.1%) |
| $10,000 to $24,999 | 56 (5.7%) | 26 (1.1%) |
| $25,000 to $34,999 | 54 (5.5%) | 11 (0.5%) |
| $35,000 to $49,999 | 18 (1.8%) | 57 (2.4%) |
| $50,000 to $74,999 | 34 (3.5%) | 15 (0.6%) |
| $75,000 to $99,999 | 51 (5.2%) | 58 (2.4%) |
| $100,000 to $149,999 | 140 (14.3%) | 169 (7.1%) |
| $150,000 or more | 609 (62.3%) | 389 (16.3%) |
| Total | 978 (100.0%) | 2,392 (100.0%) |
Property Value to Household Income Ratio in Campton Hills
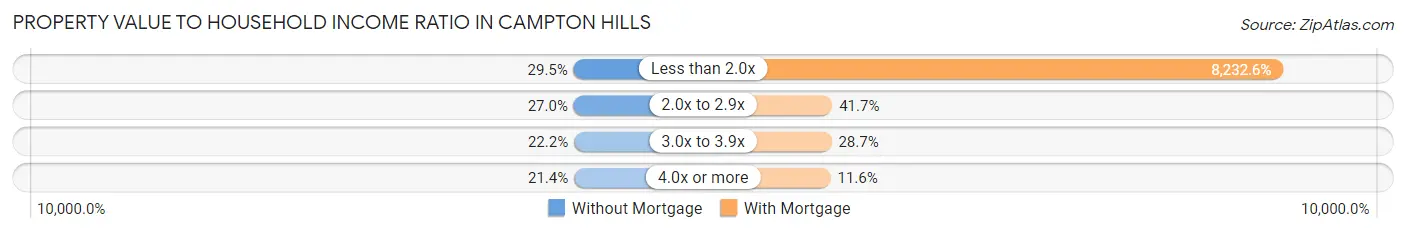
| Value-to-Income Ratio | Without Mortgage | With Mortgage |
| Less than 2.0x | 288 (29.4%) | 196,923 (8,232.6%) |
| 2.0x to 2.9x | 264 (27.0%) | 997 (41.7%) |
| 3.0x to 3.9x | 217 (22.2%) | 687 (28.7%) |
| 4.0x or more | 209 (21.4%) | 277 (11.6%) |
| Total | 978 (100.0%) | 2,392 (100.0%) |
Real Estate Taxes by Mortgage Status in Campton Hills
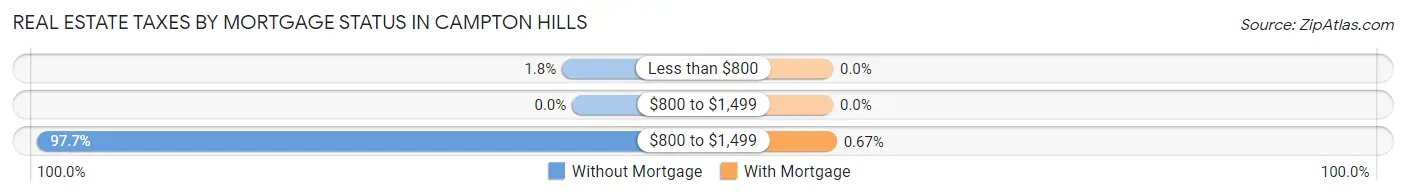
| Property Taxes | Without Mortgage | With Mortgage |
| Less than $800 | 18 (1.8%) | 0 (0.0%) |
| $800 to $1,499 | 0 (0.0%) | 0 (0.0%) |
| $800 to $1,499 | 955 (97.7%) | 16 (0.7%) |
| Total | 978 (100.0%) | 2,392 (100.0%) |
Health & Disability in Campton Hills
Health Insurance Coverage by Age in Campton Hills
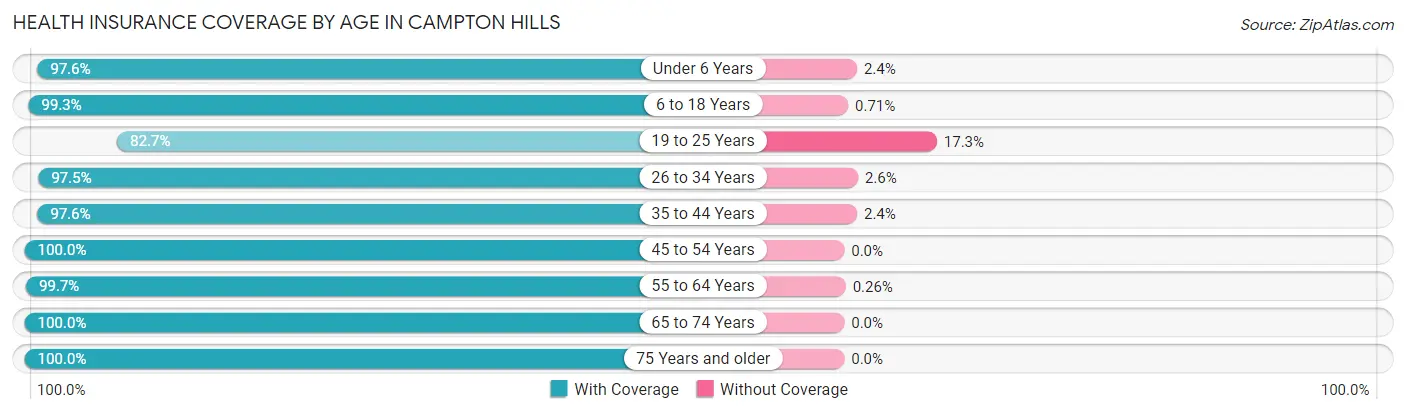
| Age Bracket | With Coverage | Without Coverage |
| Under 6 Years | 659 (97.6%) | 16 (2.4%) |
| 6 to 18 Years | 2,387 (99.3%) | 17 (0.7%) |
| 19 to 25 Years | 561 (82.7%) | 117 (17.3%) |
| 26 to 34 Years | 535 (97.5%) | 14 (2.5%) |
| 35 to 44 Years | 1,232 (97.6%) | 30 (2.4%) |
| 45 to 54 Years | 1,421 (100.0%) | 0 (0.0%) |
| 55 to 64 Years | 1,888 (99.7%) | 5 (0.3%) |
| 65 to 74 Years | 1,364 (100.0%) | 0 (0.0%) |
| 75 Years and older | 310 (100.0%) | 0 (0.0%) |
| Total | 10,357 (98.1%) | 199 (1.9%) |
Health Insurance Coverage by Citizenship Status in Campton Hills
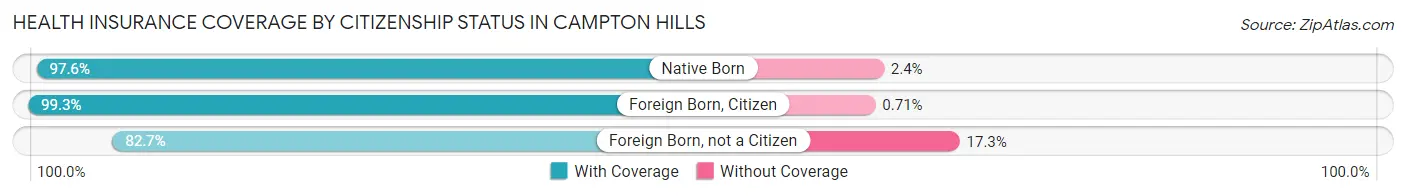
| Citizenship Status | With Coverage | Without Coverage |
| Native Born | 659 (97.6%) | 16 (2.4%) |
| Foreign Born, Citizen | 2,387 (99.3%) | 17 (0.7%) |
| Foreign Born, not a Citizen | 561 (82.7%) | 117 (17.3%) |
Health Insurance Coverage by Household Income in Campton Hills
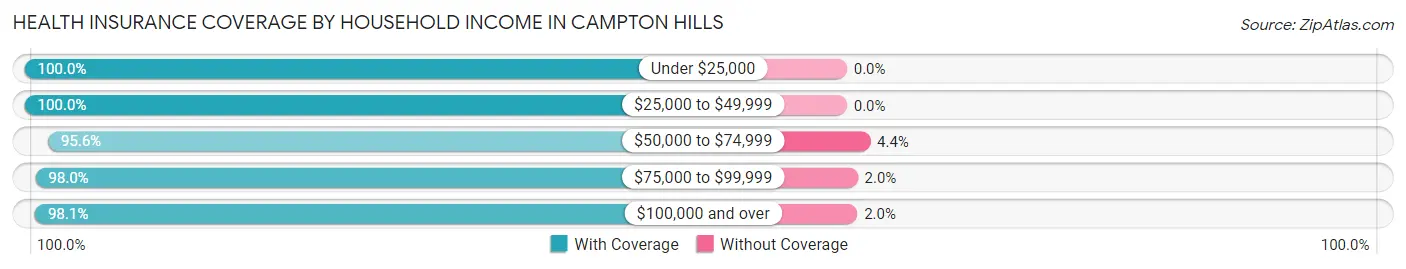
| Household Income | With Coverage | Without Coverage |
| Under $25,000 | 254 (100.0%) | 0 (0.0%) |
| $25,000 to $49,999 | 361 (100.0%) | 0 (0.0%) |
| $50,000 to $74,999 | 175 (95.6%) | 8 (4.4%) |
| $75,000 to $99,999 | 676 (98.0%) | 14 (2.0%) |
| $100,000 and over | 8,891 (98.1%) | 177 (1.9%) |
Public vs Private Health Insurance Coverage by Age in Campton Hills
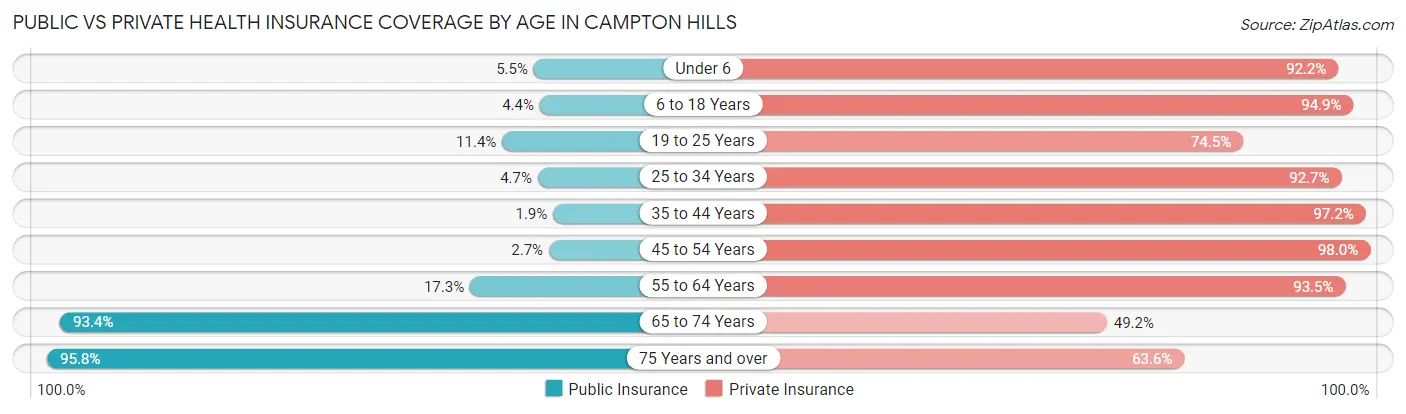
| Age Bracket | Public Insurance | Private Insurance |
| Under 6 | 37 (5.5%) | 622 (92.1%) |
| 6 to 18 Years | 105 (4.4%) | 2,282 (94.9%) |
| 19 to 25 Years | 77 (11.4%) | 505 (74.5%) |
| 25 to 34 Years | 26 (4.7%) | 509 (92.7%) |
| 35 to 44 Years | 24 (1.9%) | 1,227 (97.2%) |
| 45 to 54 Years | 38 (2.7%) | 1,393 (98.0%) |
| 55 to 64 Years | 328 (17.3%) | 1,769 (93.4%) |
| 65 to 74 Years | 1,274 (93.4%) | 671 (49.2%) |
| 75 Years and over | 297 (95.8%) | 197 (63.5%) |
| Total | 2,206 (20.9%) | 9,175 (86.9%) |
Disability Status by Sex by Age in Campton Hills
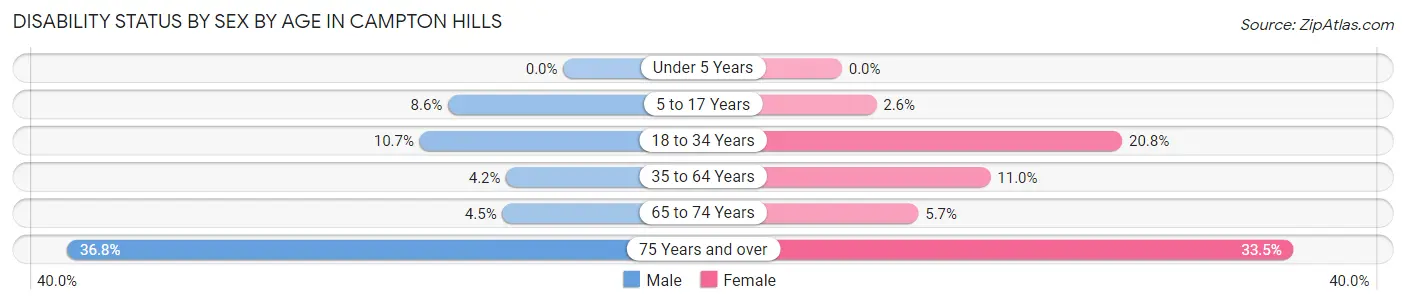
| Age Bracket | Male | Female |
| Under 5 Years | 0 (0.0%) | 0 (0.0%) |
| 5 to 17 Years | 108 (8.6%) | 25 (2.6%) |
| 18 to 34 Years | 86 (10.7%) | 155 (20.8%) |
| 35 to 64 Years | 100 (4.2%) | 244 (11.0%) |
| 65 to 74 Years | 29 (4.5%) | 41 (5.7%) |
| 75 Years and over | 56 (36.8%) | 53 (33.5%) |
Disability Class by Sex by Age in Campton Hills
Disability Class: Hearing Difficulty
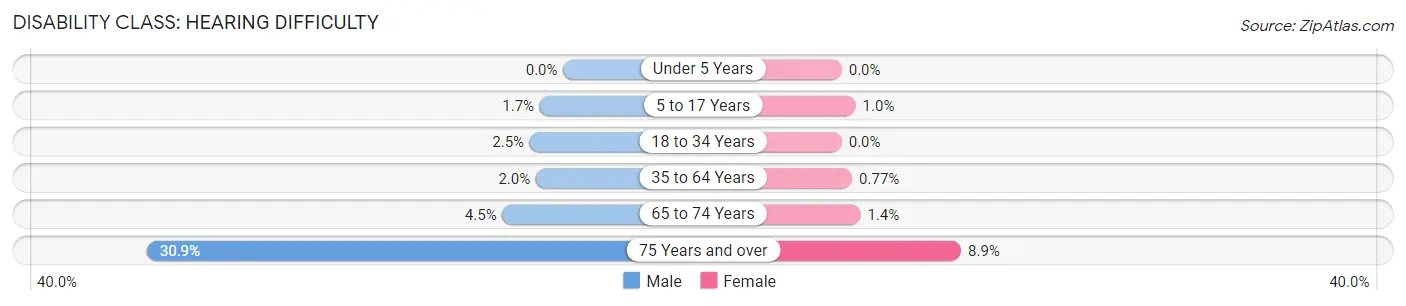
| Age Bracket | Male | Female |
| Under 5 Years | 0 (0.0%) | 0 (0.0%) |
| 5 to 17 Years | 22 (1.7%) | 10 (1.0%) |
| 18 to 34 Years | 20 (2.5%) | 0 (0.0%) |
| 35 to 64 Years | 48 (2.0%) | 17 (0.8%) |
| 65 to 74 Years | 29 (4.5%) | 10 (1.4%) |
| 75 Years and over | 47 (30.9%) | 14 (8.9%) |
Disability Class: Vision Difficulty
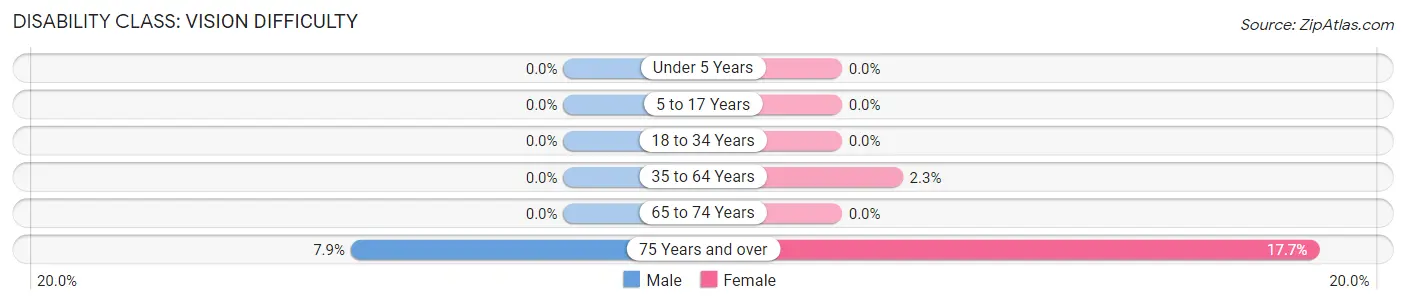
| Age Bracket | Male | Female |
| Under 5 Years | 0 (0.0%) | 0 (0.0%) |
| 5 to 17 Years | 0 (0.0%) | 0 (0.0%) |
| 18 to 34 Years | 0 (0.0%) | 0 (0.0%) |
| 35 to 64 Years | 0 (0.0%) | 50 (2.3%) |
| 65 to 74 Years | 0 (0.0%) | 0 (0.0%) |
| 75 Years and over | 12 (7.9%) | 28 (17.7%) |
Disability Class: Cognitive Difficulty
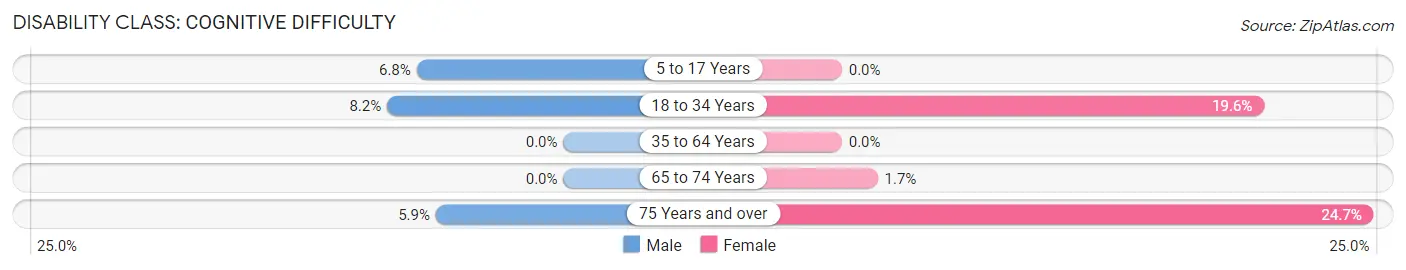
| Age Bracket | Male | Female |
| 5 to 17 Years | 86 (6.8%) | 0 (0.0%) |
| 18 to 34 Years | 66 (8.2%) | 146 (19.6%) |
| 35 to 64 Years | 0 (0.0%) | 0 (0.0%) |
| 65 to 74 Years | 0 (0.0%) | 12 (1.7%) |
| 75 Years and over | 9 (5.9%) | 39 (24.7%) |
Disability Class: Ambulatory Difficulty
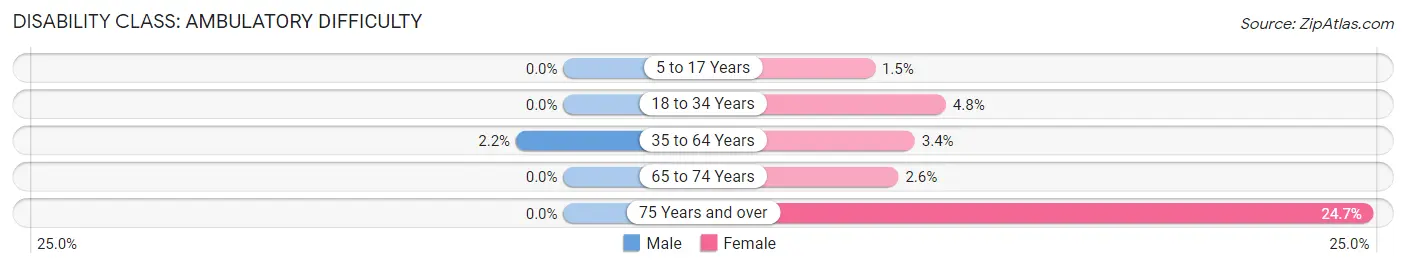
| Age Bracket | Male | Female |
| 5 to 17 Years | 0 (0.0%) | 15 (1.5%) |
| 18 to 34 Years | 0 (0.0%) | 36 (4.8%) |
| 35 to 64 Years | 52 (2.2%) | 75 (3.4%) |
| 65 to 74 Years | 0 (0.0%) | 19 (2.6%) |
| 75 Years and over | 0 (0.0%) | 39 (24.7%) |
Disability Class: Self-Care Difficulty
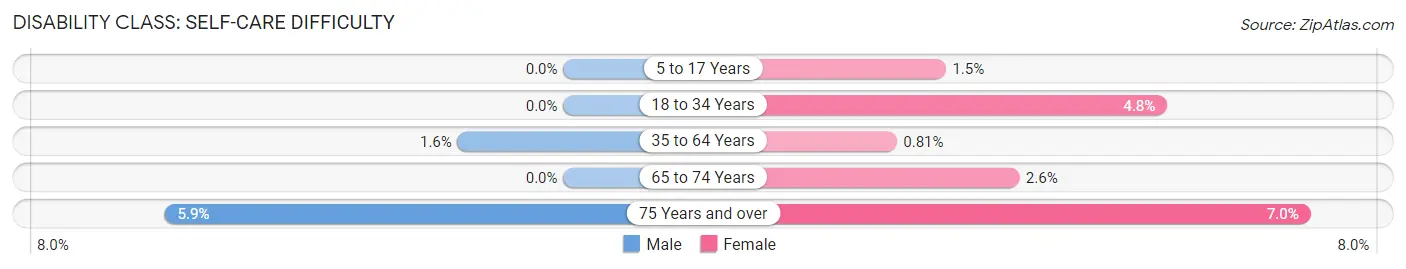
| Age Bracket | Male | Female |
| 5 to 17 Years | 0 (0.0%) | 15 (1.5%) |
| 18 to 34 Years | 0 (0.0%) | 36 (4.8%) |
| 35 to 64 Years | 37 (1.6%) | 18 (0.8%) |
| 65 to 74 Years | 0 (0.0%) | 19 (2.6%) |
| 75 Years and over | 9 (5.9%) | 11 (7.0%) |
Technology Access in Campton Hills
Computing Device Access in Campton Hills
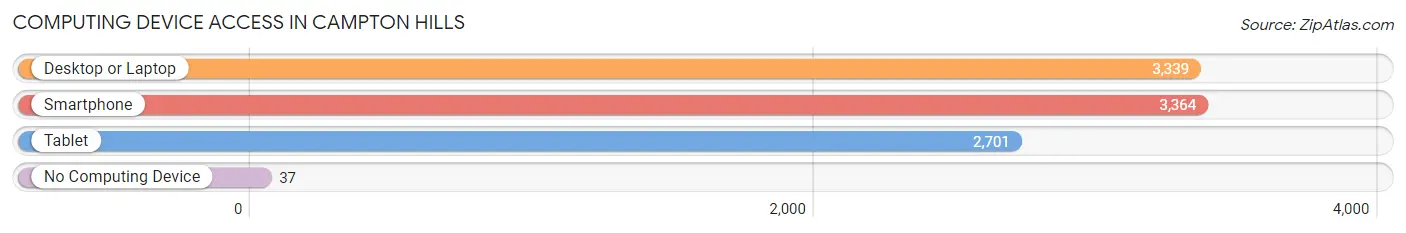
| Device Type | # Households | % Households |
| Desktop or Laptop | 3,339 | 97.2% |
| Smartphone | 3,364 | 97.9% |
| Tablet | 2,701 | 78.6% |
| No Computing Device | 37 | 1.1% |
| Total | 3,436 | 100.0% |
Internet Access in Campton Hills
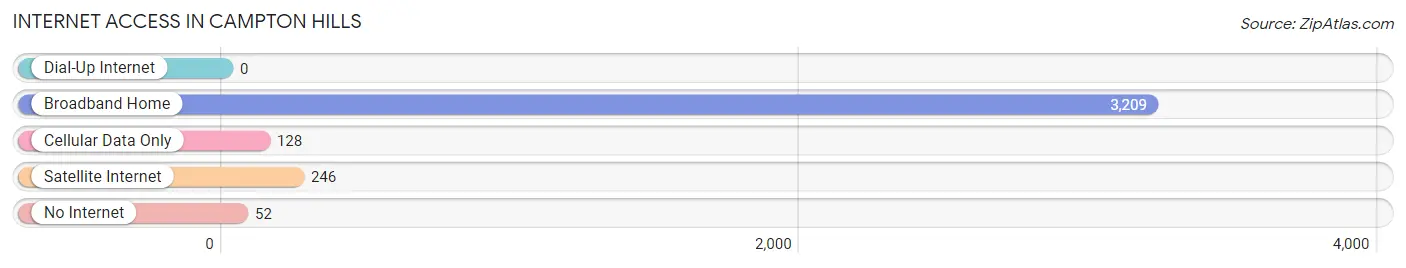
| Internet Type | # Households | % Households |
| Dial-Up Internet | 0 | 0.0% |
| Broadband Home | 3,209 | 93.4% |
| Cellular Data Only | 128 | 3.7% |
| Satellite Internet | 246 | 7.2% |
| No Internet | 52 | 1.5% |
| Total | 3,436 | 100.0% |
Campton Hills Summary
Campton Hills is a village located in Kane and DuPage counties in the state of Illinois. It is a part of the Chicago metropolitan area and is located about 40 miles west of the city. The village was incorporated in 2007 and has a population of approximately 11,000 people.
History
The area that is now Campton Hills was first settled in the early 1800s by settlers from New England. The area was originally known as “Campton” and was part of the larger Campton Township. The village was officially incorporated in 2007 and was named after the original Campton Township.
Geography
Campton Hills is located in the Fox River Valley, which is part of the Chicago metropolitan area. The village is situated on the western edge of Kane County and the eastern edge of DuPage County. The village is bordered by Elgin to the north, St. Charles to the east, Geneva to the south, and South Elgin to the west. The village covers an area of approximately 8.5 square miles and is located about 40 miles west of downtown Chicago.
The terrain of Campton Hills is mostly flat, with some rolling hills in the northern part of the village. The Fox River runs through the village and is a popular recreational spot for fishing, boating, and swimming. The village is also home to several parks, including Campton Hills Park, which features a playground, picnic areas, and a fishing pond.
Economy
The economy of Campton Hills is largely based on the service industry. The village is home to several restaurants, retail stores, and other businesses. The village is also home to several corporate headquarters, including the headquarters of the National Association of Realtors and the American Academy of Pediatrics.
The village is also home to several manufacturing companies, including the Campton Hills Manufacturing Company, which produces automotive parts. The village is also home to several technology companies, including the software company, Intuit.
Demographics
As of the 2010 census, the population of Campton Hills was 11,068. The racial makeup of the village was 87.3% White, 5.2% African American, 0.3% Native American, 3.2% Asian, and 3.9% from other races. Hispanic or Latino of any race were 8.2% of the population.
The median household income in Campton Hills was $97,917 in 2019, which is significantly higher than the national median of $61,937. The median home value in the village was $400,000 in 2019, which is also significantly higher than the national median of $219,700.
Campton Hills is a diverse and vibrant community that is home to a variety of businesses, industries, and people. The village is a great place to live, work, and play, and is a great place to call home.
Common Questions
What is the Total Population of Campton Hills?
Total Population of Campton Hills is 10,556.
What is the Total Male Population of Campton Hills?
Total Male Population of Campton Hills is 5,446.
What is the Total Female Population of Campton Hills?
Total Female Population of Campton Hills is 5,110.
What is the Ratio of Males per 100 Females in Campton Hills?
There are 106.58 Males per 100 Females in Campton Hills.
What is the Ratio of Females per 100 Males in Campton Hills?
There are 93.83 Females per 100 Males in Campton Hills.
What is the Median Population Age in Campton Hills?
Median Population Age in Campton Hills is 43.2 Years.
What is the Average Family Size in Campton Hills
Average Family Size in Campton Hills is 3.2 People.
What is the Average Household Size in Campton Hills
Average Household Size in Campton Hills is 3.1 People.
What is Per Capita Income in Campton Hills?
Per Capita income in Campton Hills is $74,354.
What is the Median Family Income in Campton Hills?
Median Family Income in Campton Hills is $196,106.
What is the Median Household income in Campton Hills?
Median Household Income in Campton Hills is $192,432.
What is Income or Wage Gap in Campton Hills?
Income or Wage Gap in Campton Hills is 59.8%.
Women in Campton Hills earn 40.2 cents for every dollar earned by a man.
What is Family Income Deficit in Campton Hills?
Family Income Deficit in Campton Hills is $9,273.
Families that are below poverty line in Campton Hills earn $9,273 less on average than the poverty threshold level.
What is Inequality or Gini Index in Campton Hills?
Inequality or Gini Index in Campton Hills is 0.39.
How Large is the Labor Force in Campton Hills?
There are 5,798 People in the Labor Forcein in Campton Hills.
What is the Percentage of People in the Labor Force in Campton Hills?
70.3% of People are in the Labor Force in Campton Hills.
What is the Unemployment Rate in Campton Hills?
Unemployment Rate in Campton Hills is 5.9%.