Park City, IL
Park City Map
Park City Overview
7,702
TOTAL POPULATION
3,691
MALE POPULATION
4,011
FEMALE POPULATION
92.02
MALES / 100 FEMALES
108.67
FEMALES / 100 MALES
31.2
MEDIAN AGE
3.5
AVG FAMILY SIZE
3.0
AVG HOUSEHOLD SIZE
$22,647
PER CAPITA INCOME
$63,683
AVG FAMILY INCOME
$58,540
AVG HOUSEHOLD INCOME
22.7%
WAGE / INCOME GAP [ % ]
77.3¢/ $1
WAGE / INCOME GAP [ $ ]
0.35
INEQUALITY / GINI INDEX
4,433
LABOR FORCE [ PEOPLE ]
72.0%
PERCENT IN LABOR FORCE
9.5%
UNEMPLOYMENT RATE
Race in Park City
The most populous races in Park City are Hispanic or Latino (5,752 | 74.7%), White / Caucasian (2,740 | 35.6%), and Some other Race (2,190 | 28.4%).

| Race | # Population | % Population |
| Asian | 138 | 1.8% |
| Black / African American | 678 | 8.8% |
| Hawaiian / Pacific | 0 | 0.0% |
| Hispanic or Latino | 5,752 | 74.7% |
| Native / Alaskan | 146 | 1.9% |
| White / Caucasian | 2,740 | 35.6% |
| Two or more Races | 1,810 | 23.5% |
| Some other Race | 2,190 | 28.4% |
| Total | 7,702 | 100.0% |
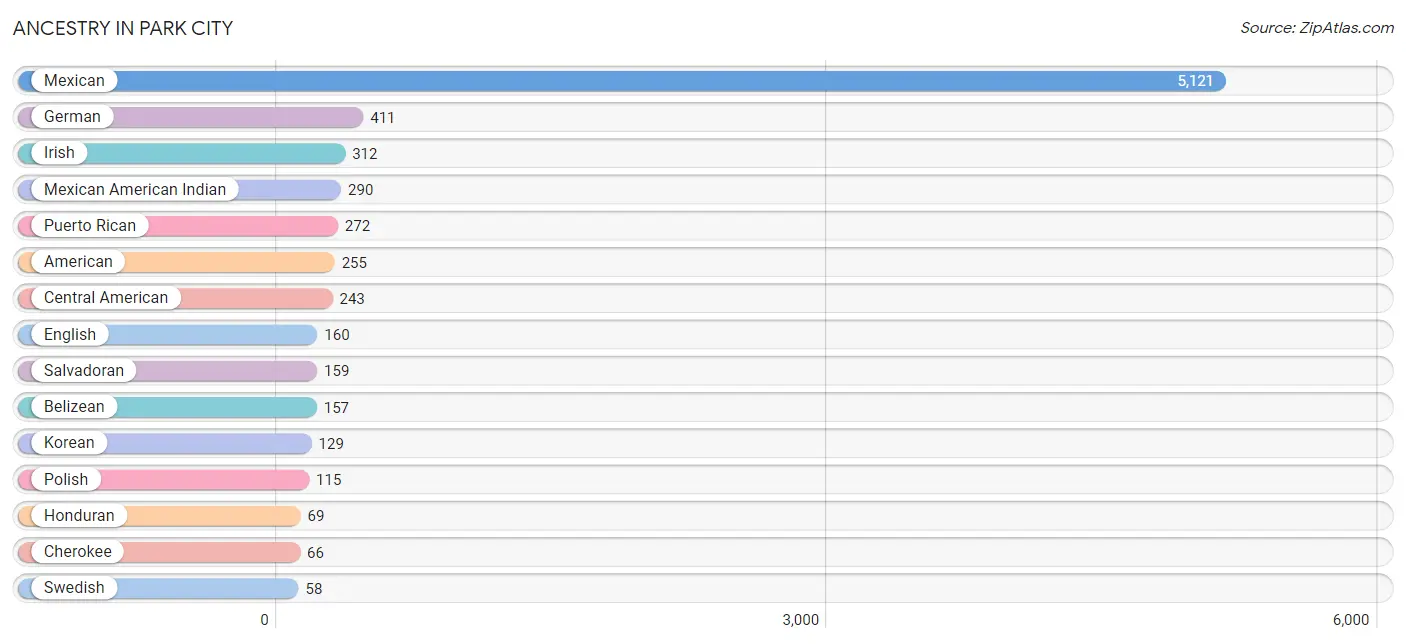
Ancestry in Park City
The most populous ancestries reported in Park City are Mexican (5,121 | 66.5%), German (411 | 5.3%), Irish (312 | 4.1%), Mexican American Indian (290 | 3.8%), and Puerto Rican (272 | 3.5%), together accounting for 83.2% of all Park City residents.
| Ancestry | # Population | % Population |
| American | 255 | 3.3% |
| Belizean | 157 | 2.0% |
| Bhutanese | 14 | 0.2% |
| British | 20 | 0.3% |
| Central American | 243 | 3.2% |
| Central American Indian | 21 | 0.3% |
| Cherokee | 66 | 0.9% |
| Colombian | 11 | 0.1% |
| Croatian | 38 | 0.5% |
| Cuban | 13 | 0.2% |
| English | 160 | 2.1% |
| Finnish | 22 | 0.3% |
| French | 14 | 0.2% |
| German | 411 | 5.3% |
| Greek | 13 | 0.2% |
| Guyanese | 20 | 0.3% |
| Honduran | 69 | 0.9% |
| Hungarian | 10 | 0.1% |
| Irish | 312 | 4.1% |
| Italian | 51 | 0.7% |
| Korean | 129 | 1.7% |
| Malaysian | 1 | 0.0% |
| Mexican | 5,121 | 66.5% |
| Mexican American Indian | 290 | 3.8% |
| Nigerian | 38 | 0.5% |
| Pennsylvania German | 11 | 0.1% |
| Polish | 115 | 1.5% |
| Puerto Rican | 272 | 3.5% |
| Russian | 11 | 0.1% |
| Salvadoran | 159 | 2.1% |
| Scottish | 14 | 0.2% |
| South American | 11 | 0.1% |
| Sri Lankan | 31 | 0.4% |
| Subsaharan African | 38 | 0.5% |
| Swedish | 58 | 0.7% |
| Tlingit-Haida | 22 | 0.3% | View All 36 Rows |
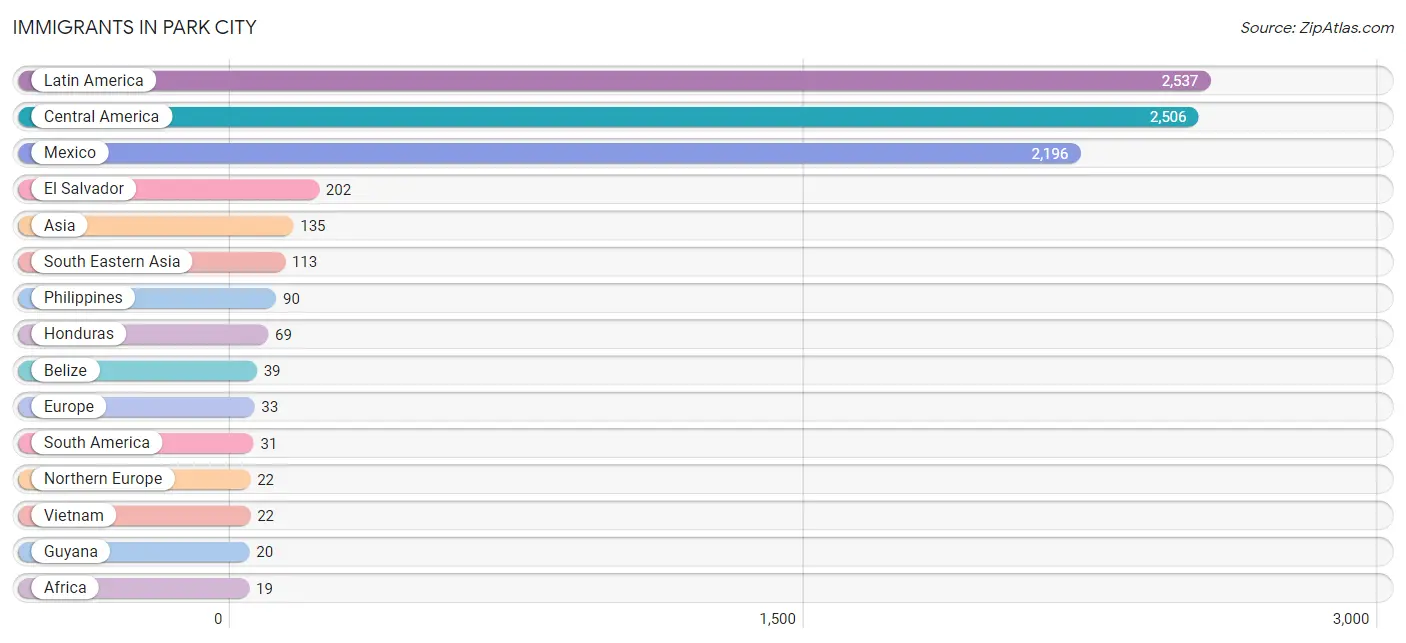
Immigrants in Park City
The most numerous immigrant groups reported in Park City came from Latin America (2,537 | 32.9%), Central America (2,506 | 32.5%), Mexico (2,196 | 28.5%), El Salvador (202 | 2.6%), and Asia (135 | 1.8%), together accounting for 98.4% of all Park City residents.
| Immigration Origin | # Population | % Population |
| Africa | 19 | 0.3% |
| Asia | 135 | 1.8% |
| Belize | 39 | 0.5% |
| Central America | 2,506 | 32.5% |
| Colombia | 11 | 0.1% |
| Eastern Asia | 14 | 0.2% |
| Eastern Europe | 11 | 0.1% |
| El Salvador | 202 | 2.6% |
| Europe | 33 | 0.4% |
| Guyana | 20 | 0.3% |
| Honduras | 69 | 0.9% |
| Japan | 14 | 0.2% |
| Jordan | 8 | 0.1% |
| Laos | 1 | 0.0% |
| Latin America | 2,537 | 32.9% |
| Mexico | 2,196 | 28.5% |
| Nigeria | 19 | 0.3% |
| Northern Europe | 22 | 0.3% |
| Philippines | 90 | 1.2% |
| Russia | 11 | 0.1% |
| South America | 31 | 0.4% |
| South Eastern Asia | 113 | 1.5% |
| Vietnam | 22 | 0.3% |
| Western Africa | 19 | 0.3% |
| Western Asia | 8 | 0.1% | View All 25 Rows |
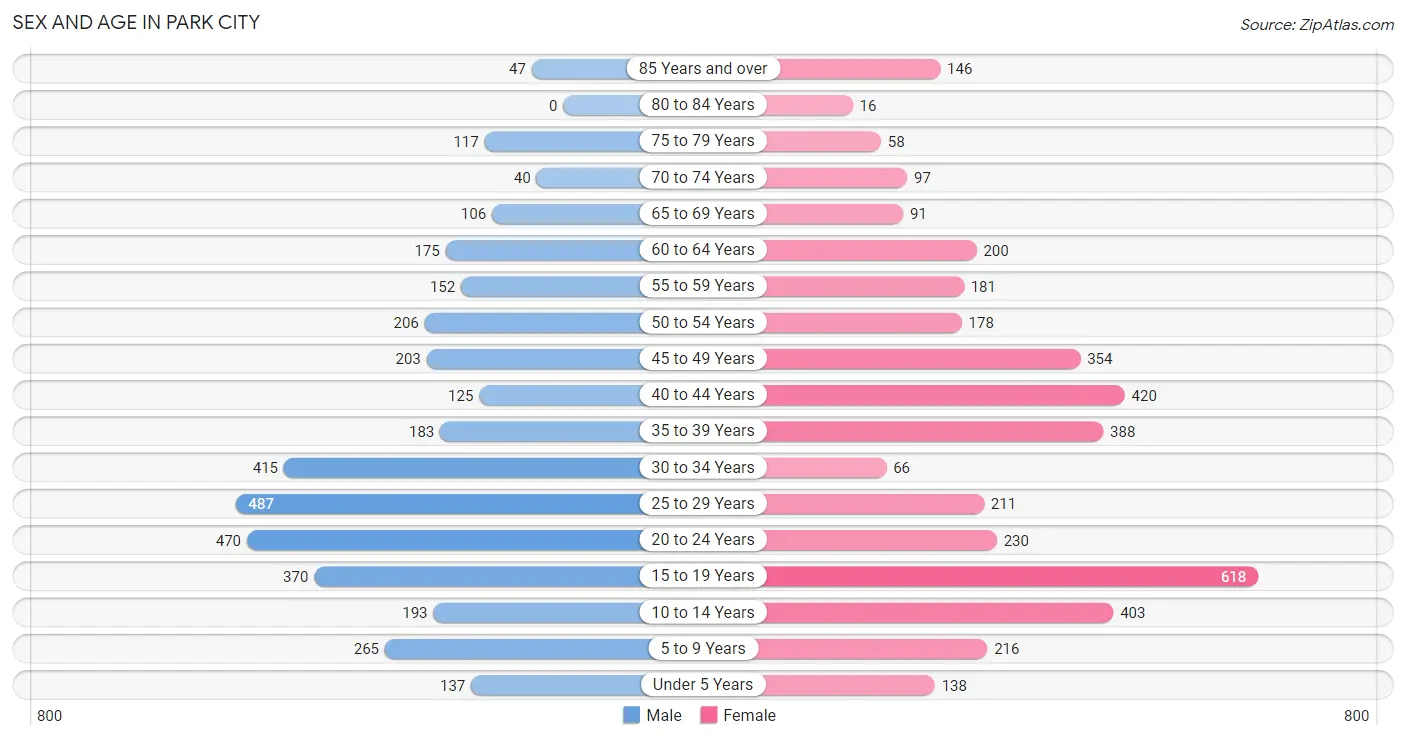
Sex and Age in Park City
Sex and Age in Park City
The most populous age groups in Park City are 25 to 29 Years (487 | 13.2%) for men and 15 to 19 Years (618 | 15.4%) for women.
| Age Bracket | Male | Female |
| Under 5 Years | 137 (3.7%) | 138 (3.4%) |
| 5 to 9 Years | 265 (7.2%) | 216 (5.4%) |
| 10 to 14 Years | 193 (5.2%) | 403 (10.1%) |
| 15 to 19 Years | 370 (10.0%) | 618 (15.4%) |
| 20 to 24 Years | 470 (12.7%) | 230 (5.7%) |
| 25 to 29 Years | 487 (13.2%) | 211 (5.3%) |
| 30 to 34 Years | 415 (11.2%) | 66 (1.7%) |
| 35 to 39 Years | 183 (5.0%) | 388 (9.7%) |
| 40 to 44 Years | 125 (3.4%) | 420 (10.5%) |
| 45 to 49 Years | 203 (5.5%) | 354 (8.8%) |
| 50 to 54 Years | 206 (5.6%) | 178 (4.4%) |
| 55 to 59 Years | 152 (4.1%) | 181 (4.5%) |
| 60 to 64 Years | 175 (4.7%) | 200 (5.0%) |
| 65 to 69 Years | 106 (2.9%) | 91 (2.3%) |
| 70 to 74 Years | 40 (1.1%) | 97 (2.4%) |
| 75 to 79 Years | 117 (3.2%) | 58 (1.5%) |
| 80 to 84 Years | 0 (0.0%) | 16 (0.4%) |
| 85 Years and over | 47 (1.3%) | 146 (3.6%) |
| Total | 3,691 (100.0%) | 4,011 (100.0%) |
Families and Households in Park City
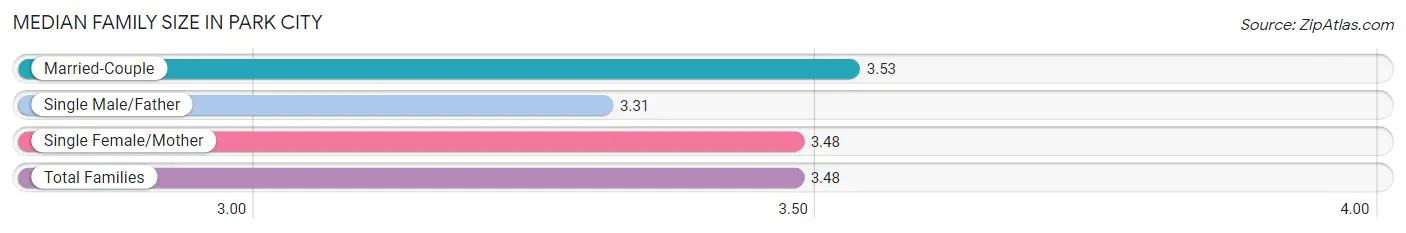
Median Family Size in Park City
The median family size in Park City is 3.48 persons per family, with married-couple families (966 | 52.3%) accounting for the largest median family size of 3.53 persons per family. On the other hand, single male/father families (262 | 14.2%) represent the smallest median family size with 3.31 persons per family.
| Family Type | # Families | Family Size |
| Married-Couple | 966 (52.3%) | 3.53 |
| Single Male/Father | 262 (14.2%) | 3.31 |
| Single Female/Mother | 619 (33.5%) | 3.48 |
| Total Families | 1,847 (100.0%) | 3.48 |
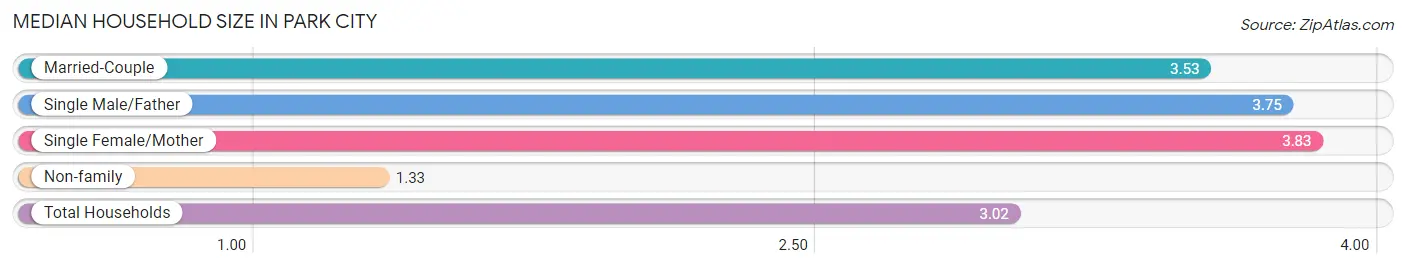
Median Household Size in Park City
The median household size in Park City is 3.02 persons per household, with single female/mother households (619 | 24.3%) accounting for the largest median household size of 3.83 persons per household. non-family households (704 | 27.6%) represent the smallest median household size with 1.33 persons per household.
| Household Type | # Households | Household Size |
| Married-Couple | 966 (37.9%) | 3.53 |
| Single Male/Father | 262 (10.3%) | 3.75 |
| Single Female/Mother | 619 (24.3%) | 3.83 |
| Non-family | 704 (27.6%) | 1.33 |
| Total Households | 2,551 (100.0%) | 3.02 |
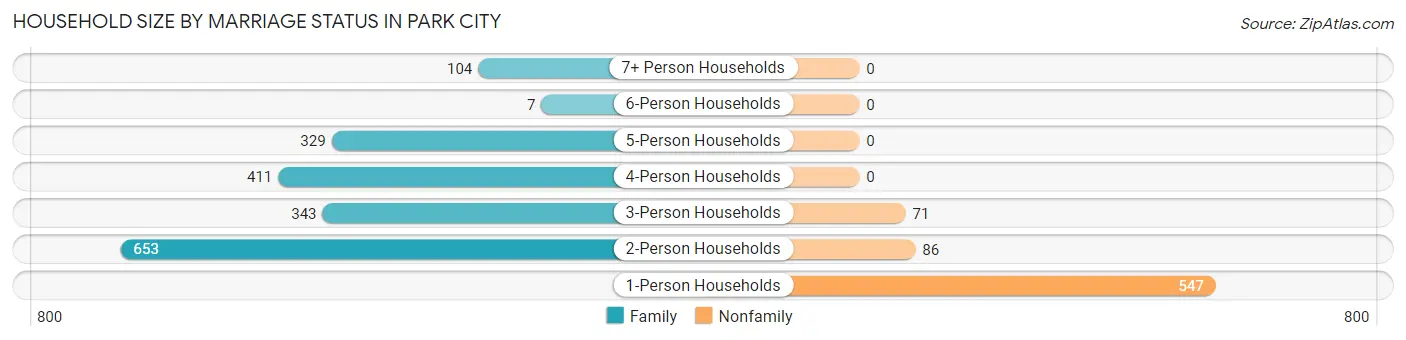
Household Size by Marriage Status in Park City
Out of a total of 2,551 households in Park City, 1,847 (72.4%) are family households, while 704 (27.6%) are nonfamily households. The most numerous type of family households are 2-person households, comprising 653, and the most common type of nonfamily households are 1-person households, comprising 547.
| Household Size | Family Households | Nonfamily Households |
| 1-Person Households | - | 547 (21.4%) |
| 2-Person Households | 653 (25.6%) | 86 (3.4%) |
| 3-Person Households | 343 (13.5%) | 71 (2.8%) |
| 4-Person Households | 411 (16.1%) | 0 (0.0%) |
| 5-Person Households | 329 (12.9%) | 0 (0.0%) |
| 6-Person Households | 7 (0.3%) | 0 (0.0%) |
| 7+ Person Households | 104 (4.1%) | 0 (0.0%) |
| Total | 1,847 (72.4%) | 704 (27.6%) |
Female Fertility in Park City
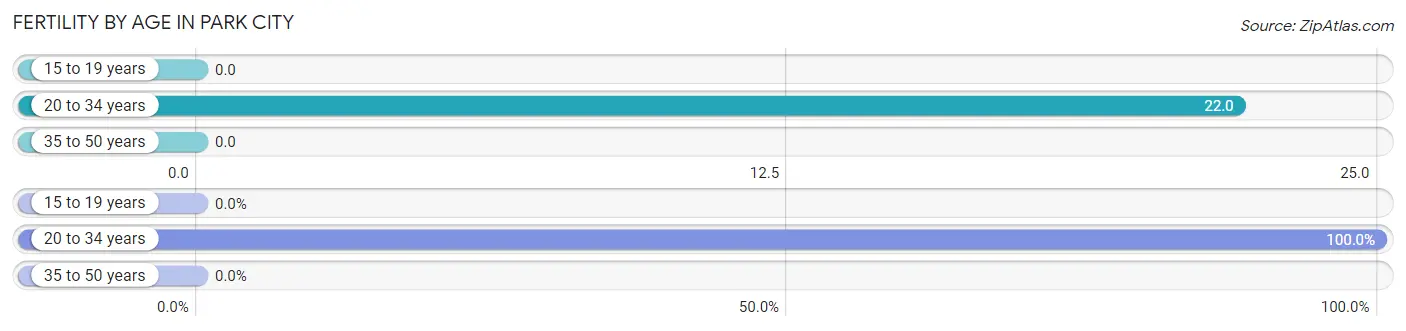
Fertility by Age in Park City
Average fertility rate in Park City is 5.0 births per 1,000 women. Women in the age bracket of 20 to 34 years have the highest fertility rate with 22.0 births per 1,000 women. Women in the age bracket of 20 to 34 years acount for 100.0% of all women with births.
| Age Bracket | Women with Births | Births / 1,000 Women |
| 15 to 19 years | 0 (0.0%) | 0.0 |
| 20 to 34 years | 11 (100.0%) | 22.0 |
| 35 to 50 years | 0 (0.0%) | 0.0 |
| Total | 11 (100.0%) | 5.0 |
Fertility by Age by Marriage Status in Park City
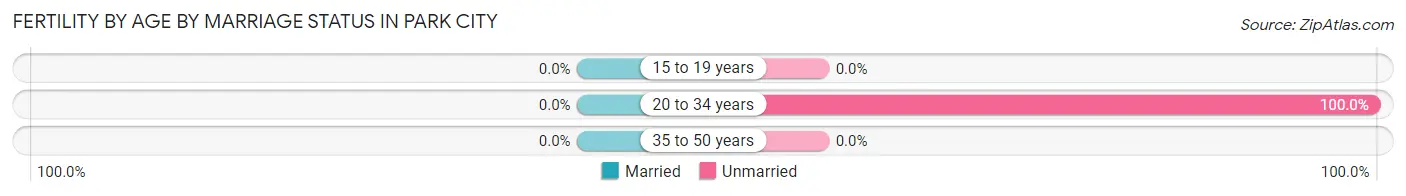
| Age Bracket | Married | Unmarried |
| 15 to 19 years | 0 (0.0%) | 0 (0.0%) |
| 20 to 34 years | 0 (0.0%) | 11 (100.0%) |
| 35 to 50 years | 0 (0.0%) | 0 (0.0%) |
| Total | 0 (0.0%) | 11 (100.0%) |
Fertility by Education in Park City
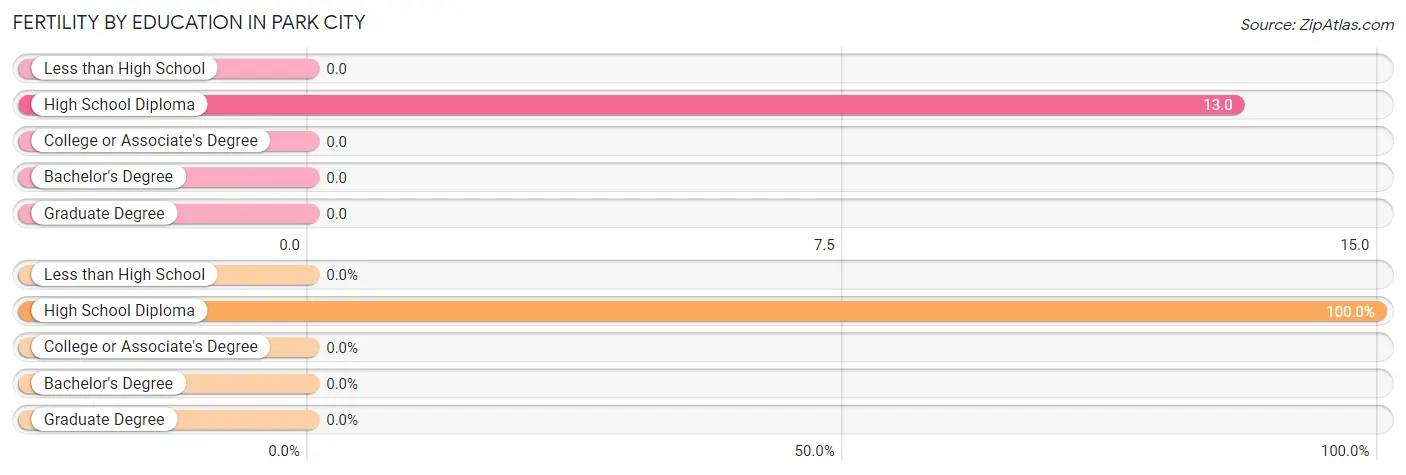
| Educational Attainment | Women with Births | Births / 1,000 Women |
| Less than High School | 0 (0.0%) | 0.0 |
| High School Diploma | 11 (100.0%) | 13.0 |
| College or Associate's Degree | 0 (0.0%) | 0.0 |
| Bachelor's Degree | 0 (0.0%) | 0.0 |
| Graduate Degree | 0 (0.0%) | 0.0 |
| Total | 11 (100.0%) | 5.0 |
Fertility by Education by Marriage Status in Park City
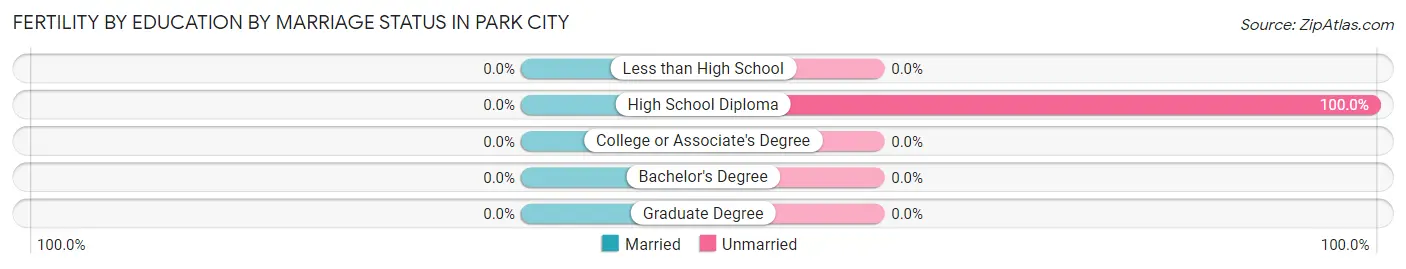
| Educational Attainment | Married | Unmarried |
| Less than High School | 0 (0.0%) | 0 (0.0%) |
| High School Diploma | 0 (0.0%) | 11 (100.0%) |
| College or Associate's Degree | 0 (0.0%) | 0 (0.0%) |
| Bachelor's Degree | 0 (0.0%) | 0 (0.0%) |
| Graduate Degree | 0 (0.0%) | 0 (0.0%) |
| Total | 0 (0.0%) | 11 (100.0%) |
Income in Park City
Income Overview in Park City
Per Capita Income in Park City is $22,647, while median incomes of families and households are $63,683 and $58,540 respectively.
| Characteristic | Number | Measure |
| Per Capita Income | 7,702 | $22,647 |
| Median Family Income | 1,847 | $63,683 |
| Mean Family Income | 1,847 | $68,000 |
| Median Household Income | 2,551 | $58,540 |
| Mean Household Income | 2,551 | $65,216 |
| Income Deficit | 1,847 | $0 |
| Wage / Income Gap (%) | 7,702 | 22.69% |
| Wage / Income Gap ($) | 7,702 | 77.31¢ per $1 |
| Gini / Inequality Index | 7,702 | 0.35 |
Earnings by Sex in Park City
Average Earnings in Park City are $29,206, $33,291 for men and $25,736 for women, a difference of 22.7%.
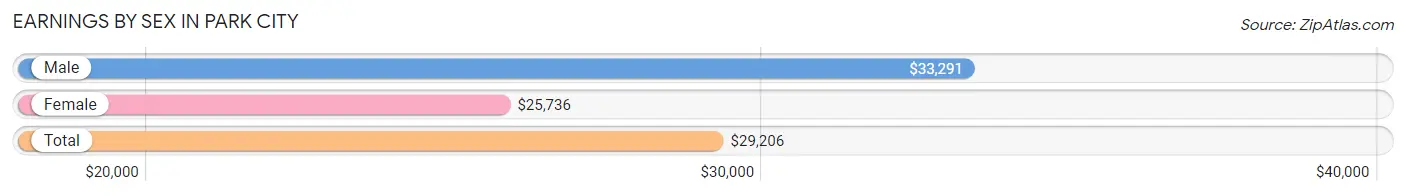
| Sex | Number | Average Earnings |
| Male | 2,336 (53.9%) | $33,291 |
| Female | 1,998 (46.1%) | $25,736 |
| Total | 4,334 (100.0%) | $29,206 |
Earnings by Sex by Income Bracket in Park City
The most common earnings brackets in Park City are $25,000 to $29,999 for men (282 | 12.1%) and $25,000 to $29,999 for women (303 | 15.2%).
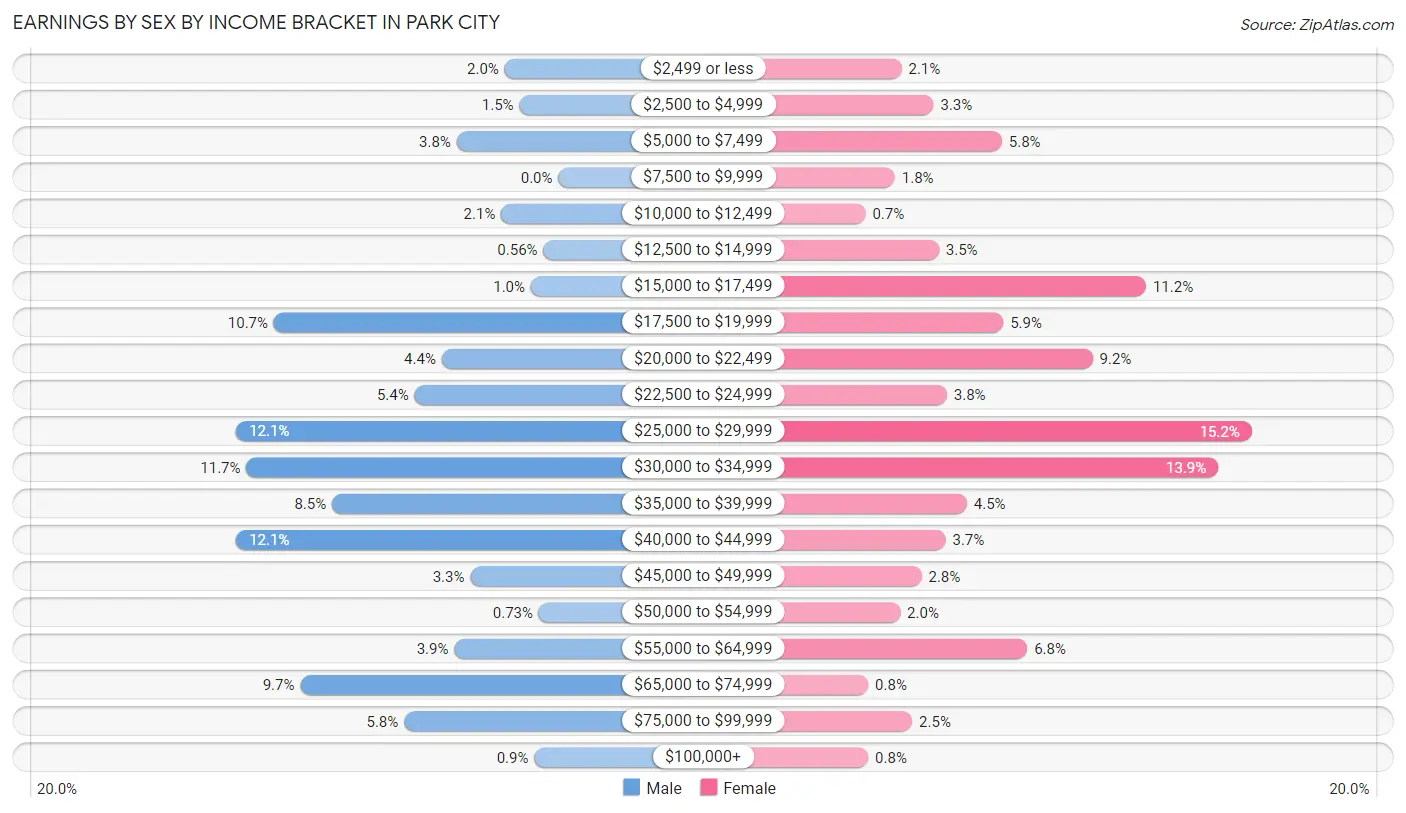
| Income | Male | Female |
| $2,499 or less | 47 (2.0%) | 41 (2.1%) |
| $2,500 to $4,999 | 34 (1.5%) | 65 (3.3%) |
| $5,000 to $7,499 | 89 (3.8%) | 116 (5.8%) |
| $7,500 to $9,999 | 0 (0.0%) | 36 (1.8%) |
| $10,000 to $12,499 | 50 (2.1%) | 14 (0.7%) |
| $12,500 to $14,999 | 13 (0.6%) | 69 (3.5%) |
| $15,000 to $17,499 | 24 (1.0%) | 224 (11.2%) |
| $17,500 to $19,999 | 249 (10.7%) | 117 (5.9%) |
| $20,000 to $22,499 | 102 (4.4%) | 184 (9.2%) |
| $22,500 to $24,999 | 126 (5.4%) | 75 (3.7%) |
| $25,000 to $29,999 | 282 (12.1%) | 303 (15.2%) |
| $30,000 to $34,999 | 273 (11.7%) | 278 (13.9%) |
| $35,000 to $39,999 | 198 (8.5%) | 90 (4.5%) |
| $40,000 to $44,999 | 282 (12.1%) | 74 (3.7%) |
| $45,000 to $49,999 | 77 (3.3%) | 56 (2.8%) |
| $50,000 to $54,999 | 17 (0.7%) | 40 (2.0%) |
| $55,000 to $64,999 | 91 (3.9%) | 135 (6.8%) |
| $65,000 to $74,999 | 226 (9.7%) | 16 (0.8%) |
| $75,000 to $99,999 | 135 (5.8%) | 49 (2.5%) |
| $100,000+ | 21 (0.9%) | 16 (0.8%) |
| Total | 2,336 (100.0%) | 1,998 (100.0%) |
Earnings by Sex by Educational Attainment in Park City
Average earnings in Park City are $37,244 for men and $28,892 for women, a difference of 22.4%. Men with an educational attainment of college or associate's degree enjoy the highest average annual earnings of $43,839, while those with less than high school education earn the least with $36,045. Women with an educational attainment of graduate degree earn the most with the average annual earnings of $60,282, while those with college or associate's degree education have the smallest earnings of $21,948.
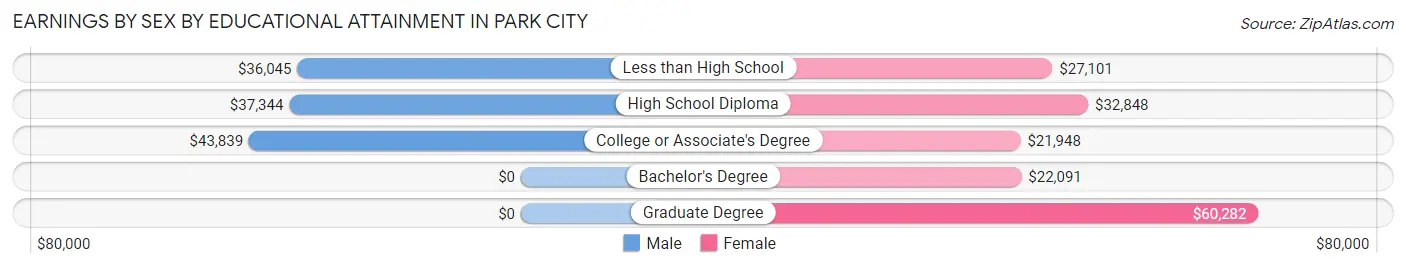
| Educational Attainment | Male Income | Female Income |
| Less than High School | $36,045 | $27,101 |
| High School Diploma | $37,344 | $32,848 |
| College or Associate's Degree | $43,839 | $21,948 |
| Bachelor's Degree | - | - |
| Graduate Degree | - | - |
| Total | $37,244 | $28,892 |
Family Income in Park City
Family Income Brackets in Park City
According to the Park City family income data, there are 584 families falling into the $50,000 to $74,999 income range, which is the most common income bracket and makes up 31.6% of all families. Conversely, the $200,000+ income bracket is the least frequent group with only 9 families (0.5%) belonging to this category.
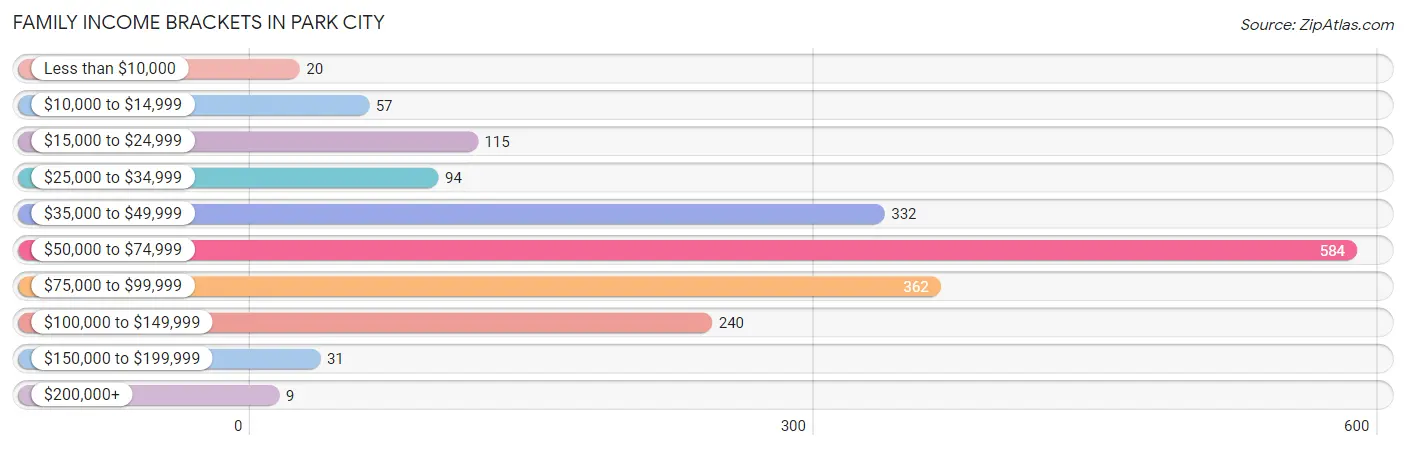
| Income Bracket | # Families | % Families |
| Less than $10,000 | 20 | 1.1% |
| $10,000 to $14,999 | 57 | 3.1% |
| $15,000 to $24,999 | 115 | 6.2% |
| $25,000 to $34,999 | 94 | 5.1% |
| $35,000 to $49,999 | 332 | 18.0% |
| $50,000 to $74,999 | 584 | 31.6% |
| $75,000 to $99,999 | 362 | 19.6% |
| $100,000 to $149,999 | 240 | 13.0% |
| $150,000 to $199,999 | 31 | 1.7% |
| $200,000+ | 9 | 0.5% |
Family Income by Famaliy Size in Park City
7+ person families (104 | 5.6%) account for the highest median family income in Park City with $91,970 per family, while 2-person families (760 | 41.1%) have the highest median income of $29,198 per family member.
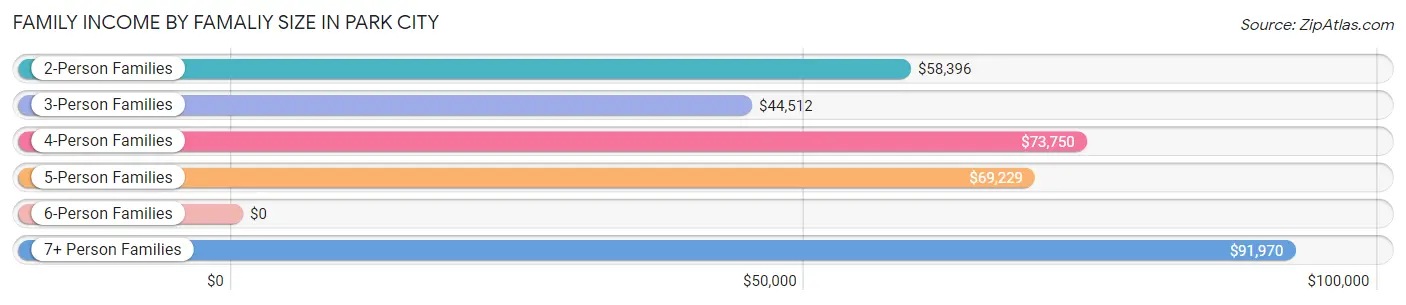
| Income Bracket | # Families | Median Income |
| 2-Person Families | 760 (41.1%) | $58,396 |
| 3-Person Families | 340 (18.4%) | $44,512 |
| 4-Person Families | 426 (23.1%) | $73,750 |
| 5-Person Families | 210 (11.4%) | $69,229 |
| 6-Person Families | 7 (0.4%) | $0 |
| 7+ Person Families | 104 (5.6%) | $91,970 |
| Total | 1,847 (100.0%) | $63,683 |
Family Income by Number of Earners in Park City
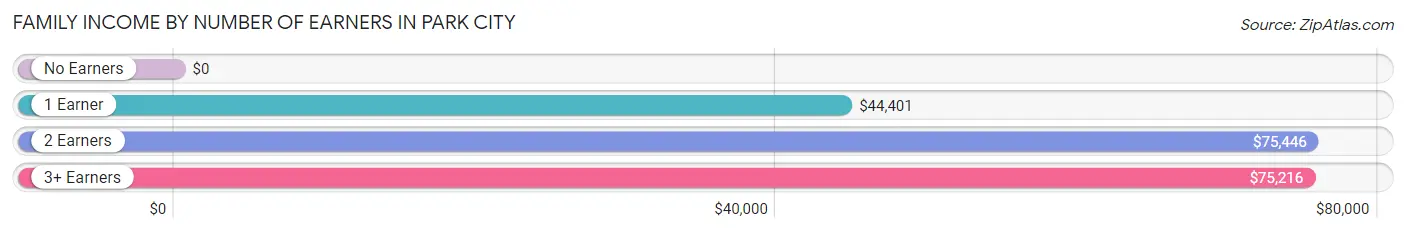
| Number of Earners | # Families | Median Income |
| No Earners | 176 (9.5%) | $0 |
| 1 Earner | 564 (30.5%) | $44,401 |
| 2 Earners | 734 (39.7%) | $75,446 |
| 3+ Earners | 373 (20.2%) | $75,216 |
| Total | 1,847 (100.0%) | $63,683 |
Household Income in Park City
Household Income Brackets in Park City
With 538 households falling in the category, the $50,000 to $74,999 income range is the most frequent in Park City, accounting for 21.1% of all households. In contrast, only 31 households (1.2%) fall into the $200,000+ income bracket, making it the least populous group.
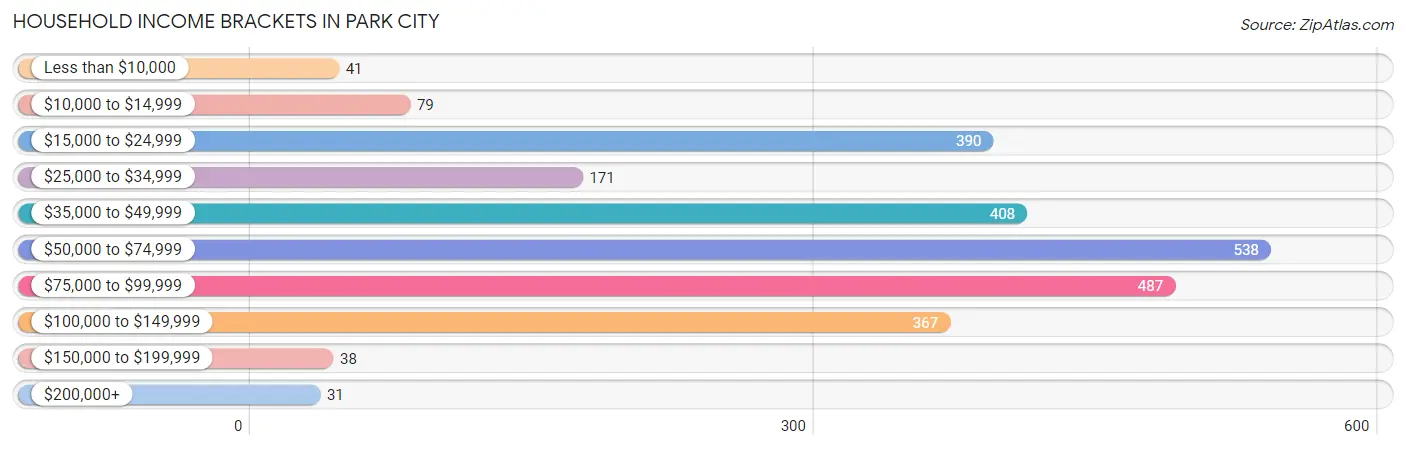
| Income Bracket | # Households | % Households |
| Less than $10,000 | 41 | 1.6% |
| $10,000 to $14,999 | 79 | 3.1% |
| $15,000 to $24,999 | 390 | 15.3% |
| $25,000 to $34,999 | 171 | 6.7% |
| $35,000 to $49,999 | 408 | 16.0% |
| $50,000 to $74,999 | 538 | 21.1% |
| $75,000 to $99,999 | 487 | 19.1% |
| $100,000 to $149,999 | 367 | 14.4% |
| $150,000 to $199,999 | 38 | 1.5% |
| $200,000+ | 31 | 1.2% |
Household Income by Householder Age in Park City
The median household income in Park City is $58,540, with the highest median household income of $69,814 found in the 25 to 44 years age bracket for the primary householder. A total of 996 households (39.0%) fall into this category. Meanwhile, the 15 to 24 years age bracket for the primary householder has the lowest median household income of $0, with 75 households (2.9%) in this group.
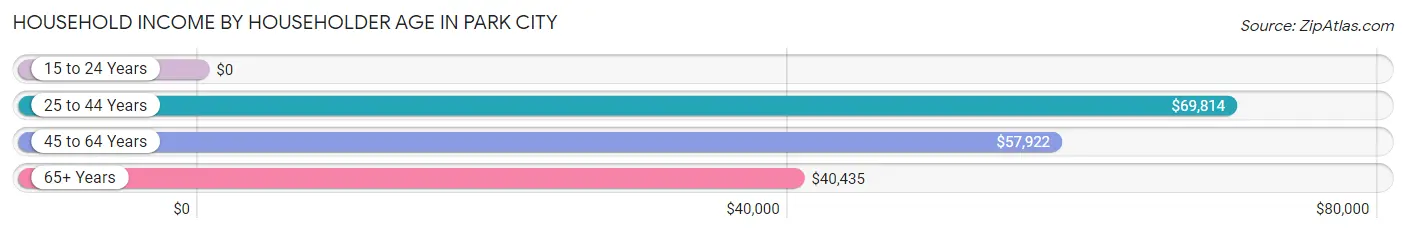
| Income Bracket | # Households | Median Income |
| 15 to 24 Years | 75 (2.9%) | $0 |
| 25 to 44 Years | 996 (39.0%) | $69,814 |
| 45 to 64 Years | 1,000 (39.2%) | $57,922 |
| 65+ Years | 480 (18.8%) | $40,435 |
| Total | 2,551 (100.0%) | $58,540 |
Poverty in Park City
Income Below Poverty by Sex and Age in Park City
With 12.7% poverty level for males and 8.3% for females among the residents of Park City, 6 to 11 year old males and 5 year old females are the most vulnerable to poverty, with 24 males (40.7%) and 13 females (26.5%) in their respective age groups living below the poverty level.
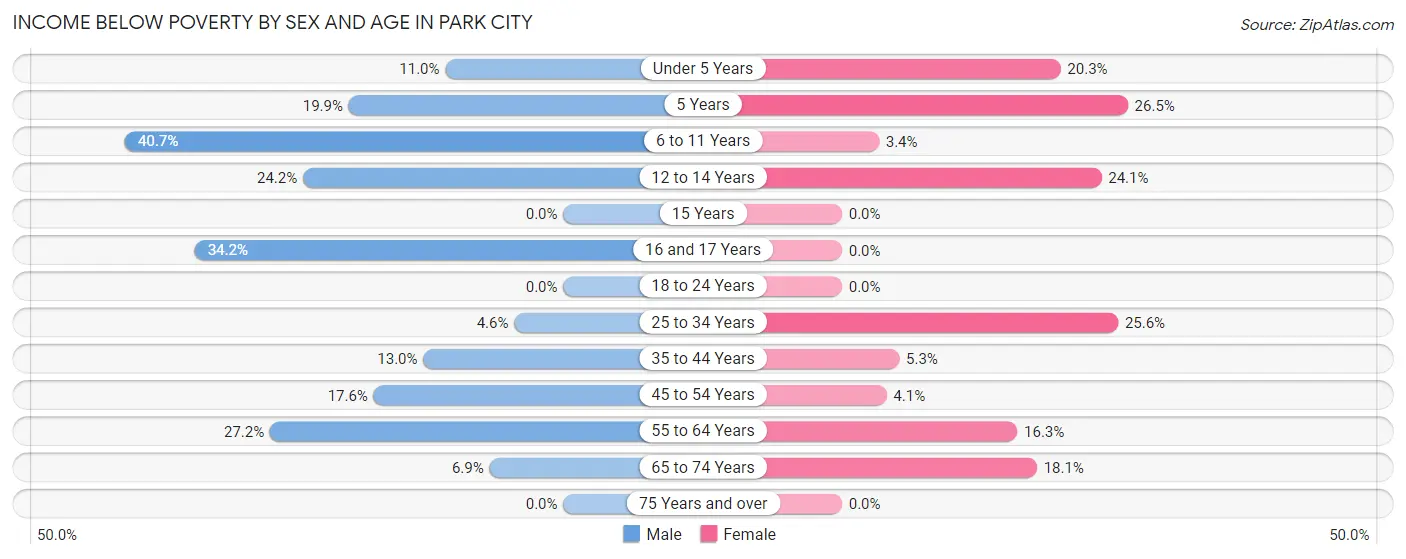
| Age Bracket | Male | Female |
| Under 5 Years | 15 (11.0%) | 28 (20.3%) |
| 5 Years | 44 (19.9%) | 13 (26.5%) |
| 6 to 11 Years | 24 (40.7%) | 13 (3.4%) |
| 12 to 14 Years | 43 (24.2%) | 46 (24.1%) |
| 15 Years | 0 (0.0%) | 0 (0.0%) |
| 16 and 17 Years | 91 (34.2%) | 0 (0.0%) |
| 18 to 24 Years | 0 (0.0%) | 0 (0.0%) |
| 25 to 34 Years | 41 (4.5%) | 71 (25.6%) |
| 35 to 44 Years | 40 (13.0%) | 43 (5.3%) |
| 45 to 54 Years | 72 (17.6%) | 22 (4.1%) |
| 55 to 64 Years | 89 (27.2%) | 62 (16.3%) |
| 65 to 74 Years | 10 (6.9%) | 34 (18.1%) |
| 75 Years and over | 0 (0.0%) | 0 (0.0%) |
| Total | 469 (12.7%) | 332 (8.3%) |
Income Above Poverty by Sex and Age in Park City
According to the poverty statistics in Park City, males aged 15 years and females aged 15 years are the age groups that are most secure financially, with 100.0% of males and 100.0% of females in these age groups living above the poverty line.
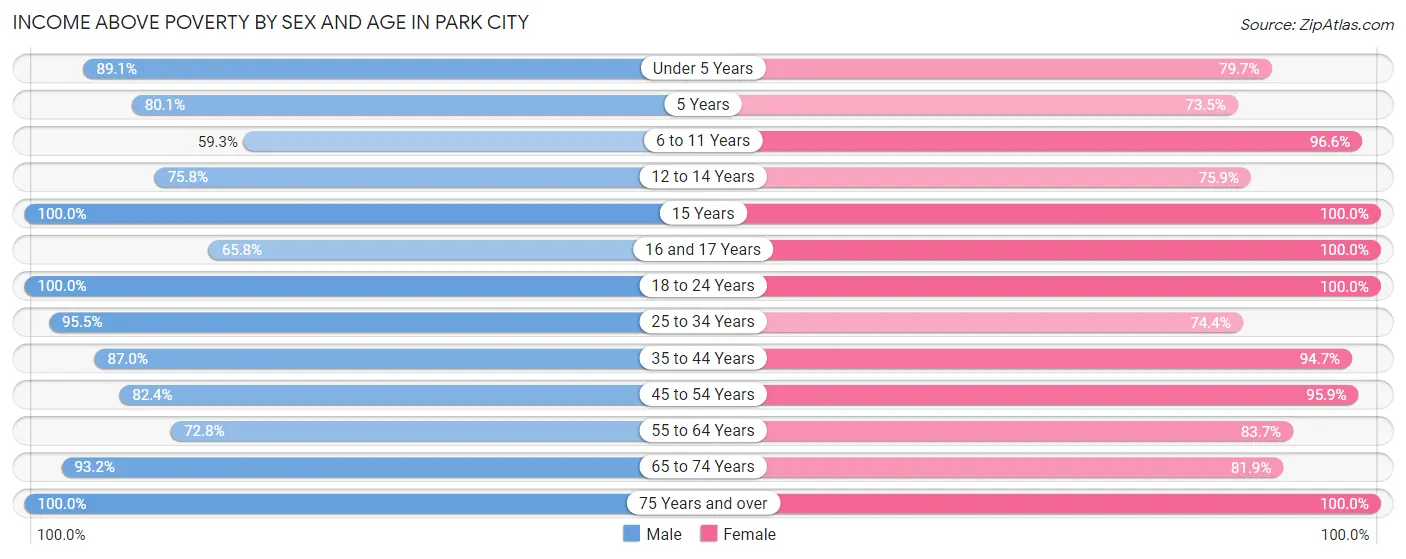
| Age Bracket | Male | Female |
| Under 5 Years | 122 (89.0%) | 110 (79.7%) |
| 5 Years | 177 (80.1%) | 36 (73.5%) |
| 6 to 11 Years | 35 (59.3%) | 366 (96.6%) |
| 12 to 14 Years | 135 (75.8%) | 145 (75.9%) |
| 15 Years | 52 (100.0%) | 141 (100.0%) |
| 16 and 17 Years | 175 (65.8%) | 128 (100.0%) |
| 18 to 24 Years | 522 (100.0%) | 579 (100.0%) |
| 25 to 34 Years | 861 (95.5%) | 206 (74.4%) |
| 35 to 44 Years | 268 (87.0%) | 765 (94.7%) |
| 45 to 54 Years | 337 (82.4%) | 510 (95.9%) |
| 55 to 64 Years | 238 (72.8%) | 319 (83.7%) |
| 65 to 74 Years | 136 (93.1%) | 154 (81.9%) |
| 75 Years and over | 164 (100.0%) | 220 (100.0%) |
| Total | 3,222 (87.3%) | 3,679 (91.7%) |
Income Below Poverty Among Married-Couple Families in Park City
The poverty statistics for married-couple families in Park City show that 4.7% or 45 of the total 966 families live below the poverty line. Families with no children have the highest poverty rate of 8.6%, comprising of 45 families. On the other hand, families with 1 or 2 children have the lowest poverty rate of 0.0%, which includes 0 families.
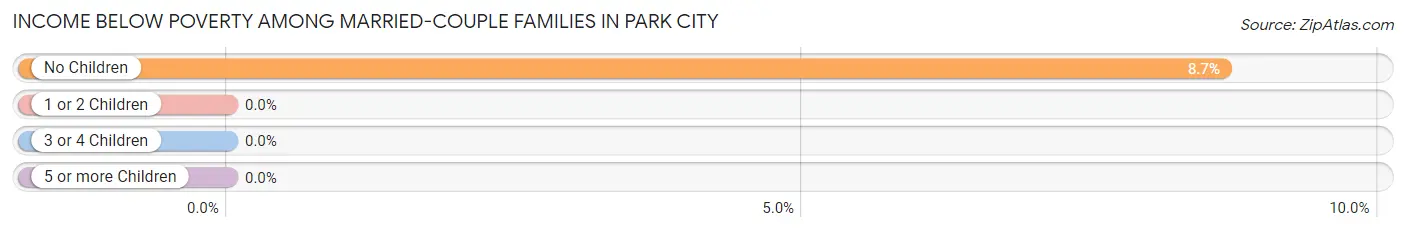
| Children | Above Poverty | Below Poverty |
| No Children | 475 (91.3%) | 45 (8.6%) |
| 1 or 2 Children | 391 (100.0%) | 0 (0.0%) |
| 3 or 4 Children | 55 (100.0%) | 0 (0.0%) |
| 5 or more Children | 0 (0.0%) | 0 (0.0%) |
| Total | 921 (95.3%) | 45 (4.7%) |
Income Below Poverty Among Single-Parent Households in Park City
According to the poverty data in Park City, 19.1% or 50 single-father households and 10.7% or 66 single-mother households are living below the poverty line. Among single-father households, those with no children have the highest poverty rate, with 40 households (44.9%) experiencing poverty. Likewise, among single-mother households, those with 3 or 4 children have the highest poverty rate, with 43 households (100.0%) falling below the poverty line.
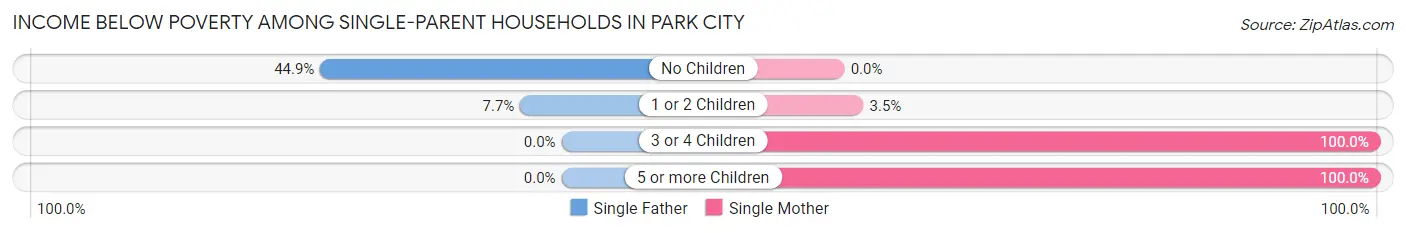
| Children | Single Father | Single Mother |
| No Children | 40 (44.9%) | 0 (0.0%) |
| 1 or 2 Children | 10 (7.7%) | 12 (3.5%) |
| 3 or 4 Children | 0 (0.0%) | 43 (100.0%) |
| 5 or more Children | 0 (0.0%) | 11 (100.0%) |
| Total | 50 (19.1%) | 66 (10.7%) |
Income Below Poverty Among Married-Couple vs Single-Parent Households in Park City
The poverty data for Park City shows that 45 of the married-couple family households (4.7%) and 116 of the single-parent households (13.2%) are living below the poverty level. Within the married-couple family households, those with no children have the highest poverty rate, with 45 households (8.6%) falling below the poverty line. Among the single-parent households, those with 5 or more children have the highest poverty rate, with 11 household (100.0%) living below poverty.
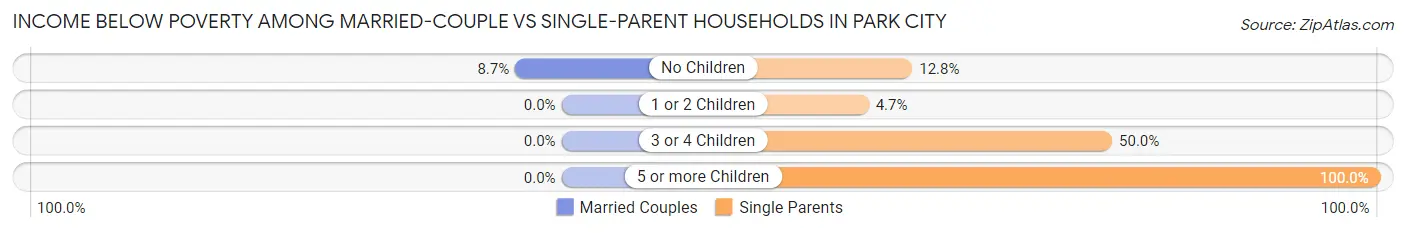
| Children | Married-Couple Families | Single-Parent Households |
| No Children | 45 (8.6%) | 40 (12.8%) |
| 1 or 2 Children | 0 (0.0%) | 22 (4.7%) |
| 3 or 4 Children | 0 (0.0%) | 43 (50.0%) |
| 5 or more Children | 0 (0.0%) | 11 (100.0%) |
| Total | 45 (4.7%) | 116 (13.2%) |
Employment Characteristics in Park City
Employment by Class of Employer in Park City
Among the 3,869 employed individuals in Park City, private company employees (3,125 | 80.8%), not-for-profit organizations (337 | 8.7%), and self-employed (not incorporated) (87 | 2.2%) make up the most common classes of employment.
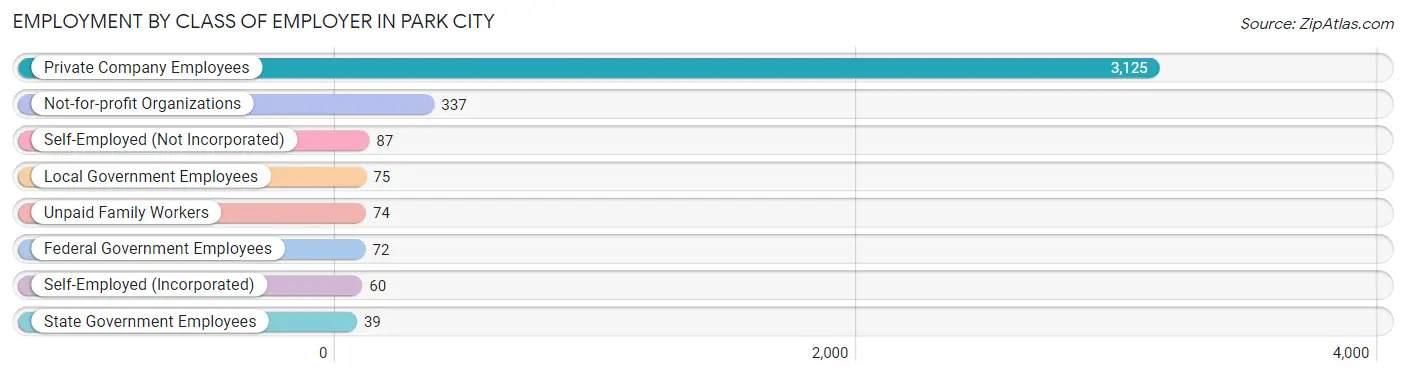
| Employer Class | # Employees | % Employees |
| Private Company Employees | 3,125 | 80.8% |
| Self-Employed (Incorporated) | 60 | 1.5% |
| Self-Employed (Not Incorporated) | 87 | 2.2% |
| Not-for-profit Organizations | 337 | 8.7% |
| Local Government Employees | 75 | 1.9% |
| State Government Employees | 39 | 1.0% |
| Federal Government Employees | 72 | 1.9% |
| Unpaid Family Workers | 74 | 1.9% |
| Total | 3,869 | 100.0% |
Employment Status by Age in Park City
According to the labor force statistics for Park City, out of the total population over 16 years of age (6,157), 72.0% or 4,433 individuals are in the labor force, with 9.5% or 421 of them unemployed. The age group with the highest labor force participation rate is 35 to 44 years, with 94.7% or 1,057 individuals in the labor force. Within the labor force, the 16 to 19 years age range has the highest percentage of unemployed individuals, with 30.3% or 125 of them being unemployed.
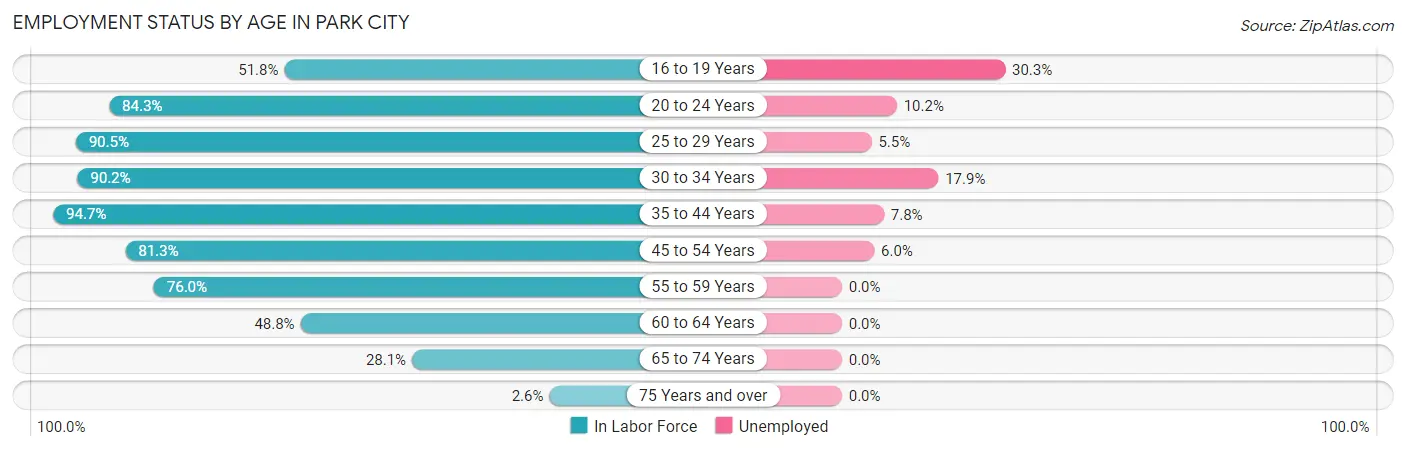
| Age Bracket | In Labor Force | Unemployed |
| 16 to 19 Years | 412 (51.8%) | 125 (30.3%) |
| 20 to 24 Years | 590 (84.3%) | 60 (10.2%) |
| 25 to 29 Years | 632 (90.5%) | 35 (5.5%) |
| 30 to 34 Years | 434 (90.2%) | 78 (17.9%) |
| 35 to 44 Years | 1,057 (94.7%) | 82 (7.8%) |
| 45 to 54 Years | 765 (81.3%) | 46 (6.0%) |
| 55 to 59 Years | 253 (76.0%) | 0 (0.0%) |
| 60 to 64 Years | 183 (48.8%) | 0 (0.0%) |
| 65 to 74 Years | 94 (28.1%) | 0 (0.0%) |
| 75 Years and over | 10 (2.6%) | 0 (0.0%) |
| Total | 4,433 (72.0%) | 421 (9.5%) |
Employment Status by Educational Attainment in Park City
According to labor force statistics for Park City, 84.3% of individuals (3,325) out of the total population between 25 and 64 years of age (3,944) are in the labor force, with 7.1% or 236 of them being unemployed. The group with the highest labor force participation rate are those with the educational attainment of bachelor's degree or higher, with 89.8% or 405 individuals in the labor force. Within the labor force, individuals with less than high school education have the highest percentage of unemployment, with 11.2% or 111 of them being unemployed.
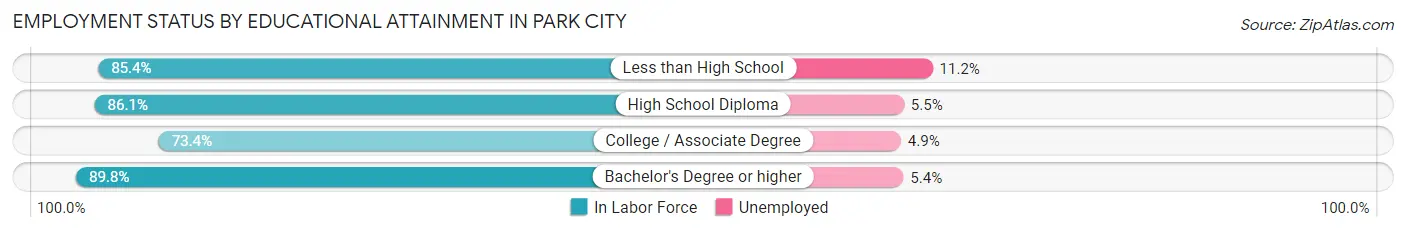
| Educational Attainment | In Labor Force | Unemployed |
| Less than High School | 995 (85.4%) | 130 (11.2%) |
| High School Diploma | 1,458 (86.1%) | 93 (5.5%) |
| College / Associate Degree | 466 (73.4%) | 31 (4.9%) |
| Bachelor's Degree or higher | 405 (89.8%) | 24 (5.4%) |
| Total | 3,325 (84.3%) | 280 (7.1%) |
Employment Occupations by Sex in Park City
Management, Business, Science and Arts Occupations
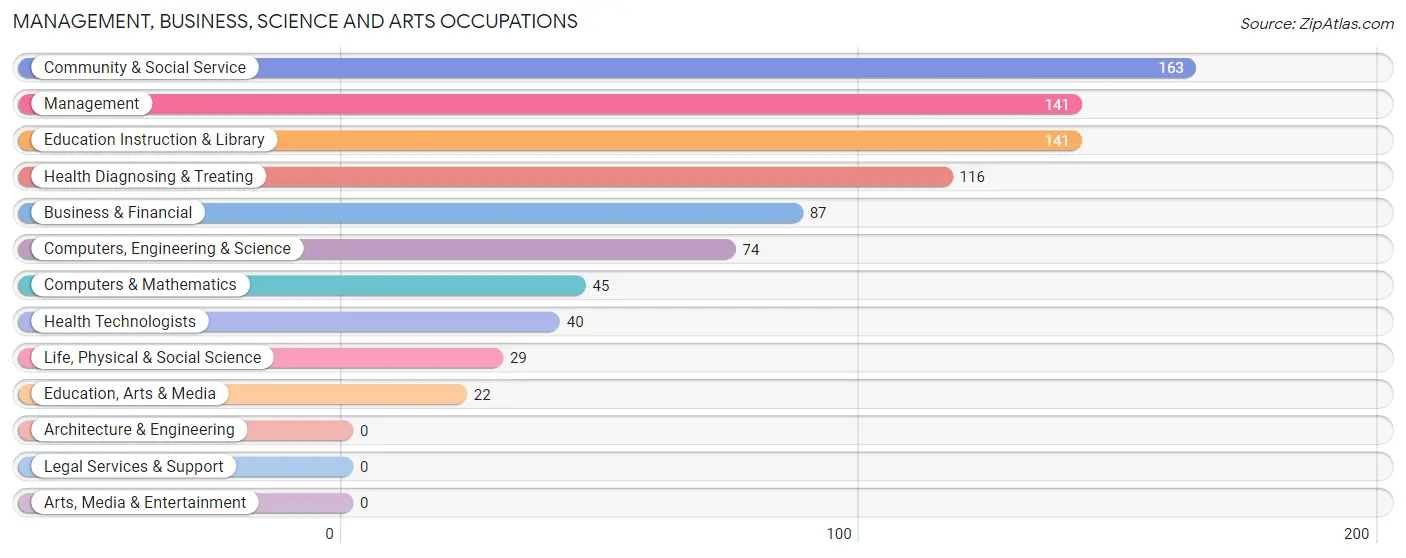
The most common Management, Business, Science and Arts occupations in Park City are Community & Social Service (163 | 4.1%), Management (141 | 3.5%), Education Instruction & Library (141 | 3.5%), Health Diagnosing & Treating (116 | 2.9%), and Business & Financial (87 | 2.2%).
Management, Business, Science and Arts Occupations by Sex
Within the Management, Business, Science and Arts occupations in Park City, the most male-oriented occupations are Life, Physical & Social Science (100.0%), Education, Arts & Media (100.0%), and Computers, Engineering & Science (87.8%), while the most female-oriented occupations are Health Technologists (100.0%), Education Instruction & Library (94.3%), and Health Diagnosing & Treating (84.5%).

| Occupation | Male | Female |
| Management | 76 (53.9%) | 65 (46.1%) |
| Business & Financial | 14 (16.1%) | 73 (83.9%) |
| Computers, Engineering & Science | 65 (87.8%) | 9 (12.2%) |
| Computers & Mathematics | 36 (80.0%) | 9 (20.0%) |
| Architecture & Engineering | 0 (0.0%) | 0 (0.0%) |
| Life, Physical & Social Science | 29 (100.0%) | 0 (0.0%) |
| Community & Social Service | 30 (18.4%) | 133 (81.6%) |
| Education, Arts & Media | 22 (100.0%) | 0 (0.0%) |
| Legal Services & Support | 0 (0.0%) | 0 (0.0%) |
| Education Instruction & Library | 8 (5.7%) | 133 (94.3%) |
| Arts, Media & Entertainment | 0 (0.0%) | 0 (0.0%) |
| Health Diagnosing & Treating | 18 (15.5%) | 98 (84.5%) |
| Health Technologists | 0 (0.0%) | 40 (100.0%) |
| Total (Category) | 203 (34.9%) | 378 (65.1%) |
| Total (Overall) | 1,984 (49.9%) | 1,990 (50.1%) |
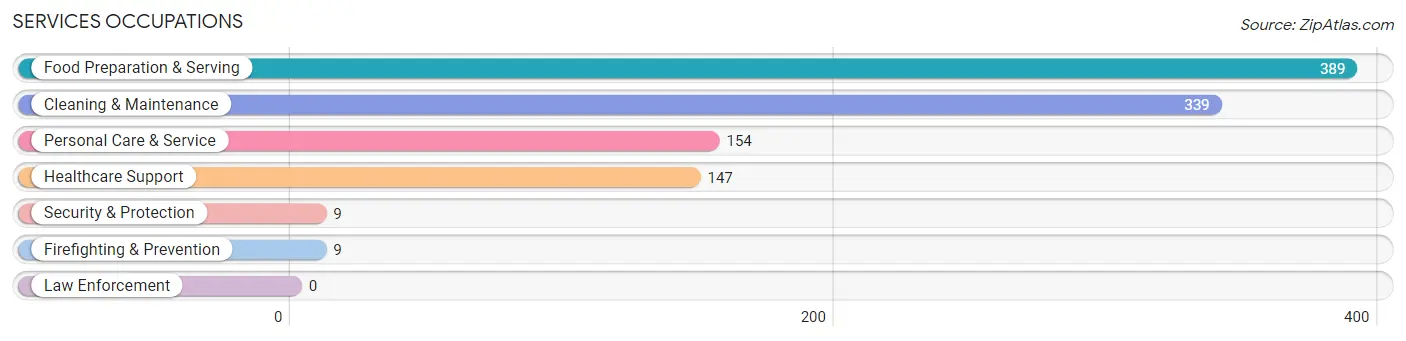
Services Occupations
The most common Services occupations in Park City are Food Preparation & Serving (389 | 9.8%), Cleaning & Maintenance (339 | 8.5%), Personal Care & Service (154 | 3.9%), Healthcare Support (147 | 3.7%), and Security & Protection (9 | 0.2%).
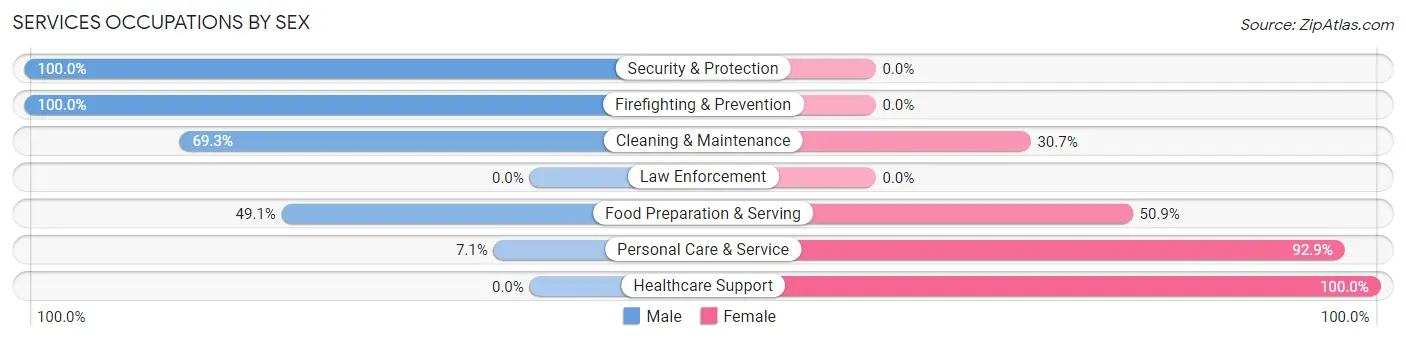
Services Occupations by Sex
Within the Services occupations in Park City, the most male-oriented occupations are Security & Protection (100.0%), Firefighting & Prevention (100.0%), and Cleaning & Maintenance (69.3%), while the most female-oriented occupations are Healthcare Support (100.0%), Personal Care & Service (92.9%), and Food Preparation & Serving (50.9%).
| Occupation | Male | Female |
| Healthcare Support | 0 (0.0%) | 147 (100.0%) |
| Security & Protection | 9 (100.0%) | 0 (0.0%) |
| Firefighting & Prevention | 9 (100.0%) | 0 (0.0%) |
| Law Enforcement | 0 (0.0%) | 0 (0.0%) |
| Food Preparation & Serving | 191 (49.1%) | 198 (50.9%) |
| Cleaning & Maintenance | 235 (69.3%) | 104 (30.7%) |
| Personal Care & Service | 11 (7.1%) | 143 (92.9%) |
| Total (Category) | 446 (43.0%) | 592 (57.0%) |
| Total (Overall) | 1,984 (49.9%) | 1,990 (50.1%) |
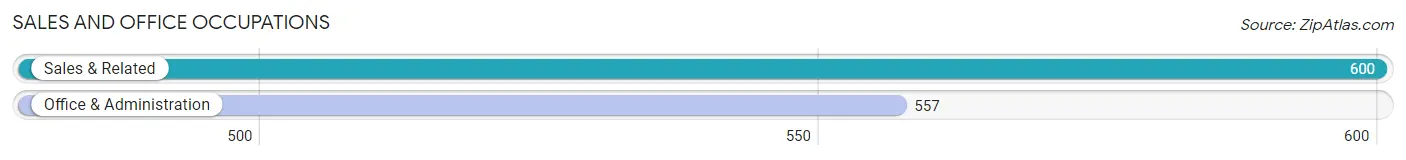
Sales and Office Occupations
The most common Sales and Office occupations in Park City are Sales & Related (600 | 15.1%), and Office & Administration (557 | 14.0%).
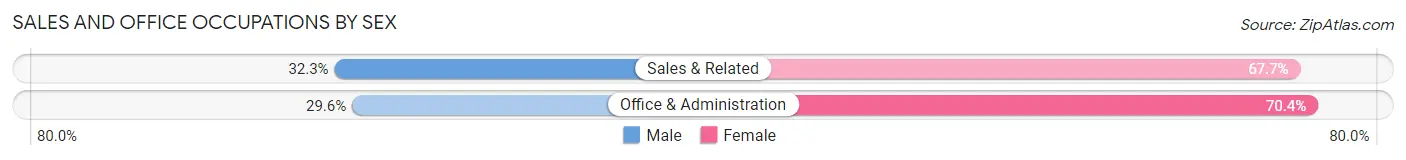
Sales and Office Occupations by Sex
| Occupation | Male | Female |
| Sales & Related | 194 (32.3%) | 406 (67.7%) |
| Office & Administration | 165 (29.6%) | 392 (70.4%) |
| Total (Category) | 359 (31.0%) | 798 (69.0%) |
| Total (Overall) | 1,984 (49.9%) | 1,990 (50.1%) |
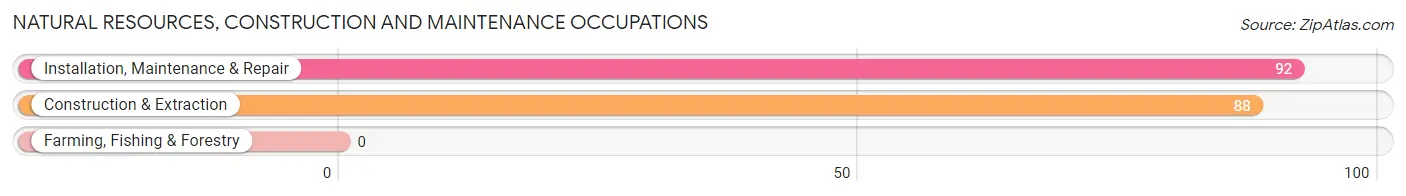
Natural Resources, Construction and Maintenance Occupations
The most common Natural Resources, Construction and Maintenance occupations in Park City are Installation, Maintenance & Repair (92 | 2.3%), and Construction & Extraction (88 | 2.2%).
Natural Resources, Construction and Maintenance Occupations by Sex
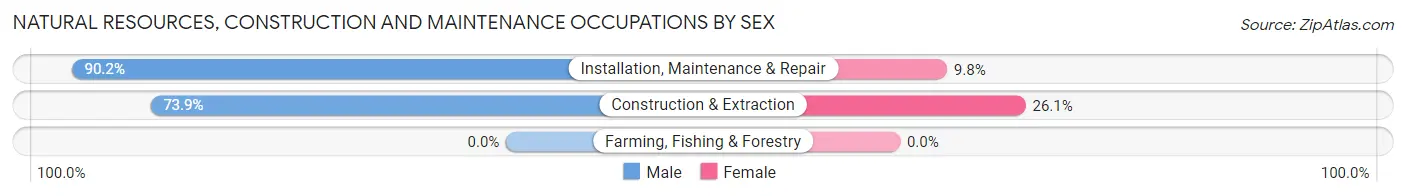
| Occupation | Male | Female |
| Farming, Fishing & Forestry | 0 (0.0%) | 0 (0.0%) |
| Construction & Extraction | 65 (73.9%) | 23 (26.1%) |
| Installation, Maintenance & Repair | 83 (90.2%) | 9 (9.8%) |
| Total (Category) | 148 (82.2%) | 32 (17.8%) |
| Total (Overall) | 1,984 (49.9%) | 1,990 (50.1%) |
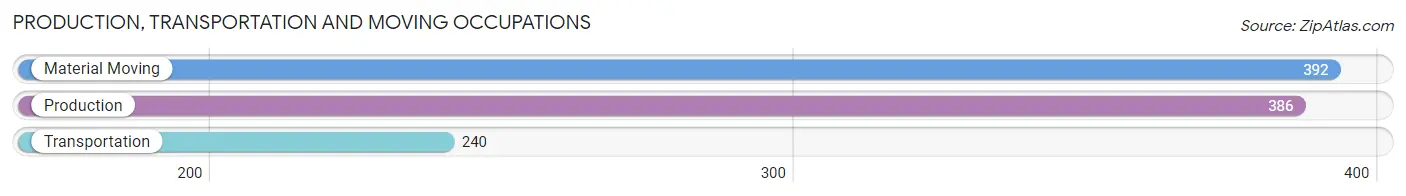
Production, Transportation and Moving Occupations
The most common Production, Transportation and Moving occupations in Park City are Material Moving (392 | 9.9%), Production (386 | 9.7%), and Transportation (240 | 6.0%).
Production, Transportation and Moving Occupations by Sex
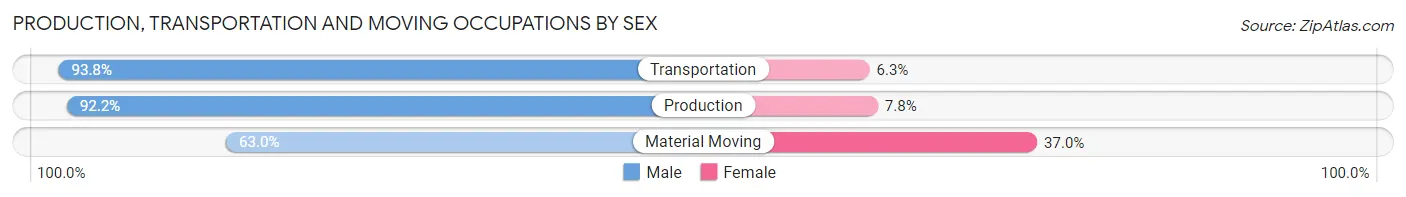
| Occupation | Male | Female |
| Production | 356 (92.2%) | 30 (7.8%) |
| Transportation | 225 (93.8%) | 15 (6.2%) |
| Material Moving | 247 (63.0%) | 145 (37.0%) |
| Total (Category) | 828 (81.3%) | 190 (18.7%) |
| Total (Overall) | 1,984 (49.9%) | 1,990 (50.1%) |
Employment Industries by Sex in Park City
Employment Industries in Park City
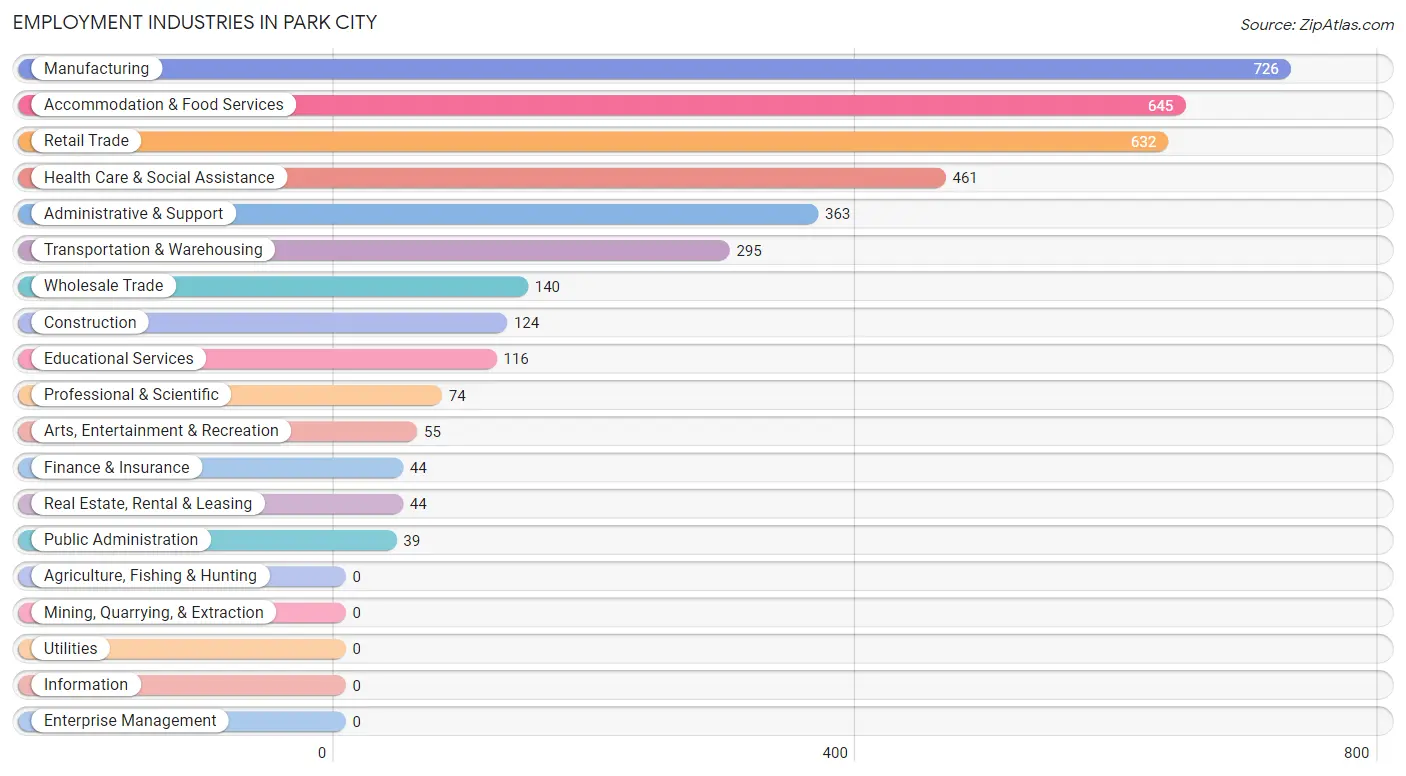
The major employment industries in Park City include Manufacturing (726 | 18.3%), Accommodation & Food Services (645 | 16.2%), Retail Trade (632 | 15.9%), Health Care & Social Assistance (461 | 11.6%), and Administrative & Support (363 | 9.1%).
Employment Industries by Sex in Park City
The Park City industries that see more men than women are Arts, Entertainment & Recreation (100.0%), Transportation & Warehousing (94.9%), and Construction (81.5%), whereas the industries that tend to have a higher number of women are Public Administration (100.0%), Health Care & Social Assistance (91.3%), and Educational Services (86.2%).
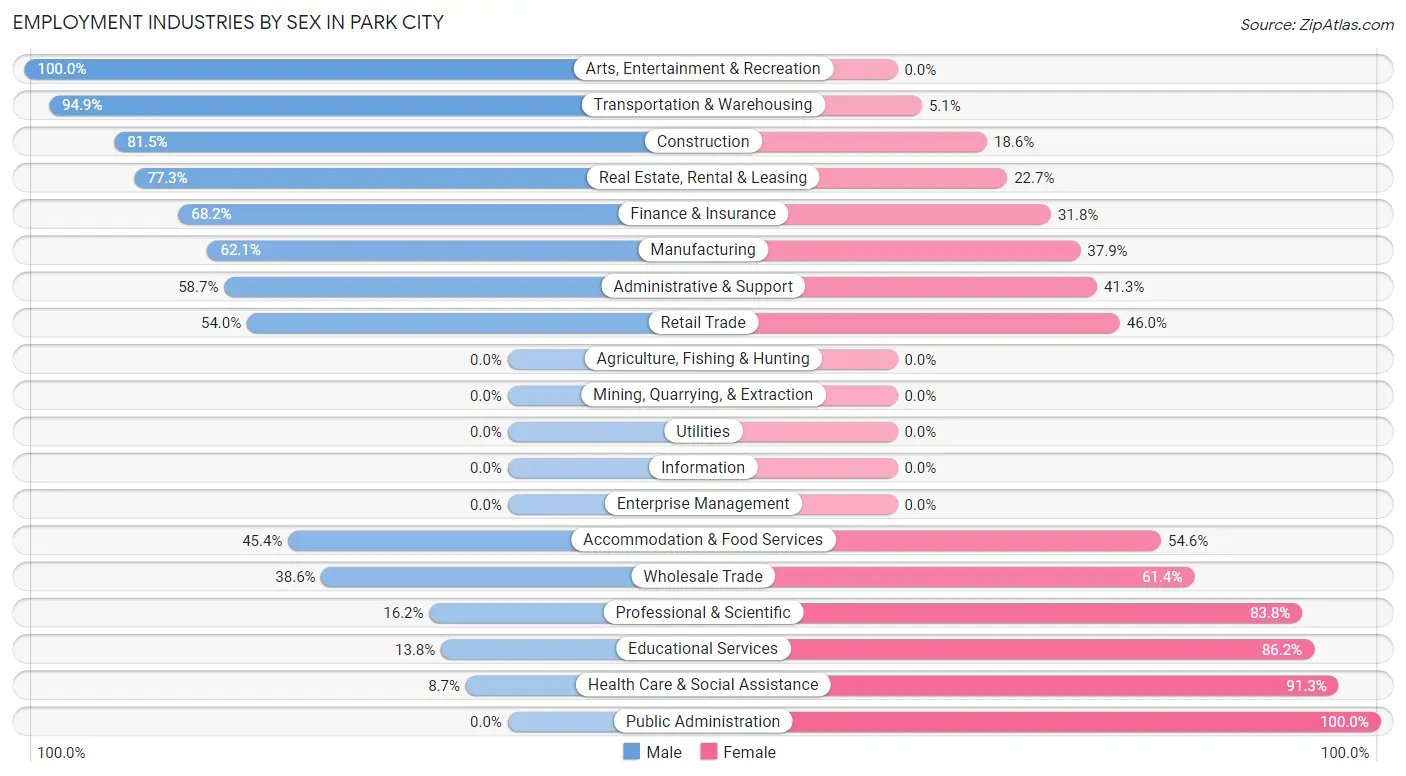
| Industry | Male | Female |
| Agriculture, Fishing & Hunting | 0 (0.0%) | 0 (0.0%) |
| Mining, Quarrying, & Extraction | 0 (0.0%) | 0 (0.0%) |
| Construction | 101 (81.5%) | 23 (18.5%) |
| Manufacturing | 451 (62.1%) | 275 (37.9%) |
| Wholesale Trade | 54 (38.6%) | 86 (61.4%) |
| Retail Trade | 341 (54.0%) | 291 (46.0%) |
| Transportation & Warehousing | 280 (94.9%) | 15 (5.1%) |
| Utilities | 0 (0.0%) | 0 (0.0%) |
| Information | 0 (0.0%) | 0 (0.0%) |
| Finance & Insurance | 30 (68.2%) | 14 (31.8%) |
| Real Estate, Rental & Leasing | 34 (77.3%) | 10 (22.7%) |
| Professional & Scientific | 12 (16.2%) | 62 (83.8%) |
| Enterprise Management | 0 (0.0%) | 0 (0.0%) |
| Administrative & Support | 213 (58.7%) | 150 (41.3%) |
| Educational Services | 16 (13.8%) | 100 (86.2%) |
| Health Care & Social Assistance | 40 (8.7%) | 421 (91.3%) |
| Arts, Entertainment & Recreation | 55 (100.0%) | 0 (0.0%) |
| Accommodation & Food Services | 293 (45.4%) | 352 (54.6%) |
| Public Administration | 0 (0.0%) | 39 (100.0%) |
| Total | 1,984 (49.9%) | 1,990 (50.1%) |
Education in Park City
School Enrollment in Park City
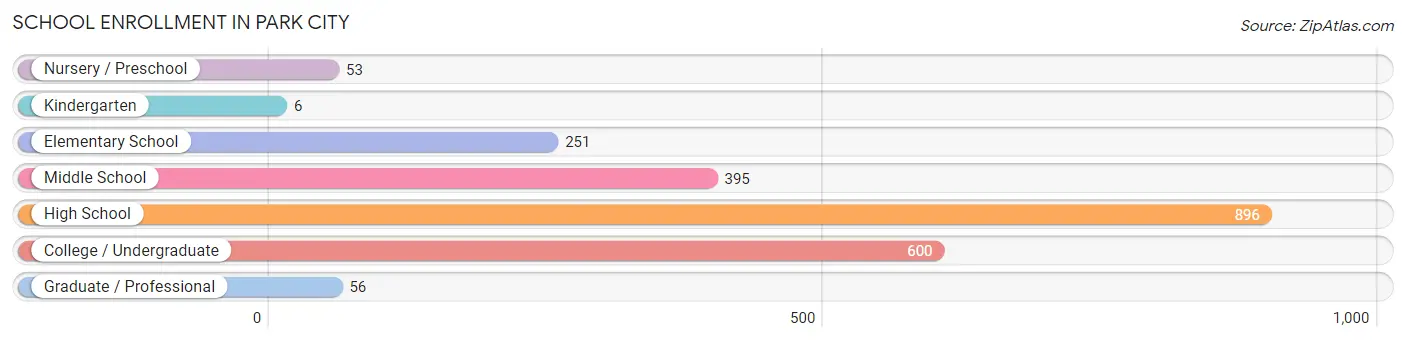
The most common levels of schooling among the 2,257 students in Park City are high school (896 | 39.7%), college / undergraduate (600 | 26.6%), and middle school (395 | 17.5%).
| School Level | # Students | % Students |
| Nursery / Preschool | 53 | 2.4% |
| Kindergarten | 6 | 0.3% |
| Elementary School | 251 | 11.1% |
| Middle School | 395 | 17.5% |
| High School | 896 | 39.7% |
| College / Undergraduate | 600 | 26.6% |
| Graduate / Professional | 56 | 2.5% |
| Total | 2,257 | 100.0% |
School Enrollment by Age by Funding Source in Park City
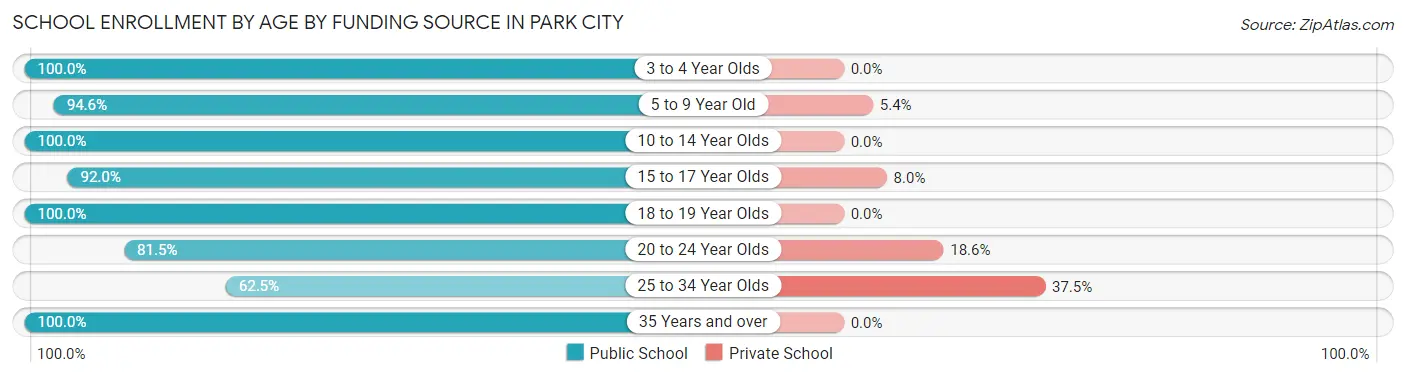
Out of a total of 2,257 students who are enrolled in schools in Park City, 167 (7.4%) attend a private institution, while the remaining 2,090 (92.6%) are enrolled in public schools. The age group of 25 to 34 year olds has the highest likelihood of being enrolled in private schools, with 33 (37.5% in the age bracket) enrolled. Conversely, the age group of 3 to 4 year olds has the lowest likelihood of being enrolled in a private school, with 31 (100.0% in the age bracket) attending a public institution.
| Age Bracket | Public School | Private School |
| 3 to 4 Year Olds | 31 (100.0%) | 0 (0.0%) |
| 5 to 9 Year Old | 226 (94.6%) | 13 (5.4%) |
| 10 to 14 Year Olds | 596 (100.0%) | 0 (0.0%) |
| 15 to 17 Year Olds | 540 (92.0%) | 47 (8.0%) |
| 18 to 19 Year Olds | 284 (100.0%) | 0 (0.0%) |
| 20 to 24 Year Olds | 325 (81.5%) | 74 (18.5%) |
| 25 to 34 Year Olds | 55 (62.5%) | 33 (37.5%) |
| 35 Years and over | 33 (100.0%) | 0 (0.0%) |
| Total | 2,090 (92.6%) | 167 (7.4%) |
Educational Attainment by Field of Study in Park City
Science & technology (117 | 21.3%), business (112 | 20.4%), computers & mathematics (99 | 18.0%), education (73 | 13.3%), and bio, nature & agricultural (41 | 7.5%) are the most common fields of study among 549 individuals in Park City who have obtained a bachelor's degree or higher.
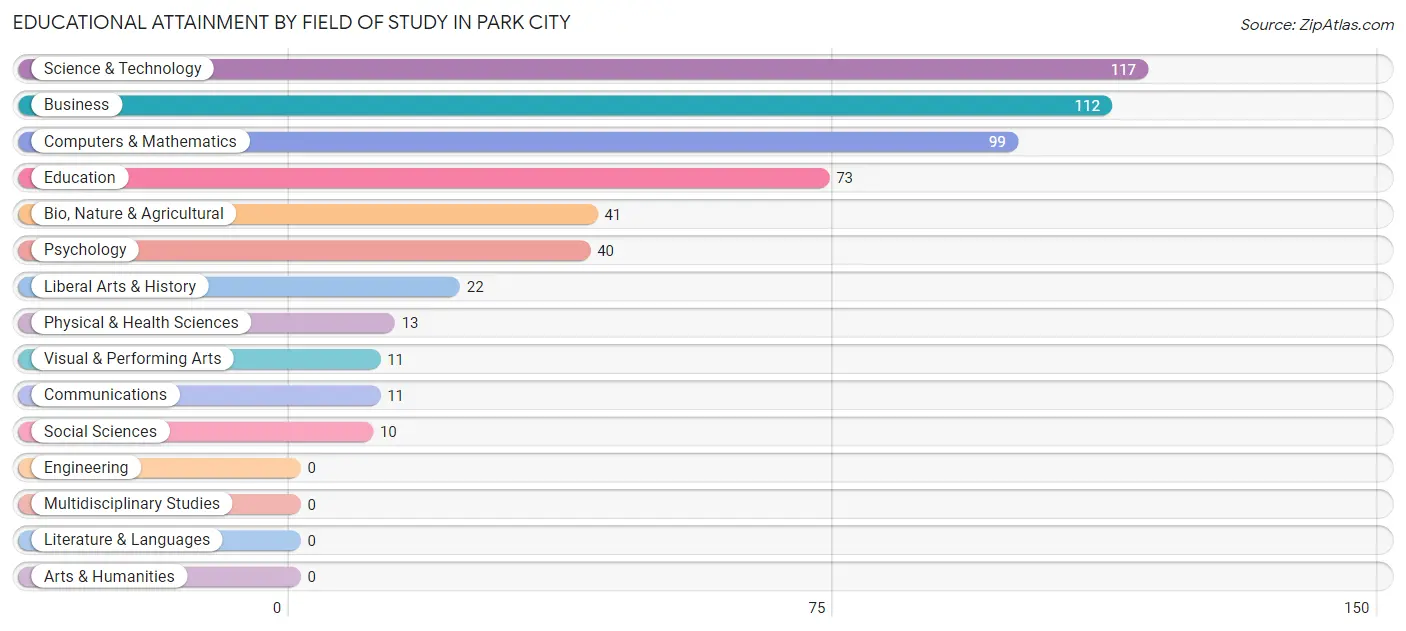
| Field of Study | # Graduates | % Graduates |
| Computers & Mathematics | 99 | 18.0% |
| Bio, Nature & Agricultural | 41 | 7.5% |
| Physical & Health Sciences | 13 | 2.4% |
| Psychology | 40 | 7.3% |
| Social Sciences | 10 | 1.8% |
| Engineering | 0 | 0.0% |
| Multidisciplinary Studies | 0 | 0.0% |
| Science & Technology | 117 | 21.3% |
| Business | 112 | 20.4% |
| Education | 73 | 13.3% |
| Literature & Languages | 0 | 0.0% |
| Liberal Arts & History | 22 | 4.0% |
| Visual & Performing Arts | 11 | 2.0% |
| Communications | 11 | 2.0% |
| Arts & Humanities | 0 | 0.0% |
| Total | 549 | 100.0% |
Transportation & Commute in Park City
Vehicle Availability by Sex in Park City
The most prevalent vehicle ownership categories in Park City are males with 3 vehicles (869, accounting for 43.6%) and females with 3 vehicles (627, making up 46.3%).
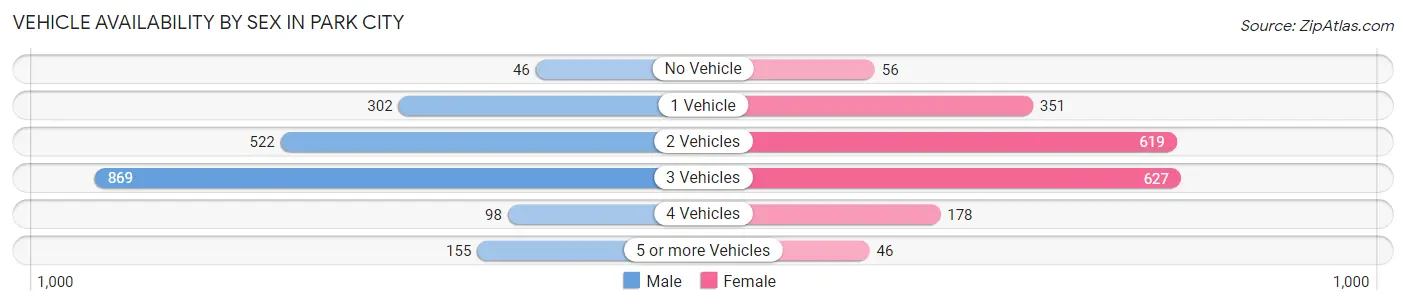
| Vehicles Available | Male | Female |
| No Vehicle | 46 (2.3%) | 56 (3.0%) |
| 1 Vehicle | 302 (15.2%) | 351 (18.7%) |
| 2 Vehicles | 522 (26.2%) | 619 (33.0%) |
| 3 Vehicles | 869 (43.6%) | 627 (33.4%) |
| 4 Vehicles | 98 (4.9%) | 178 (9.5%) |
| 5 or more Vehicles | 155 (7.8%) | 46 (2.5%) |
| Total | 1,992 (100.0%) | 1,877 (100.0%) |
Commute Time in Park City
The most frequently occuring commute durations in Park City are 20 to 24 minutes (632 commuters, 16.8%), 10 to 14 minutes (500 commuters, 13.3%), and 15 to 19 minutes (492 commuters, 13.0%).
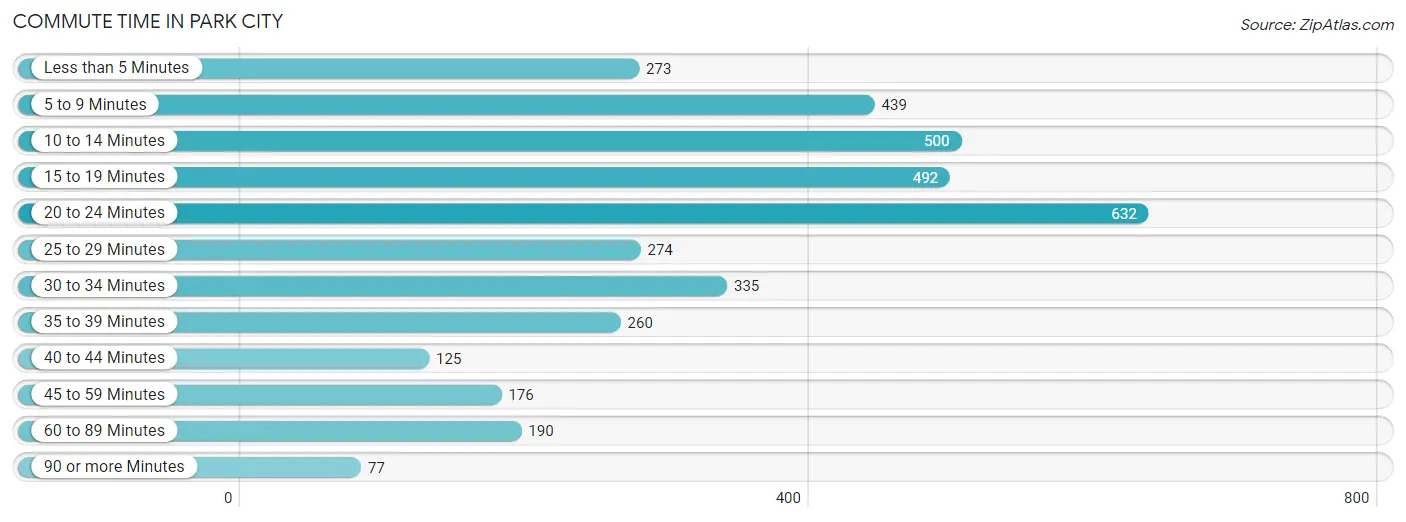
| Commute Time | # Commuters | % Commuters |
| Less than 5 Minutes | 273 | 7.2% |
| 5 to 9 Minutes | 439 | 11.6% |
| 10 to 14 Minutes | 500 | 13.3% |
| 15 to 19 Minutes | 492 | 13.0% |
| 20 to 24 Minutes | 632 | 16.8% |
| 25 to 29 Minutes | 274 | 7.3% |
| 30 to 34 Minutes | 335 | 8.9% |
| 35 to 39 Minutes | 260 | 6.9% |
| 40 to 44 Minutes | 125 | 3.3% |
| 45 to 59 Minutes | 176 | 4.7% |
| 60 to 89 Minutes | 190 | 5.0% |
| 90 or more Minutes | 77 | 2.0% |
Commute Time by Sex in Park City
The most common commute times in Park City are 10 to 14 minutes (318 commuters, 16.1%) for males and 20 to 24 minutes (403 commuters, 22.4%) for females.
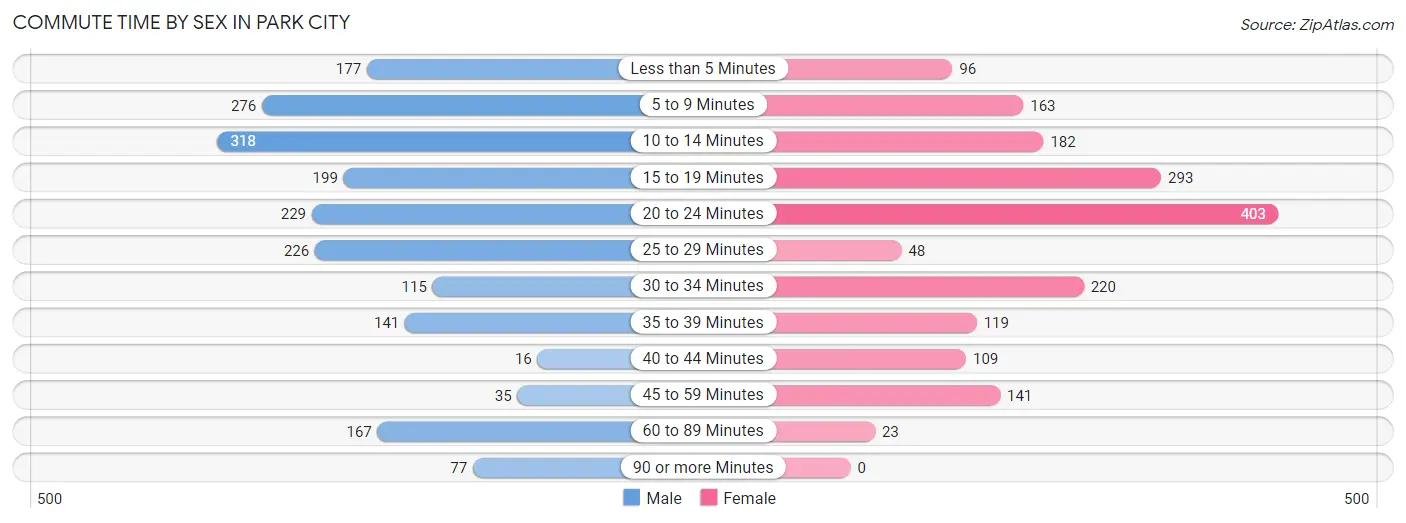
| Commute Time | Male | Female |
| Less than 5 Minutes | 177 (9.0%) | 96 (5.3%) |
| 5 to 9 Minutes | 276 (14.0%) | 163 (9.1%) |
| 10 to 14 Minutes | 318 (16.1%) | 182 (10.1%) |
| 15 to 19 Minutes | 199 (10.1%) | 293 (16.3%) |
| 20 to 24 Minutes | 229 (11.6%) | 403 (22.4%) |
| 25 to 29 Minutes | 226 (11.4%) | 48 (2.7%) |
| 30 to 34 Minutes | 115 (5.8%) | 220 (12.2%) |
| 35 to 39 Minutes | 141 (7.1%) | 119 (6.6%) |
| 40 to 44 Minutes | 16 (0.8%) | 109 (6.1%) |
| 45 to 59 Minutes | 35 (1.8%) | 141 (7.9%) |
| 60 to 89 Minutes | 167 (8.5%) | 23 (1.3%) |
| 90 or more Minutes | 77 (3.9%) | 0 (0.0%) |
Time of Departure to Work by Sex in Park City
The most frequent times of departure to work in Park City are 6:00 AM to 6:29 AM (551, 27.9%) for males and 7:00 AM to 7:29 AM (336, 18.7%) for females.
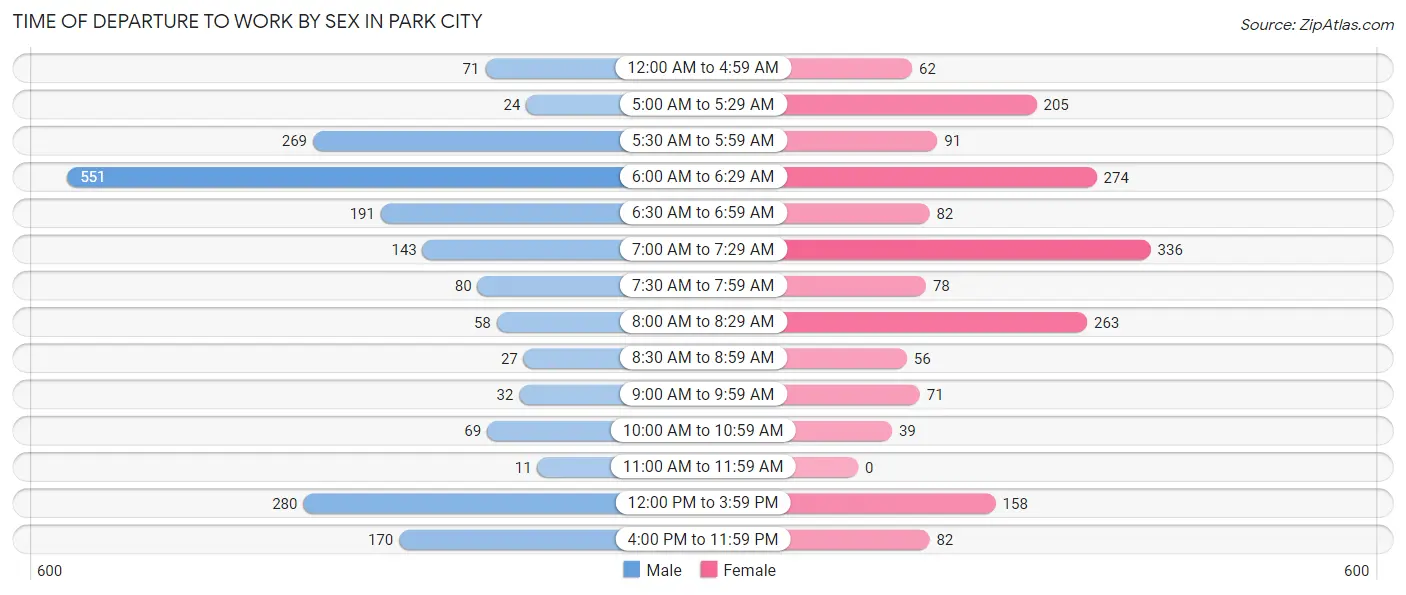
| Time of Departure | Male | Female |
| 12:00 AM to 4:59 AM | 71 (3.6%) | 62 (3.5%) |
| 5:00 AM to 5:29 AM | 24 (1.2%) | 205 (11.4%) |
| 5:30 AM to 5:59 AM | 269 (13.6%) | 91 (5.1%) |
| 6:00 AM to 6:29 AM | 551 (27.9%) | 274 (15.2%) |
| 6:30 AM to 6:59 AM | 191 (9.7%) | 82 (4.6%) |
| 7:00 AM to 7:29 AM | 143 (7.2%) | 336 (18.7%) |
| 7:30 AM to 7:59 AM | 80 (4.1%) | 78 (4.3%) |
| 8:00 AM to 8:29 AM | 58 (2.9%) | 263 (14.6%) |
| 8:30 AM to 8:59 AM | 27 (1.4%) | 56 (3.1%) |
| 9:00 AM to 9:59 AM | 32 (1.6%) | 71 (4.0%) |
| 10:00 AM to 10:59 AM | 69 (3.5%) | 39 (2.2%) |
| 11:00 AM to 11:59 AM | 11 (0.6%) | 0 (0.0%) |
| 12:00 PM to 3:59 PM | 280 (14.2%) | 158 (8.8%) |
| 4:00 PM to 11:59 PM | 170 (8.6%) | 82 (4.6%) |
| Total | 1,976 (100.0%) | 1,797 (100.0%) |
Housing Occupancy in Park City
Occupancy by Ownership in Park City
Of the total 2,551 dwellings in Park City, owner-occupied units account for 1,384 (54.2%), while renter-occupied units make up 1,167 (45.8%).
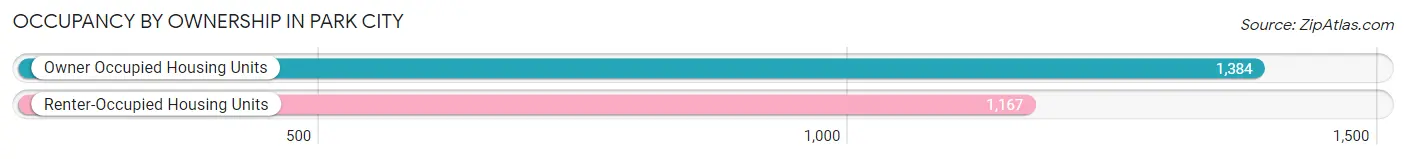
| Occupancy | # Housing Units | % Housing Units |
| Owner Occupied Housing Units | 1,384 | 54.2% |
| Renter-Occupied Housing Units | 1,167 | 45.8% |
| Total Occupied Housing Units | 2,551 | 100.0% |
Occupancy by Household Size in Park City

| Household Size | # Housing Units | % Housing Units |
| 1-Person Household | 547 | 21.4% |
| 2-Person Household | 739 | 29.0% |
| 3-Person Household | 414 | 16.2% |
| 4+ Person Household | 851 | 33.4% |
| Total Housing Units | 2,551 | 100.0% |
Occupancy by Ownership by Household Size in Park City
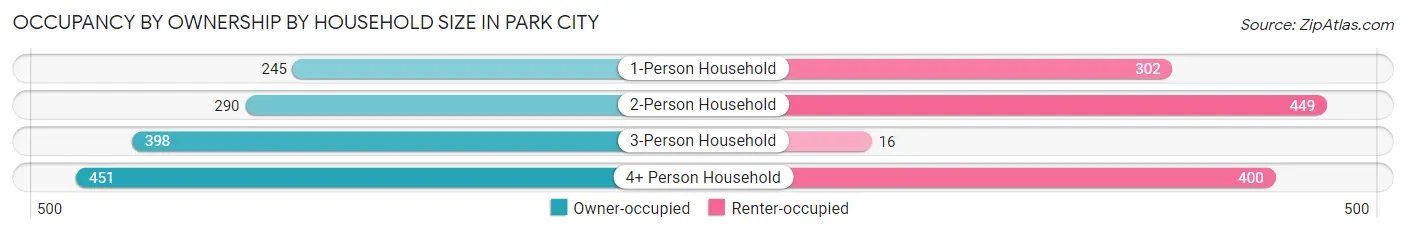
| Household Size | Owner-occupied | Renter-occupied |
| 1-Person Household | 245 (44.8%) | 302 (55.2%) |
| 2-Person Household | 290 (39.2%) | 449 (60.8%) |
| 3-Person Household | 398 (96.1%) | 16 (3.9%) |
| 4+ Person Household | 451 (53.0%) | 400 (47.0%) |
| Total Housing Units | 1,384 (54.2%) | 1,167 (45.8%) |
Occupancy by Educational Attainment in Park City
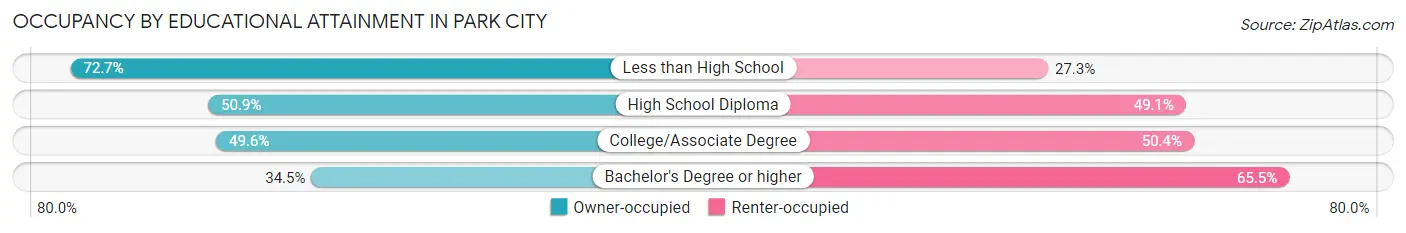
| Household Size | Owner-occupied | Renter-occupied |
| Less than High School | 451 (72.7%) | 169 (27.3%) |
| High School Diploma | 517 (50.9%) | 499 (49.1%) |
| College/Associate Degree | 329 (49.6%) | 334 (50.4%) |
| Bachelor's Degree or higher | 87 (34.5%) | 165 (65.5%) |
Occupancy by Age of Householder in Park City
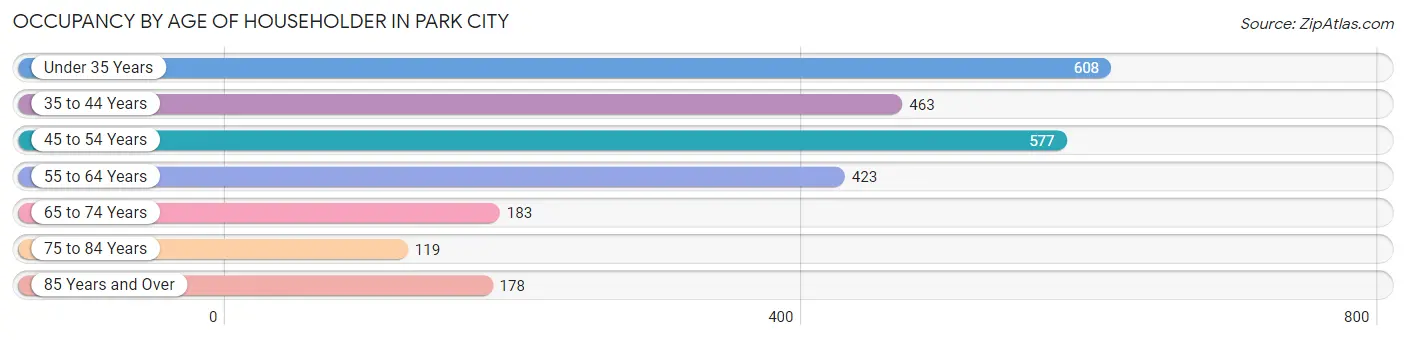
| Age Bracket | # Households | % Households |
| Under 35 Years | 608 | 23.8% |
| 35 to 44 Years | 463 | 18.1% |
| 45 to 54 Years | 577 | 22.6% |
| 55 to 64 Years | 423 | 16.6% |
| 65 to 74 Years | 183 | 7.2% |
| 75 to 84 Years | 119 | 4.7% |
| 85 Years and Over | 178 | 7.0% |
| Total | 2,551 | 100.0% |
Housing Finances in Park City
Median Income by Occupancy in Park City
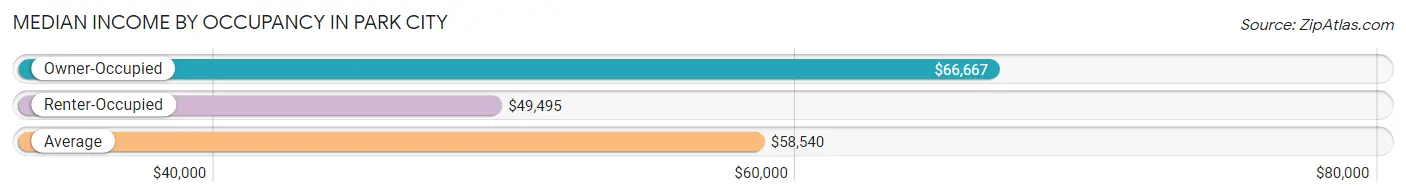
| Occupancy Type | # Households | Median Income |
| Owner-Occupied | 1,384 (54.2%) | $66,667 |
| Renter-Occupied | 1,167 (45.8%) | $49,495 |
| Average | 2,551 (100.0%) | $58,540 |
Occupancy by Householder Income Bracket in Park City
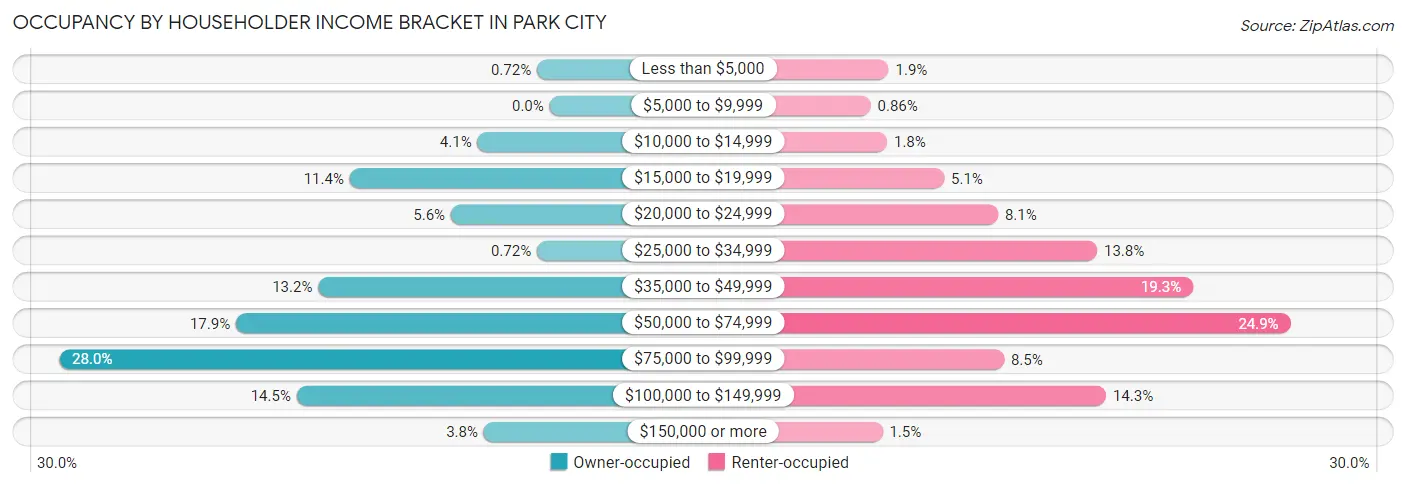
| Income Bracket | Owner-occupied | Renter-occupied |
| Less than $5,000 | 10 (0.7%) | 22 (1.9%) |
| $5,000 to $9,999 | 0 (0.0%) | 10 (0.9%) |
| $10,000 to $14,999 | 57 (4.1%) | 21 (1.8%) |
| $15,000 to $19,999 | 158 (11.4%) | 59 (5.1%) |
| $20,000 to $24,999 | 78 (5.6%) | 95 (8.1%) |
| $25,000 to $34,999 | 10 (0.7%) | 161 (13.8%) |
| $35,000 to $49,999 | 183 (13.2%) | 225 (19.3%) |
| $50,000 to $74,999 | 248 (17.9%) | 290 (24.8%) |
| $75,000 to $99,999 | 388 (28.0%) | 99 (8.5%) |
| $100,000 to $149,999 | 200 (14.4%) | 167 (14.3%) |
| $150,000 or more | 52 (3.8%) | 18 (1.5%) |
| Total | 1,384 (100.0%) | 1,167 (100.0%) |
Monthly Housing Cost Tiers in Park City
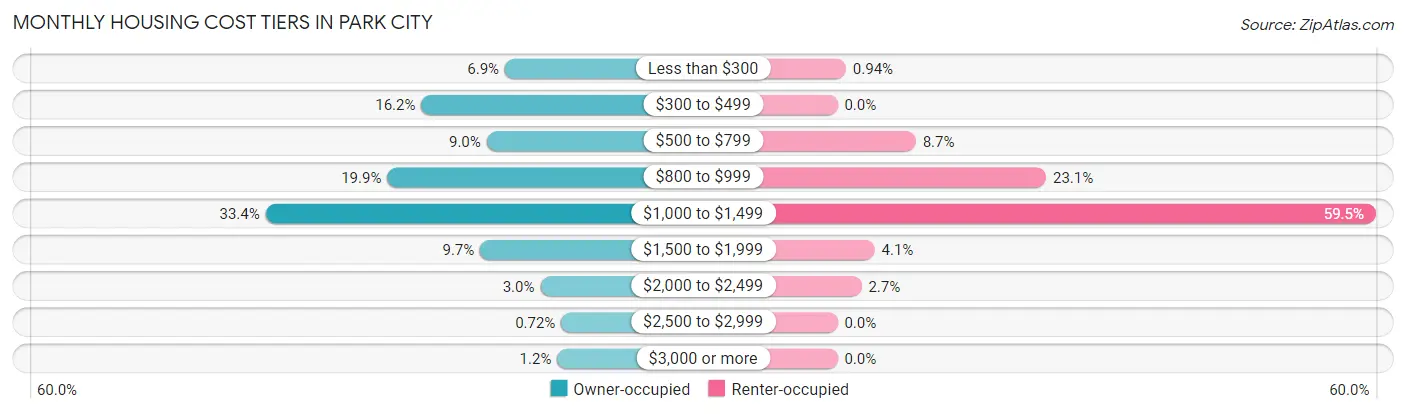
| Monthly Cost | Owner-occupied | Renter-occupied |
| Less than $300 | 96 (6.9%) | 11 (0.9%) |
| $300 to $499 | 224 (16.2%) | 0 (0.0%) |
| $500 to $799 | 124 (9.0%) | 101 (8.6%) |
| $800 to $999 | 276 (19.9%) | 269 (23.1%) |
| $1,000 to $1,499 | 462 (33.4%) | 694 (59.5%) |
| $1,500 to $1,999 | 134 (9.7%) | 48 (4.1%) |
| $2,000 to $2,499 | 42 (3.0%) | 31 (2.7%) |
| $2,500 to $2,999 | 10 (0.7%) | 0 (0.0%) |
| $3,000 or more | 16 (1.2%) | 0 (0.0%) |
| Total | 1,384 (100.0%) | 1,167 (100.0%) |
Physical Housing Characteristics in Park City
Housing Structures in Park City
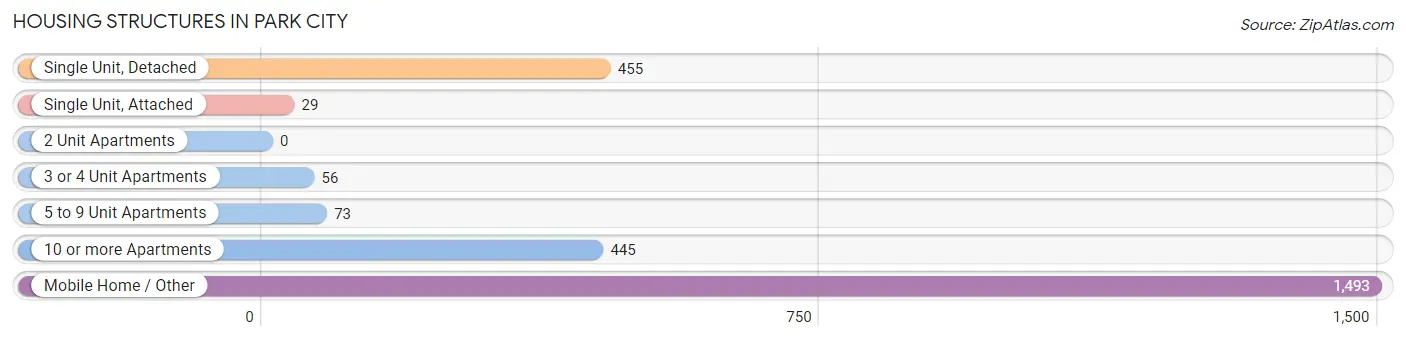
| Structure Type | # Housing Units | % Housing Units |
| Single Unit, Detached | 455 | 17.8% |
| Single Unit, Attached | 29 | 1.1% |
| 2 Unit Apartments | 0 | 0.0% |
| 3 or 4 Unit Apartments | 56 | 2.2% |
| 5 to 9 Unit Apartments | 73 | 2.9% |
| 10 or more Apartments | 445 | 17.4% |
| Mobile Home / Other | 1,493 | 58.5% |
| Total | 2,551 | 100.0% |
Housing Structures by Occupancy in Park City
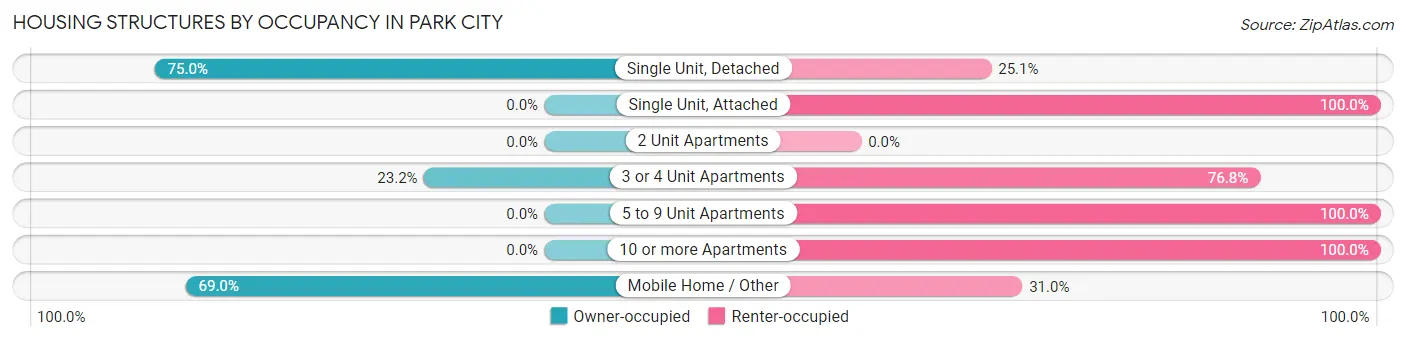
| Structure Type | Owner-occupied | Renter-occupied |
| Single Unit, Detached | 341 (75.0%) | 114 (25.1%) |
| Single Unit, Attached | 0 (0.0%) | 29 (100.0%) |
| 2 Unit Apartments | 0 (0.0%) | 0 (0.0%) |
| 3 or 4 Unit Apartments | 13 (23.2%) | 43 (76.8%) |
| 5 to 9 Unit Apartments | 0 (0.0%) | 73 (100.0%) |
| 10 or more Apartments | 0 (0.0%) | 445 (100.0%) |
| Mobile Home / Other | 1,030 (69.0%) | 463 (31.0%) |
| Total | 1,384 (54.2%) | 1,167 (45.8%) |
Housing Structures by Number of Rooms in Park City
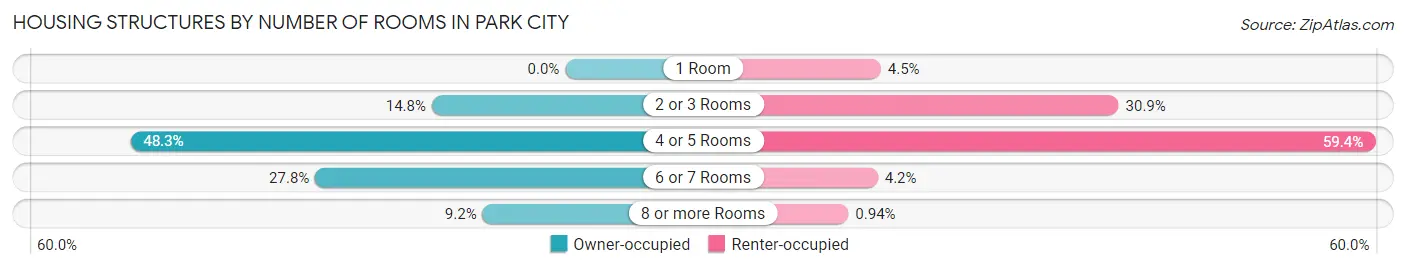
| Number of Rooms | Owner-occupied | Renter-occupied |
| 1 Room | 0 (0.0%) | 53 (4.5%) |
| 2 or 3 Rooms | 205 (14.8%) | 361 (30.9%) |
| 4 or 5 Rooms | 668 (48.3%) | 693 (59.4%) |
| 6 or 7 Rooms | 384 (27.8%) | 49 (4.2%) |
| 8 or more Rooms | 127 (9.2%) | 11 (0.9%) |
| Total | 1,384 (100.0%) | 1,167 (100.0%) |
Housing Structure by Heating Type in Park City
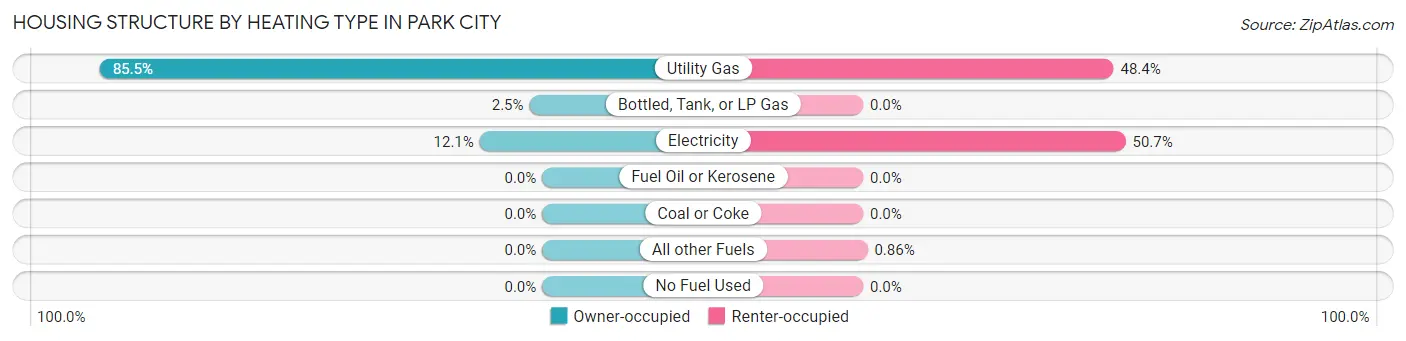
| Heating Type | Owner-occupied | Renter-occupied |
| Utility Gas | 1,183 (85.5%) | 565 (48.4%) |
| Bottled, Tank, or LP Gas | 34 (2.5%) | 0 (0.0%) |
| Electricity | 167 (12.1%) | 592 (50.7%) |
| Fuel Oil or Kerosene | 0 (0.0%) | 0 (0.0%) |
| Coal or Coke | 0 (0.0%) | 0 (0.0%) |
| All other Fuels | 0 (0.0%) | 10 (0.9%) |
| No Fuel Used | 0 (0.0%) | 0 (0.0%) |
| Total | 1,384 (100.0%) | 1,167 (100.0%) |
Household Vehicle Usage in Park City
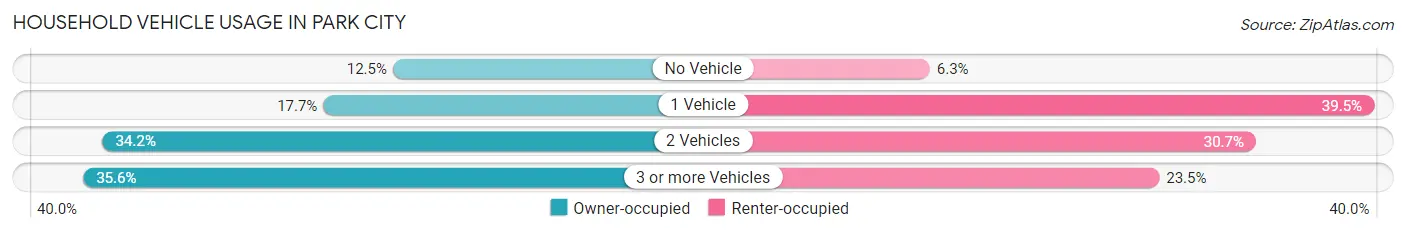
| Vehicles per Household | Owner-occupied | Renter-occupied |
| No Vehicle | 173 (12.5%) | 74 (6.3%) |
| 1 Vehicle | 245 (17.7%) | 461 (39.5%) |
| 2 Vehicles | 473 (34.2%) | 358 (30.7%) |
| 3 or more Vehicles | 493 (35.6%) | 274 (23.5%) |
| Total | 1,384 (100.0%) | 1,167 (100.0%) |
Real Estate & Mortgages in Park City
Real Estate and Mortgage Overview in Park City
| Characteristic | Without Mortgage | With Mortgage |
| Housing Units | 999 | 385 |
| Median Property Value | $23,600 | $0 |
| Median Household Income | $57,932 | $52 |
| Monthly Housing Costs | $936 | $16 |
| Real Estate Taxes | $199 | $24 |
Property Value by Mortgage Status in Park City

| Property Value | Without Mortgage | With Mortgage |
| Less than $50,000 | 594 (59.5%) | 212 (55.1%) |
| $50,000 to $99,999 | 238 (23.8%) | 0 (0.0%) |
| $100,000 to $299,999 | 151 (15.1%) | 145 (37.7%) |
| $300,000 to $499,999 | 16 (1.6%) | 28 (7.3%) |
| $500,000 to $749,999 | 0 (0.0%) | 0 (0.0%) |
| $750,000 to $999,999 | 0 (0.0%) | 0 (0.0%) |
| $1,000,000 or more | 0 (0.0%) | 0 (0.0%) |
| Total | 999 (100.0%) | 385 (100.0%) |
Household Income by Mortgage Status in Park City
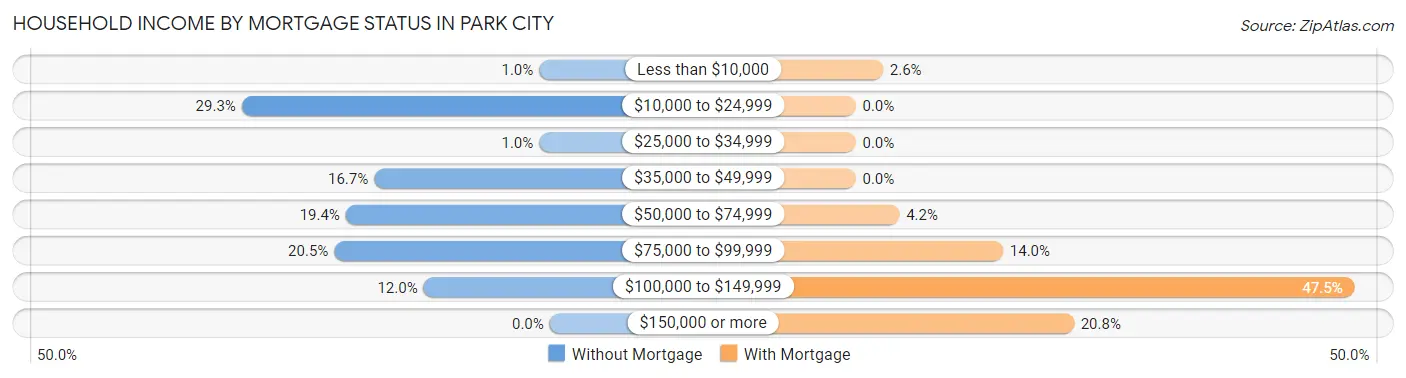
| Household Income | Without Mortgage | With Mortgage |
| Less than $10,000 | 10 (1.0%) | 10 (2.6%) |
| $10,000 to $24,999 | 293 (29.3%) | 0 (0.0%) |
| $25,000 to $34,999 | 10 (1.0%) | 0 (0.0%) |
| $35,000 to $49,999 | 167 (16.7%) | 0 (0.0%) |
| $50,000 to $74,999 | 194 (19.4%) | 16 (4.2%) |
| $75,000 to $99,999 | 205 (20.5%) | 54 (14.0%) |
| $100,000 to $149,999 | 120 (12.0%) | 183 (47.5%) |
| $150,000 or more | 0 (0.0%) | 80 (20.8%) |
| Total | 999 (100.0%) | 385 (100.0%) |
Property Value to Household Income Ratio in Park City
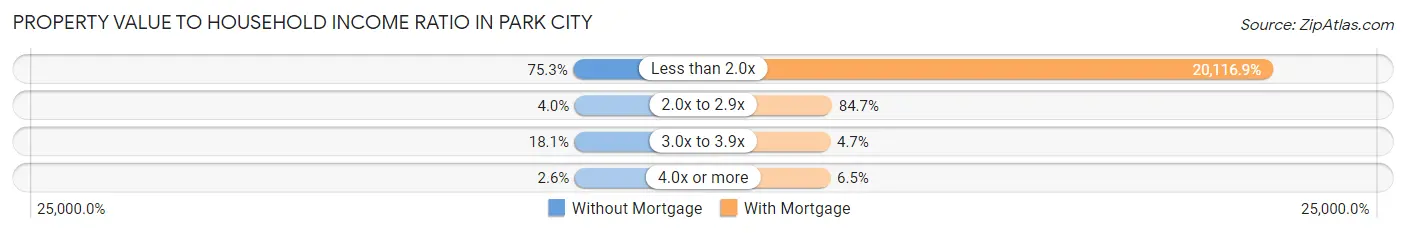
| Value-to-Income Ratio | Without Mortgage | With Mortgage |
| Less than 2.0x | 752 (75.3%) | 77,450 (20,116.9%) |
| 2.0x to 2.9x | 40 (4.0%) | 326 (84.7%) |
| 3.0x to 3.9x | 181 (18.1%) | 18 (4.7%) |
| 4.0x or more | 26 (2.6%) | 25 (6.5%) |
| Total | 999 (100.0%) | 385 (100.0%) |
Real Estate Taxes by Mortgage Status in Park City
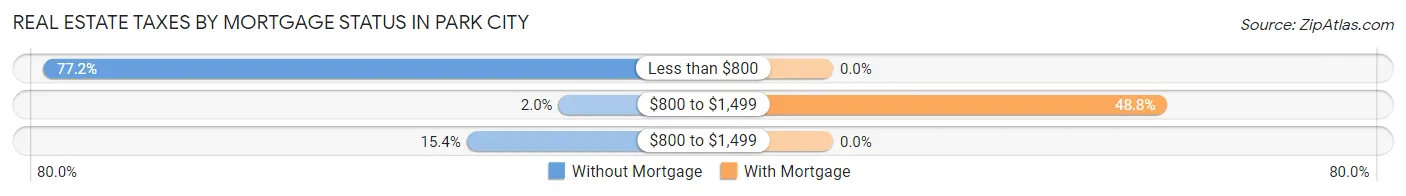
| Property Taxes | Without Mortgage | With Mortgage |
| Less than $800 | 771 (77.2%) | 0 (0.0%) |
| $800 to $1,499 | 20 (2.0%) | 188 (48.8%) |
| $800 to $1,499 | 154 (15.4%) | 0 (0.0%) |
| Total | 999 (100.0%) | 385 (100.0%) |
Health & Disability in Park City
Health Insurance Coverage by Age in Park City
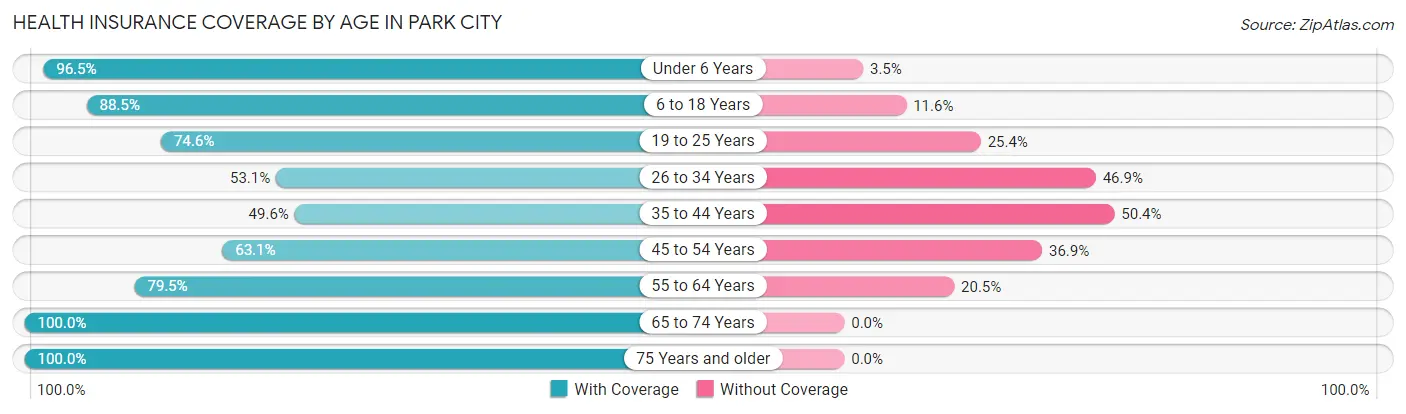
| Age Bracket | With Coverage | Without Coverage |
| Under 6 Years | 526 (96.5%) | 19 (3.5%) |
| 6 to 18 Years | 1,478 (88.4%) | 193 (11.6%) |
| 19 to 25 Years | 806 (74.6%) | 275 (25.4%) |
| 26 to 34 Years | 470 (53.1%) | 415 (46.9%) |
| 35 to 44 Years | 554 (49.6%) | 562 (50.4%) |
| 45 to 54 Years | 594 (63.1%) | 347 (36.9%) |
| 55 to 64 Years | 563 (79.5%) | 145 (20.5%) |
| 65 to 74 Years | 334 (100.0%) | 0 (0.0%) |
| 75 Years and older | 384 (100.0%) | 0 (0.0%) |
| Total | 5,709 (74.5%) | 1,956 (25.5%) |
Health Insurance Coverage by Citizenship Status in Park City
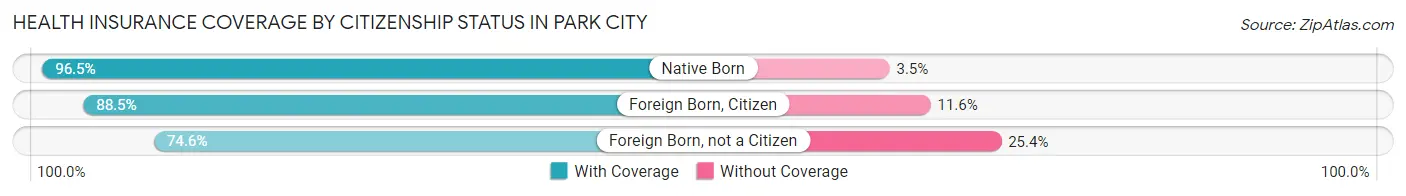
| Citizenship Status | With Coverage | Without Coverage |
| Native Born | 526 (96.5%) | 19 (3.5%) |
| Foreign Born, Citizen | 1,478 (88.4%) | 193 (11.6%) |
| Foreign Born, not a Citizen | 806 (74.6%) | 275 (25.4%) |
Health Insurance Coverage by Household Income in Park City
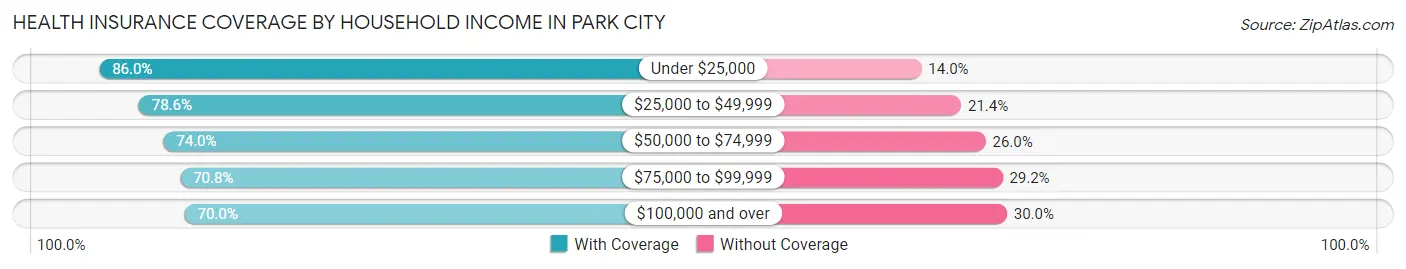
| Household Income | With Coverage | Without Coverage |
| Under $25,000 | 763 (86.0%) | 124 (14.0%) |
| $25,000 to $49,999 | 1,024 (78.6%) | 279 (21.4%) |
| $50,000 to $74,999 | 1,363 (74.0%) | 479 (26.0%) |
| $75,000 to $99,999 | 1,295 (70.8%) | 533 (29.2%) |
| $100,000 and over | 1,264 (70.0%) | 541 (30.0%) |
Public vs Private Health Insurance Coverage by Age in Park City
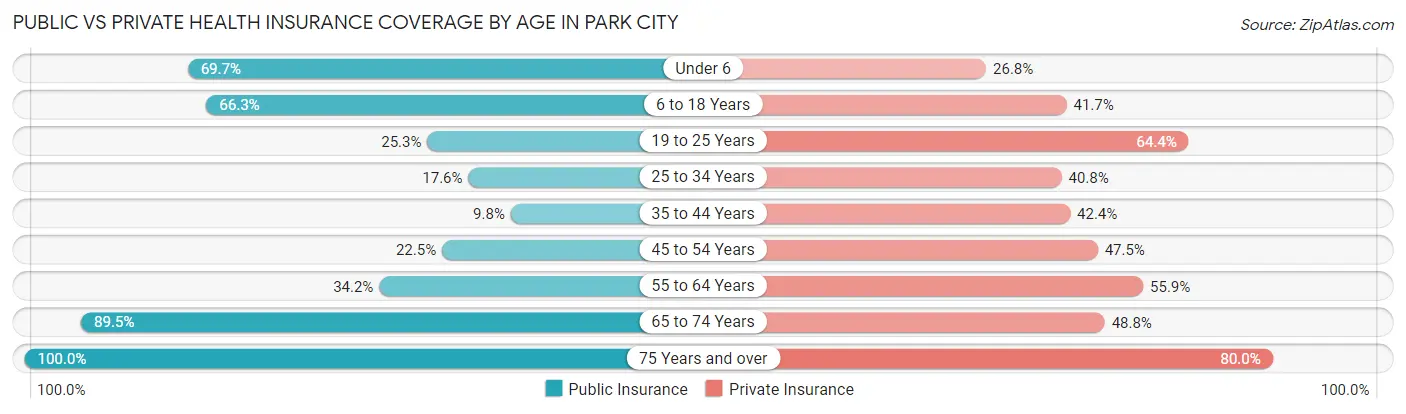
| Age Bracket | Public Insurance | Private Insurance |
| Under 6 | 380 (69.7%) | 146 (26.8%) |
| 6 to 18 Years | 1,107 (66.2%) | 697 (41.7%) |
| 19 to 25 Years | 273 (25.3%) | 696 (64.4%) |
| 25 to 34 Years | 156 (17.6%) | 361 (40.8%) |
| 35 to 44 Years | 109 (9.8%) | 473 (42.4%) |
| 45 to 54 Years | 212 (22.5%) | 447 (47.5%) |
| 55 to 64 Years | 242 (34.2%) | 396 (55.9%) |
| 65 to 74 Years | 299 (89.5%) | 163 (48.8%) |
| 75 Years and over | 384 (100.0%) | 307 (79.9%) |
| Total | 3,162 (41.2%) | 3,686 (48.1%) |
Disability Status by Sex by Age in Park City

| Age Bracket | Male | Female |
| Under 5 Years | 0 (0.0%) | 0 (0.0%) |
| 5 to 17 Years | 70 (9.0%) | 0 (0.0%) |
| 18 to 34 Years | 146 (10.5%) | 153 (17.9%) |
| 35 to 64 Years | 145 (13.9%) | 194 (11.3%) |
| 65 to 74 Years | 23 (15.8%) | 79 (42.0%) |
| 75 Years and over | 102 (62.2%) | 52 (23.6%) |
Disability Class by Sex by Age in Park City
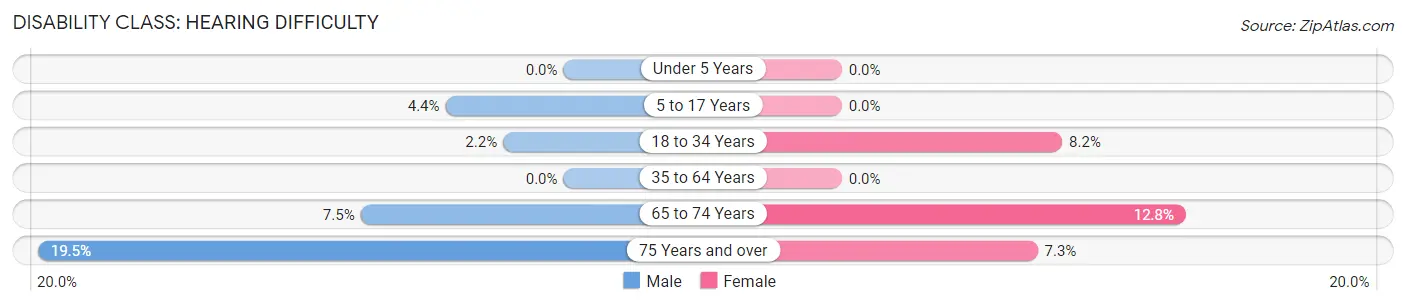
Disability Class: Hearing Difficulty
| Age Bracket | Male | Female |
| Under 5 Years | 0 (0.0%) | 0 (0.0%) |
| 5 to 17 Years | 34 (4.4%) | 0 (0.0%) |
| 18 to 34 Years | 31 (2.2%) | 70 (8.2%) |
| 35 to 64 Years | 0 (0.0%) | 0 (0.0%) |
| 65 to 74 Years | 11 (7.5%) | 24 (12.8%) |
| 75 Years and over | 32 (19.5%) | 16 (7.3%) |
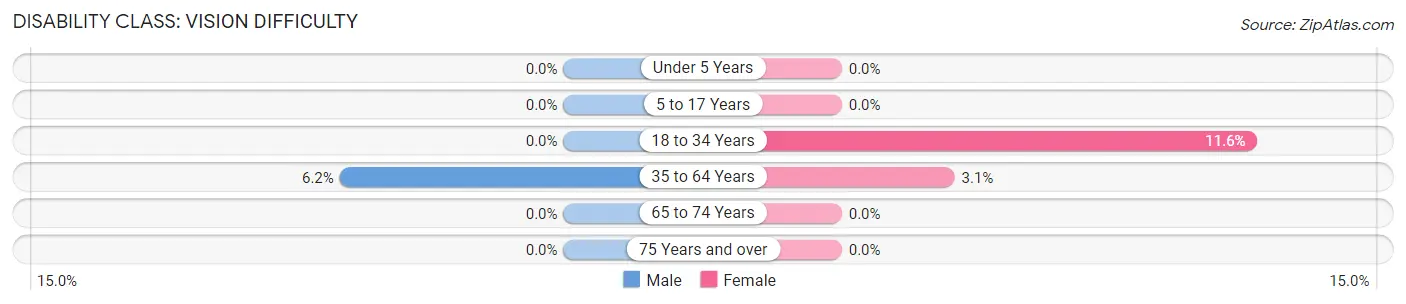
Disability Class: Vision Difficulty
| Age Bracket | Male | Female |
| Under 5 Years | 0 (0.0%) | 0 (0.0%) |
| 5 to 17 Years | 0 (0.0%) | 0 (0.0%) |
| 18 to 34 Years | 0 (0.0%) | 99 (11.6%) |
| 35 to 64 Years | 65 (6.2%) | 54 (3.1%) |
| 65 to 74 Years | 0 (0.0%) | 0 (0.0%) |
| 75 Years and over | 0 (0.0%) | 0 (0.0%) |
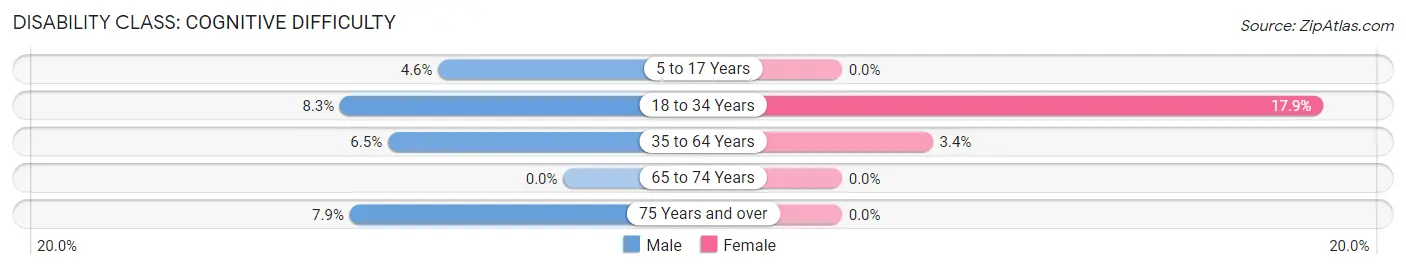
Disability Class: Cognitive Difficulty
| Age Bracket | Male | Female |
| 5 to 17 Years | 36 (4.6%) | 0 (0.0%) |
| 18 to 34 Years | 115 (8.3%) | 153 (17.9%) |
| 35 to 64 Years | 68 (6.5%) | 58 (3.4%) |
| 65 to 74 Years | 0 (0.0%) | 0 (0.0%) |
| 75 Years and over | 13 (7.9%) | 0 (0.0%) |
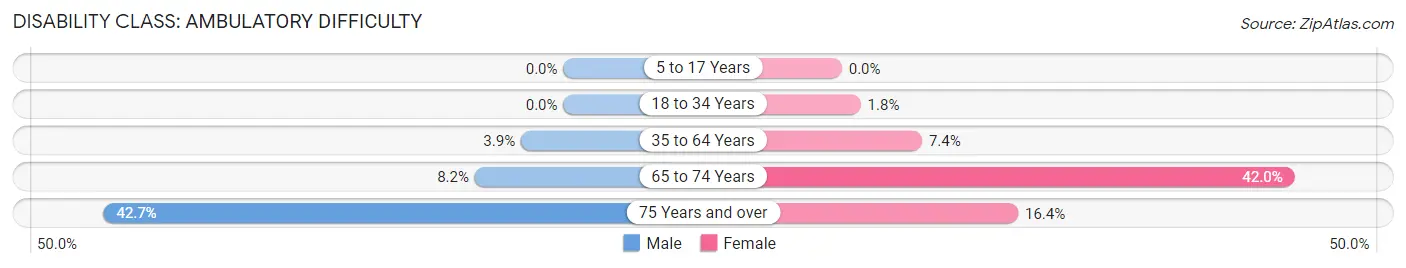
Disability Class: Ambulatory Difficulty
| Age Bracket | Male | Female |
| 5 to 17 Years | 0 (0.0%) | 0 (0.0%) |
| 18 to 34 Years | 0 (0.0%) | 15 (1.8%) |
| 35 to 64 Years | 41 (3.9%) | 128 (7.4%) |
| 65 to 74 Years | 12 (8.2%) | 79 (42.0%) |
| 75 Years and over | 70 (42.7%) | 36 (16.4%) |
Disability Class: Self-Care Difficulty
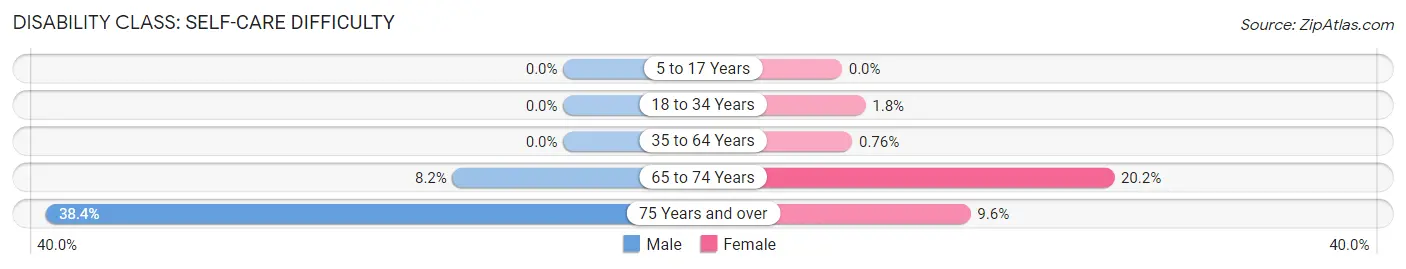
| Age Bracket | Male | Female |
| 5 to 17 Years | 0 (0.0%) | 0 (0.0%) |
| 18 to 34 Years | 0 (0.0%) | 15 (1.8%) |
| 35 to 64 Years | 0 (0.0%) | 13 (0.8%) |
| 65 to 74 Years | 12 (8.2%) | 38 (20.2%) |
| 75 Years and over | 63 (38.4%) | 21 (9.6%) |
Technology Access in Park City
Computing Device Access in Park City
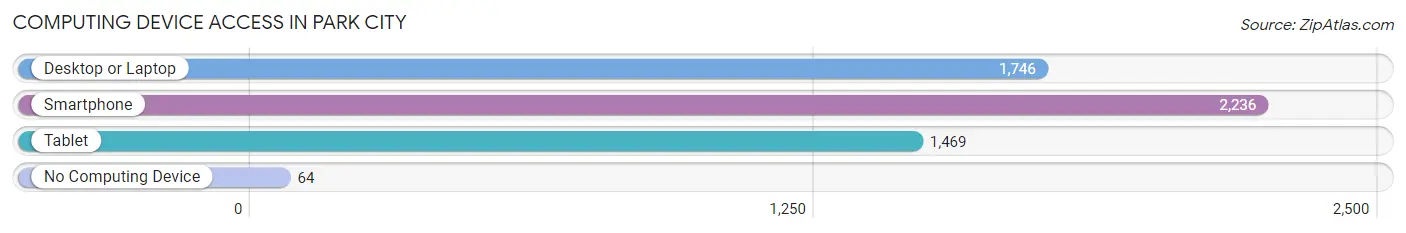
| Device Type | # Households | % Households |
| Desktop or Laptop | 1,746 | 68.4% |
| Smartphone | 2,236 | 87.6% |
| Tablet | 1,469 | 57.6% |
| No Computing Device | 64 | 2.5% |
| Total | 2,551 | 100.0% |
Internet Access in Park City

| Internet Type | # Households | % Households |
| Dial-Up Internet | 0 | 0.0% |
| Broadband Home | 1,853 | 72.6% |
| Cellular Data Only | 362 | 14.2% |
| Satellite Internet | 216 | 8.5% |
| No Internet | 277 | 10.9% |
| Total | 2,551 | 100.0% |
Park City Summary
City of Park City
Park City is a small city located in Lake County, Illinois, United States. It is part of the Chicago metropolitan area and is located approximately 40 miles north of downtown Chicago. The population was 7,837 at the 2010 census.
History
Park City was founded in 1836 by a group of settlers from New York. The city was named after the nearby Park Forest, which was a popular destination for the settlers. The city was incorporated in 1892 and has since grown to become a thriving community.
The city was originally a farming community, but in the late 19th century, it began to develop into a manufacturing center. The city was home to several factories, including a paper mill, a brickyard, and a canning factory. The city also had a large number of saloons and taverns, which were popular with the local workers.
In the early 20th century, Park City began to experience a period of growth and development. The city was home to several large businesses, including a steel mill, a foundry, and a machine shop. The city also had a number of small businesses, including a grocery store, a bakery, and a drug store.
In the 1950s, Park City began to experience a period of decline. The steel mill and foundry closed, and the city's population began to decline. In the 1970s, the city began to experience a period of revitalization. The city was home to several new businesses, including a shopping center, a movie theater, and a bowling alley.
Geography
Park City is located in northeastern Illinois, approximately 40 miles north of downtown Chicago. The city is situated on the banks of the Des Plaines River. The city is bordered by the cities of Waukegan to the north, North Chicago to the east, and Zion to the south.
The city has a total area of 4.2 square miles, all of which is land. The city is located in a flat, low-lying area, with an elevation of 645 feet above sea level.
Economy
Park City's economy is largely based on manufacturing and retail. The city is home to several large manufacturing companies, including a steel mill, a foundry, and a machine shop. The city also has a number of small businesses, including a grocery store, a bakery, and a drug store.
The city is also home to several retail stores, including a shopping center, a movie theater, and a bowling alley. The city is also home to a number of restaurants, bars, and other entertainment venues.
Demographics
As of the 2010 census, the population of Park City was 7,837. The racial makeup of the city was 79.3% White, 11.2% African American, 0.3% Native American, 0.7% Asian, 0.1% Pacific Islander, 5.2% from other races, and 3.3% from two or more races. Hispanic or Latino of any race were 11.7% of the population.
The median income for a household in the city was $45,945, and the median income for a family was $51,945. The per capita income for the city was $20,945. About 8.3% of families and 10.2% of the population were below the poverty line, including 14.2% of those under age 18 and 6.2% of those age 65 or over.
Common Questions
What is the Total Population of Park City?
Total Population of Park City is 7,702.
What is the Total Male Population of Park City?
Total Male Population of Park City is 3,691.
What is the Total Female Population of Park City?
Total Female Population of Park City is 4,011.
What is the Ratio of Males per 100 Females in Park City?
There are 92.02 Males per 100 Females in Park City.
What is the Ratio of Females per 100 Males in Park City?
There are 108.67 Females per 100 Males in Park City.
What is the Median Population Age in Park City?
Median Population Age in Park City is 31.2 Years.
What is the Average Family Size in Park City
Average Family Size in Park City is 3.5 People.
What is the Average Household Size in Park City
Average Household Size in Park City is 3.0 People.
What is Per Capita Income in Park City?
Per Capita income in Park City is $22,647.
What is the Median Family Income in Park City?
Median Family Income in Park City is $63,683.
What is the Median Household income in Park City?
Median Household Income in Park City is $58,540.
What is Income or Wage Gap in Park City?
Income or Wage Gap in Park City is 22.7%.
Women in Park City earn 77.3 cents for every dollar earned by a man.
What is Inequality or Gini Index in Park City?
Inequality or Gini Index in Park City is 0.35.
How Large is the Labor Force in Park City?
There are 4,433 People in the Labor Forcein in Park City.
What is the Percentage of People in the Labor Force in Park City?
72.0% of People are in the Labor Force in Park City.
What is the Unemployment Rate in Park City?
Unemployment Rate in Park City is 9.5%.