Ste Marie, IL
Ste Marie Map
Ste Marie Overview
289
TOTAL POPULATION
135
MALE POPULATION
154
FEMALE POPULATION
87.66
MALES / 100 FEMALES
114.07
FEMALES / 100 MALES
29.8
MEDIAN AGE
4.0
AVG FAMILY SIZE
3.2
AVG HOUSEHOLD SIZE
$26,526
PER CAPITA INCOME
$78,750
AVG FAMILY INCOME
$73,125
AVG HOUSEHOLD INCOME
68.6%
WAGE / INCOME GAP [ % ]
31.4¢/ $1
WAGE / INCOME GAP [ $ ]
0.35
INEQUALITY / GINI INDEX
142
LABOR FORCE [ PEOPLE ]
73.2%
PERCENT IN LABOR FORCE
3.5%
UNEMPLOYMENT RATE
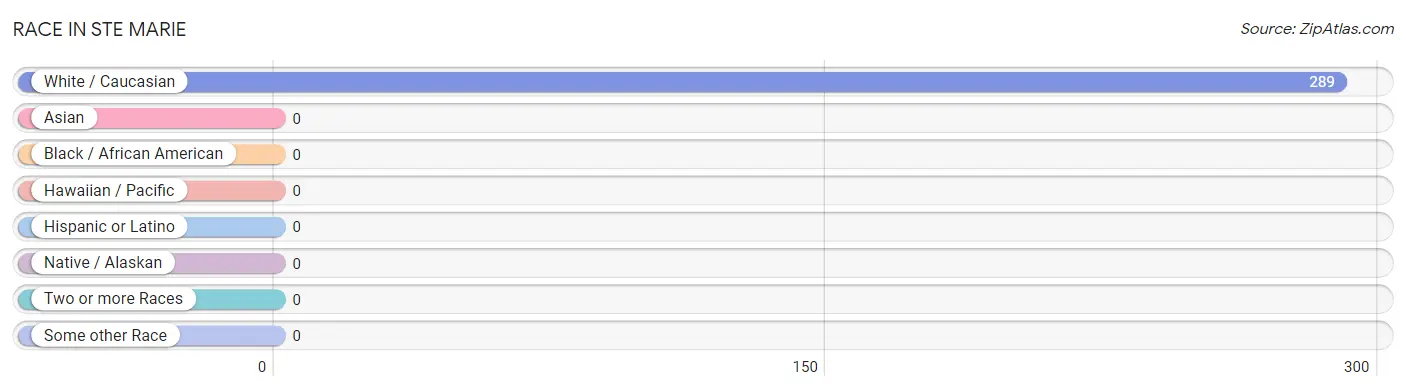
Race in Ste Marie
The most populous races in Ste Marie are , and White / Caucasian (289 | 100.0%).
| Race | # Population | % Population |
| Asian | 0 | 0.0% |
| Black / African American | 0 | 0.0% |
| Hawaiian / Pacific | 0 | 0.0% |
| Hispanic or Latino | 0 | 0.0% |
| Native / Alaskan | 0 | 0.0% |
| White / Caucasian | 289 | 100.0% |
| Two or more Races | 0 | 0.0% |
| Some other Race | 0 | 0.0% |
| Total | 289 | 100.0% |
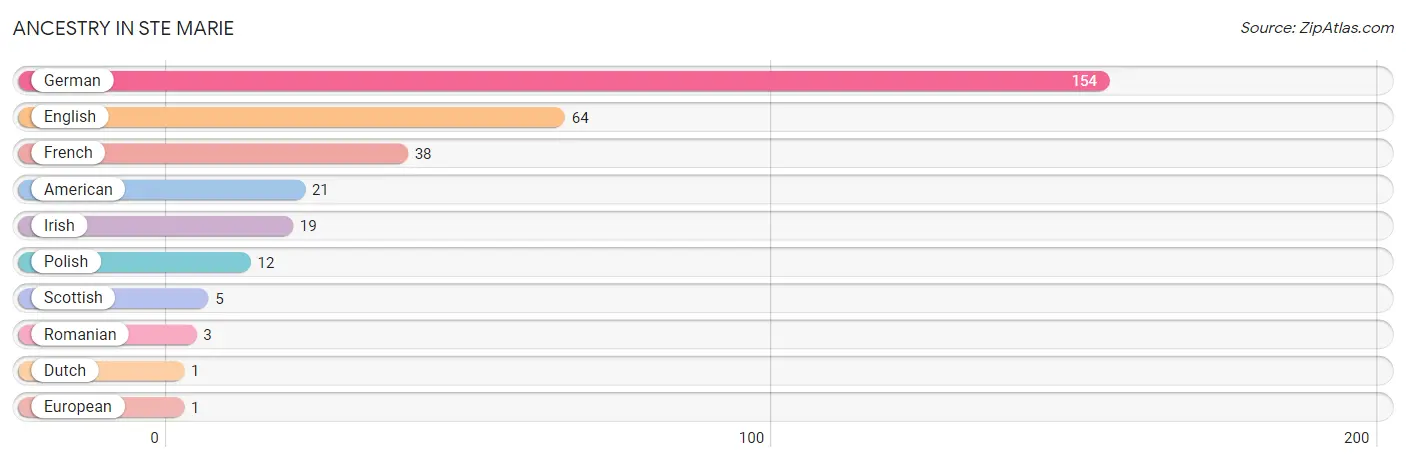
Ancestry in Ste Marie
The most populous ancestries reported in Ste Marie are German (154 | 53.3%), English (64 | 22.2%), French (38 | 13.2%), American (21 | 7.3%), and Irish (19 | 6.6%), together accounting for 102.4% of all Ste Marie residents.
| Ancestry | # Population | % Population |
| American | 21 | 7.3% |
| Dutch | 1 | 0.4% |
| English | 64 | 22.2% |
| European | 1 | 0.4% |
| French | 38 | 13.2% |
| German | 154 | 53.3% |
| Irish | 19 | 6.6% |
| Polish | 12 | 4.2% |
| Romanian | 3 | 1.0% |
| Scottish | 5 | 1.7% | View All 10 Rows |
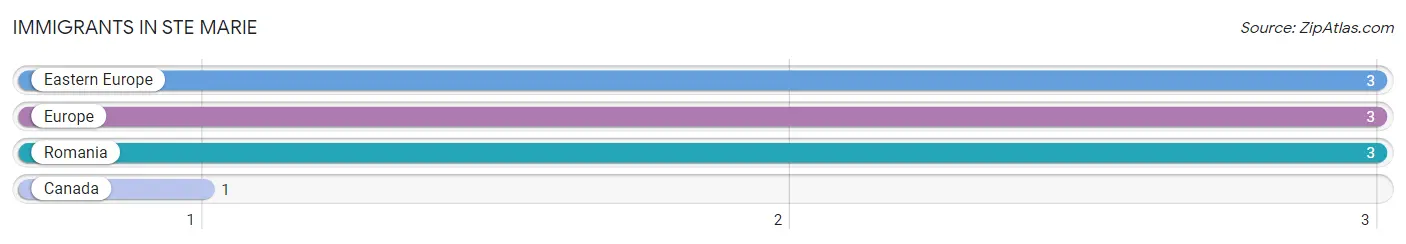
Immigrants in Ste Marie
The most numerous immigrant groups reported in Ste Marie came from Eastern Europe (3 | 1.0%), Europe (3 | 1.0%), Romania (3 | 1.0%), and Canada (1 | 0.4%), together accounting for 3.5% of all Ste Marie residents.
| Immigration Origin | # Population | % Population |
| Canada | 1 | 0.4% |
| Eastern Europe | 3 | 1.0% |
| Europe | 3 | 1.0% |
| Romania | 3 | 1.0% | View All 4 Rows |
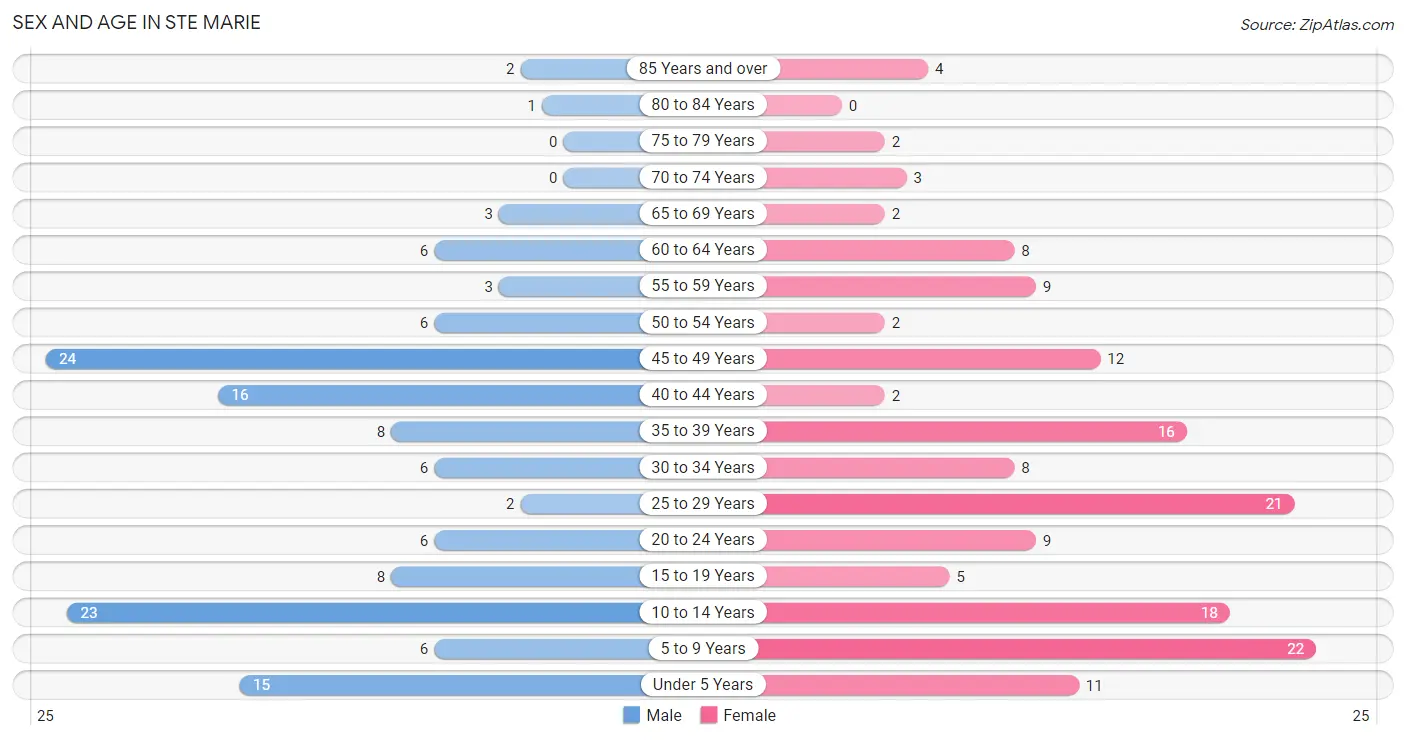
Sex and Age in Ste Marie
Sex and Age in Ste Marie
The most populous age groups in Ste Marie are 45 to 49 Years (24 | 17.8%) for men and 5 to 9 Years (22 | 14.3%) for women.
| Age Bracket | Male | Female |
| Under 5 Years | 15 (11.1%) | 11 (7.1%) |
| 5 to 9 Years | 6 (4.4%) | 22 (14.3%) |
| 10 to 14 Years | 23 (17.0%) | 18 (11.7%) |
| 15 to 19 Years | 8 (5.9%) | 5 (3.3%) |
| 20 to 24 Years | 6 (4.4%) | 9 (5.8%) |
| 25 to 29 Years | 2 (1.5%) | 21 (13.6%) |
| 30 to 34 Years | 6 (4.4%) | 8 (5.2%) |
| 35 to 39 Years | 8 (5.9%) | 16 (10.4%) |
| 40 to 44 Years | 16 (11.8%) | 2 (1.3%) |
| 45 to 49 Years | 24 (17.8%) | 12 (7.8%) |
| 50 to 54 Years | 6 (4.4%) | 2 (1.3%) |
| 55 to 59 Years | 3 (2.2%) | 9 (5.8%) |
| 60 to 64 Years | 6 (4.4%) | 8 (5.2%) |
| 65 to 69 Years | 3 (2.2%) | 2 (1.3%) |
| 70 to 74 Years | 0 (0.0%) | 3 (1.9%) |
| 75 to 79 Years | 0 (0.0%) | 2 (1.3%) |
| 80 to 84 Years | 1 (0.7%) | 0 (0.0%) |
| 85 Years and over | 2 (1.5%) | 4 (2.6%) |
| Total | 135 (100.0%) | 154 (100.0%) |
Families and Households in Ste Marie
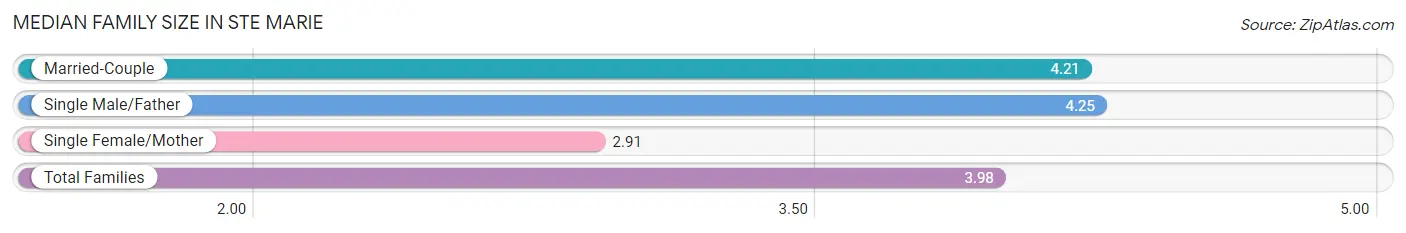
Median Family Size in Ste Marie
The median family size in Ste Marie is 3.98 persons per family, with single male/father families (8 | 12.9%) accounting for the largest median family size of 4.25 persons per family. On the other hand, single female/mother families (11 | 17.7%) represent the smallest median family size with 2.91 persons per family.
| Family Type | # Families | Family Size |
| Married-Couple | 43 (69.4%) | 4.21 |
| Single Male/Father | 8 (12.9%) | 4.25 |
| Single Female/Mother | 11 (17.7%) | 2.91 |
| Total Families | 62 (100.0%) | 3.98 |
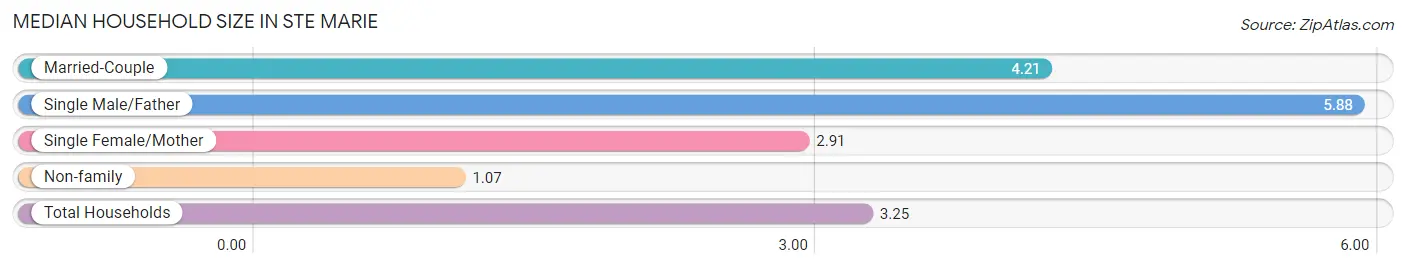
Median Household Size in Ste Marie
The median household size in Ste Marie is 3.25 persons per household, with single male/father households (8 | 9.0%) accounting for the largest median household size of 5.88 persons per household. non-family households (27 | 30.3%) represent the smallest median household size with 1.07 persons per household.
| Household Type | # Households | Household Size |
| Married-Couple | 43 (48.3%) | 4.21 |
| Single Male/Father | 8 (9.0%) | 5.88 |
| Single Female/Mother | 11 (12.4%) | 2.91 |
| Non-family | 27 (30.3%) | 1.07 |
| Total Households | 89 (100.0%) | 3.25 |
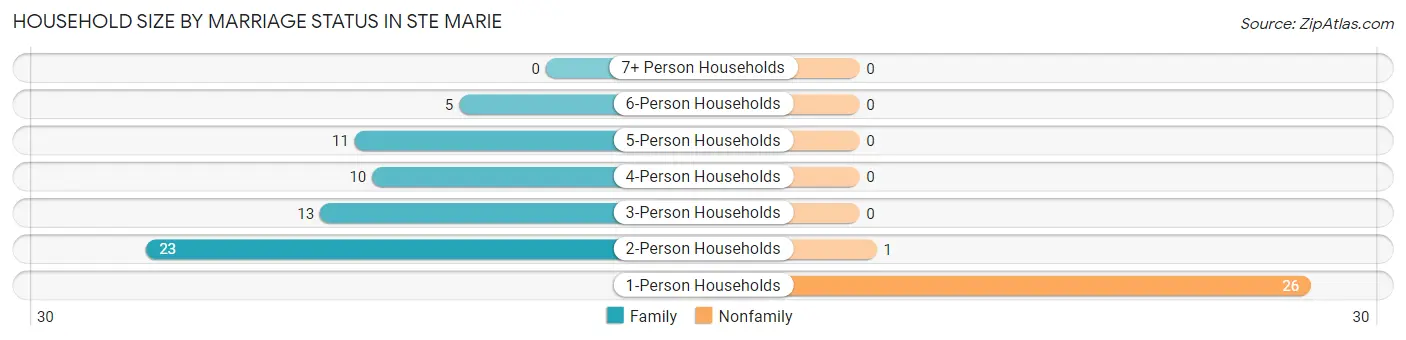
Household Size by Marriage Status in Ste Marie
Out of a total of 89 households in Ste Marie, 62 (69.7%) are family households, while 27 (30.3%) are nonfamily households. The most numerous type of family households are 2-person households, comprising 23, and the most common type of nonfamily households are 1-person households, comprising 26.
| Household Size | Family Households | Nonfamily Households |
| 1-Person Households | - | 26 (29.2%) |
| 2-Person Households | 23 (25.8%) | 1 (1.1%) |
| 3-Person Households | 13 (14.6%) | 0 (0.0%) |
| 4-Person Households | 10 (11.2%) | 0 (0.0%) |
| 5-Person Households | 11 (12.4%) | 0 (0.0%) |
| 6-Person Households | 5 (5.6%) | 0 (0.0%) |
| 7+ Person Households | 0 (0.0%) | 0 (0.0%) |
| Total | 62 (69.7%) | 27 (30.3%) |
Female Fertility in Ste Marie
Fertility by Age in Ste Marie
Average fertility rate in Ste Marie is 164.0 births per 1,000 women. Women in the age bracket of 20 to 34 years have the highest fertility rate with 211.0 births per 1,000 women. Women in the age bracket of 20 to 34 years acount for 66.7% of all women with births.
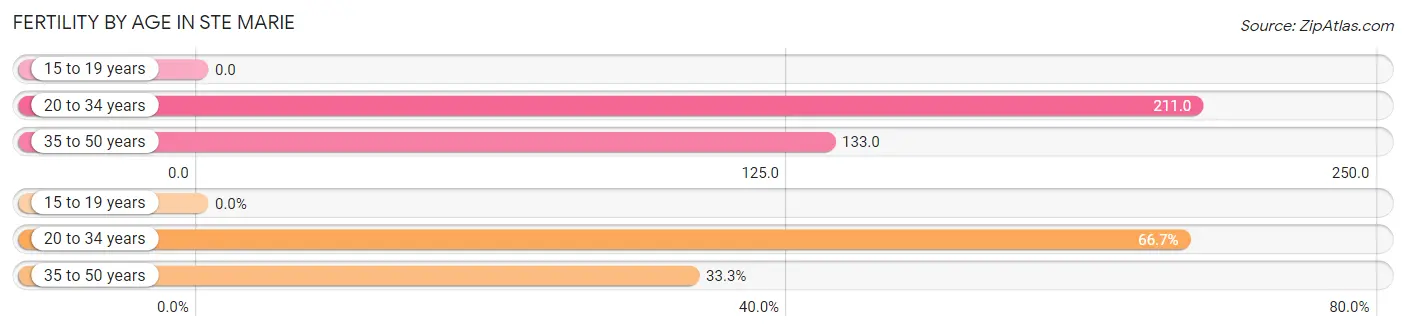
| Age Bracket | Women with Births | Births / 1,000 Women |
| 15 to 19 years | 0 (0.0%) | 0.0 |
| 20 to 34 years | 8 (66.7%) | 211.0 |
| 35 to 50 years | 4 (33.3%) | 133.0 |
| Total | 12 (100.0%) | 164.0 |
Fertility by Age by Marriage Status in Ste Marie
33.3% of women with births (12) in Ste Marie are married. The highest percentage of unmarried women with births falls into 20 to 34 years age bracket with 100.0% of them unmarried at the time of birth, while the lowest percentage of unmarried women with births belong to 35 to 50 years age bracket with 0.0% of them unmarried.
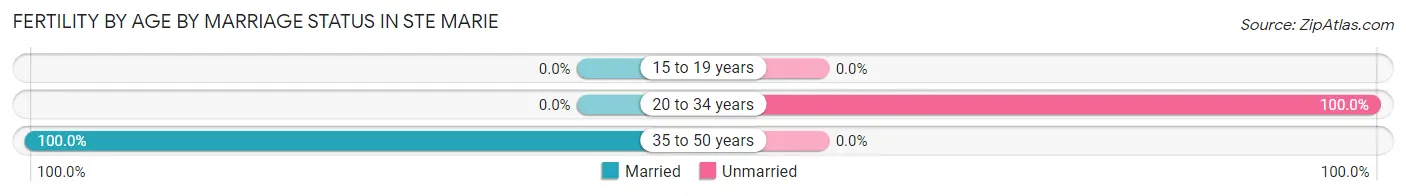
| Age Bracket | Married | Unmarried |
| 15 to 19 years | 0 (0.0%) | 0 (0.0%) |
| 20 to 34 years | 0 (0.0%) | 8 (100.0%) |
| 35 to 50 years | 4 (100.0%) | 0 (0.0%) |
| Total | 4 (33.3%) | 8 (66.7%) |
Fertility by Education in Ste Marie
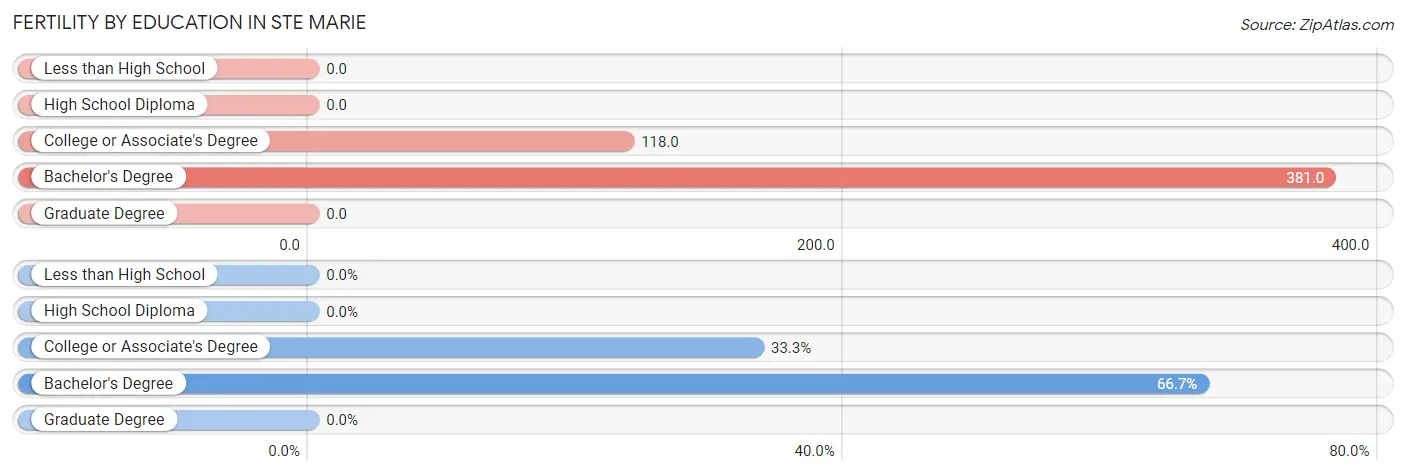
| Educational Attainment | Women with Births | Births / 1,000 Women |
| Less than High School | 0 (0.0%) | 0.0 |
| High School Diploma | 0 (0.0%) | 0.0 |
| College or Associate's Degree | 4 (33.3%) | 118.0 |
| Bachelor's Degree | 8 (66.7%) | 381.0 |
| Graduate Degree | 0 (0.0%) | 0.0 |
| Total | 12 (100.0%) | 164.0 |
Fertility by Education by Marriage Status in Ste Marie
66.7% of women with births in Ste Marie are unmarried. Women with the educational attainment of college or associate's degree are most likely to be married with 100.0% of them married at childbirth, while women with the educational attainment of bachelor's degree are least likely to be married with 100.0% of them unmarried at childbirth.
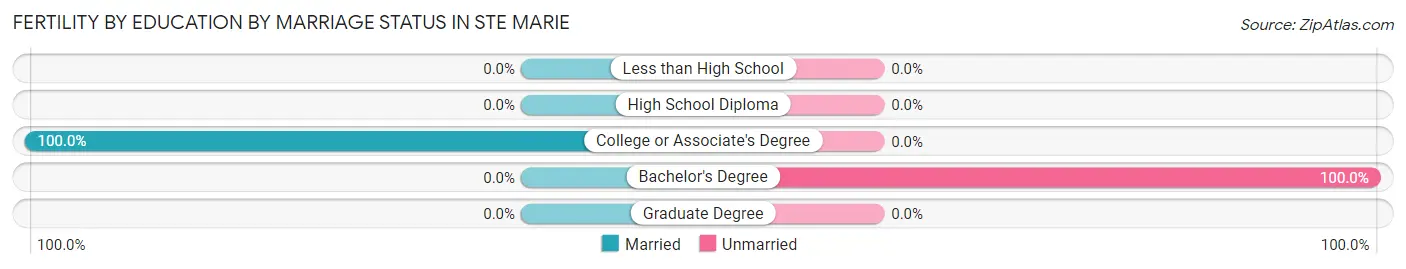
| Educational Attainment | Married | Unmarried |
| Less than High School | 0 (0.0%) | 0 (0.0%) |
| High School Diploma | 0 (0.0%) | 0 (0.0%) |
| College or Associate's Degree | 4 (100.0%) | 0 (0.0%) |
| Bachelor's Degree | 0 (0.0%) | 8 (100.0%) |
| Graduate Degree | 0 (0.0%) | 0 (0.0%) |
| Total | 4 (33.3%) | 8 (66.7%) |
Income in Ste Marie
Income Overview in Ste Marie
Per Capita Income in Ste Marie is $26,526, while median incomes of families and households are $78,750 and $73,125 respectively.
| Characteristic | Number | Measure |
| Per Capita Income | 289 | $26,526 |
| Median Family Income | 62 | $78,750 |
| Mean Family Income | 62 | $91,765 |
| Median Household Income | 89 | $73,125 |
| Mean Household Income | 89 | $75,563 |
| Income Deficit | 62 | $0 |
| Wage / Income Gap (%) | 289 | 68.59% |
| Wage / Income Gap ($) | 289 | 31.41¢ per $1 |
| Gini / Inequality Index | 289 | 0.35 |
Earnings by Sex in Ste Marie
Average Earnings in Ste Marie are $40,250, $67,656 for men and $21,250 for women, a difference of 68.6%.
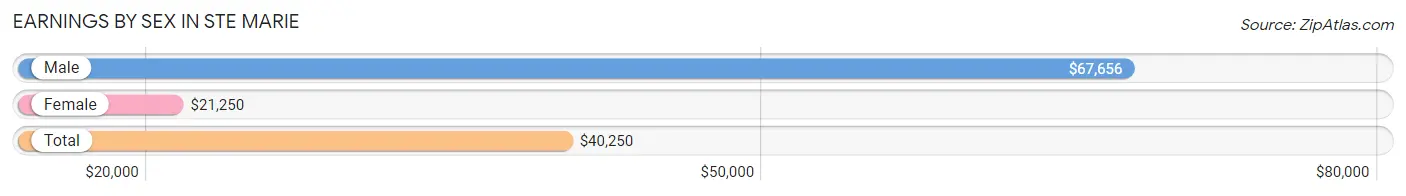
| Sex | Number | Average Earnings |
| Male | 71 (47.6%) | $67,656 |
| Female | 78 (52.3%) | $21,250 |
| Total | 149 (100.0%) | $40,250 |
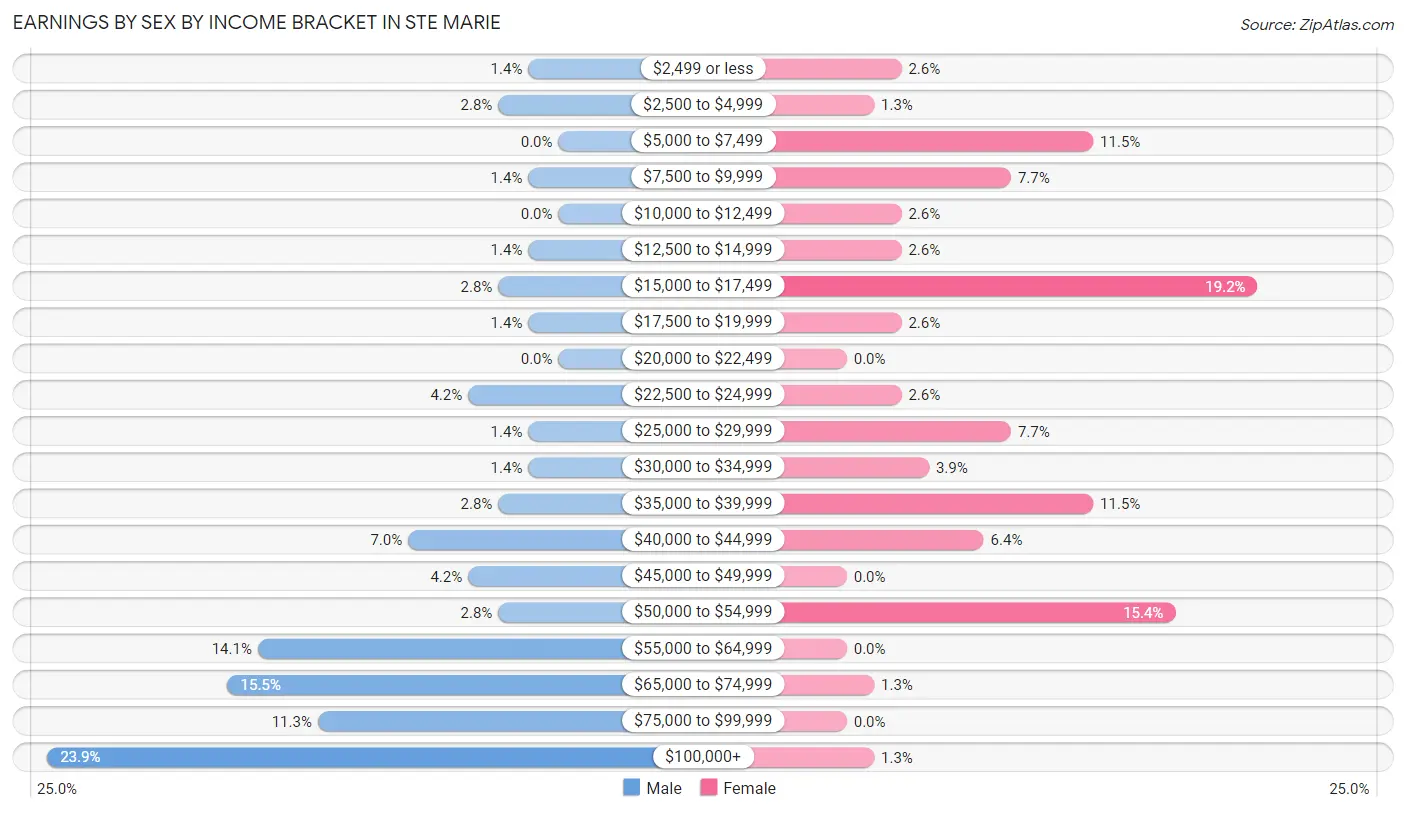
Earnings by Sex by Income Bracket in Ste Marie
The most common earnings brackets in Ste Marie are $100,000+ for men (17 | 23.9%) and $15,000 to $17,499 for women (15 | 19.2%).
| Income | Male | Female |
| $2,499 or less | 1 (1.4%) | 2 (2.6%) |
| $2,500 to $4,999 | 2 (2.8%) | 1 (1.3%) |
| $5,000 to $7,499 | 0 (0.0%) | 9 (11.5%) |
| $7,500 to $9,999 | 1 (1.4%) | 6 (7.7%) |
| $10,000 to $12,499 | 0 (0.0%) | 2 (2.6%) |
| $12,500 to $14,999 | 1 (1.4%) | 2 (2.6%) |
| $15,000 to $17,499 | 2 (2.8%) | 15 (19.2%) |
| $17,500 to $19,999 | 1 (1.4%) | 2 (2.6%) |
| $20,000 to $22,499 | 0 (0.0%) | 0 (0.0%) |
| $22,500 to $24,999 | 3 (4.2%) | 2 (2.6%) |
| $25,000 to $29,999 | 1 (1.4%) | 6 (7.7%) |
| $30,000 to $34,999 | 1 (1.4%) | 3 (3.8%) |
| $35,000 to $39,999 | 2 (2.8%) | 9 (11.5%) |
| $40,000 to $44,999 | 5 (7.0%) | 5 (6.4%) |
| $45,000 to $49,999 | 3 (4.2%) | 0 (0.0%) |
| $50,000 to $54,999 | 2 (2.8%) | 12 (15.4%) |
| $55,000 to $64,999 | 10 (14.1%) | 0 (0.0%) |
| $65,000 to $74,999 | 11 (15.5%) | 1 (1.3%) |
| $75,000 to $99,999 | 8 (11.3%) | 0 (0.0%) |
| $100,000+ | 17 (23.9%) | 1 (1.3%) |
| Total | 71 (100.0%) | 78 (100.0%) |
Earnings by Sex by Educational Attainment in Ste Marie
Average earnings in Ste Marie are $68,906 for men and $25,000 for women, a difference of 63.7%. Men with an educational attainment of bachelor's degree enjoy the highest average annual earnings of $93,125, while those with high school diploma education earn the least with $59,167. Women with an educational attainment of college or associate's degree earn the most with the average annual earnings of $25,000, while those with high school diploma education have the smallest earnings of $16,750.
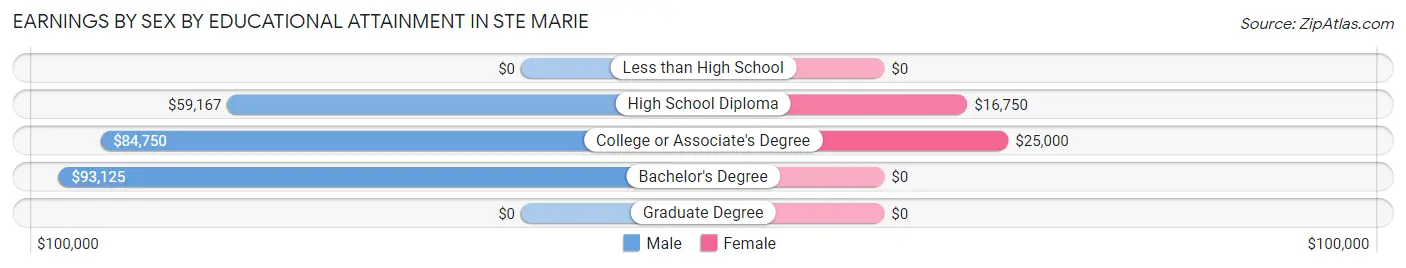
| Educational Attainment | Male Income | Female Income |
| Less than High School | - | - |
| High School Diploma | $59,167 | $16,750 |
| College or Associate's Degree | $84,750 | $25,000 |
| Bachelor's Degree | $93,125 | $0 |
| Graduate Degree | - | - |
| Total | $68,906 | $25,000 |
Family Income in Ste Marie
Family Income Brackets in Ste Marie
According to the Ste Marie family income data, there are 20 families falling into the $100,000 to $149,999 income range, which is the most common income bracket and makes up 32.3% of all families.
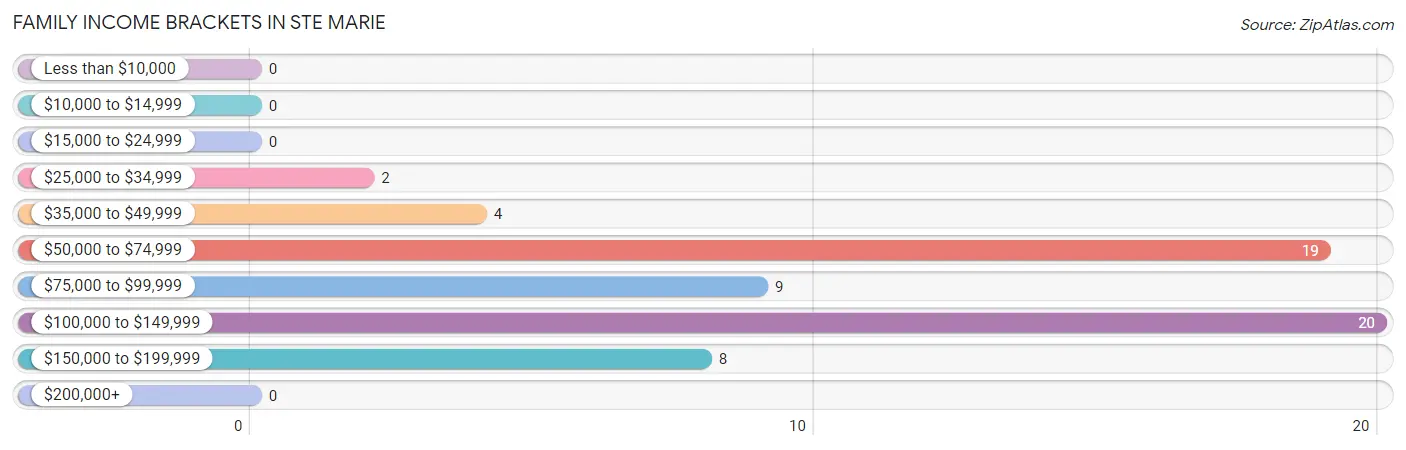
| Income Bracket | # Families | % Families |
| Less than $10,000 | 0 | 0.0% |
| $10,000 to $14,999 | 0 | 0.0% |
| $15,000 to $24,999 | 0 | 0.0% |
| $25,000 to $34,999 | 2 | 3.2% |
| $35,000 to $49,999 | 4 | 6.5% |
| $50,000 to $74,999 | 19 | 30.6% |
| $75,000 to $99,999 | 9 | 14.5% |
| $100,000 to $149,999 | 20 | 32.3% |
| $150,000 to $199,999 | 8 | 12.9% |
| $200,000+ | 0 | 0.0% |
Family Income by Famaliy Size in Ste Marie
2-person families (23 | 37.1%) account for the highest median family income in Ste Marie with $74,375 per family, while 2-person families (23 | 37.1%) have the highest median income of $37,188 per family member.
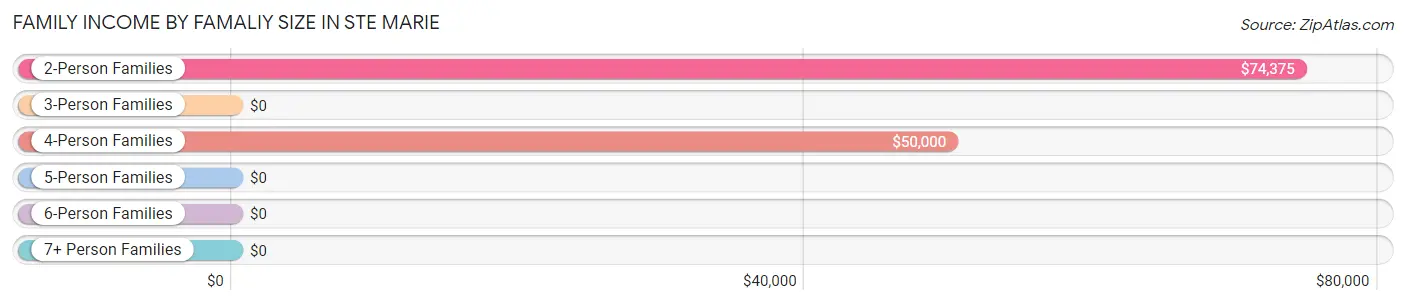
| Income Bracket | # Families | Median Income |
| 2-Person Families | 23 (37.1%) | $74,375 |
| 3-Person Families | 17 (27.4%) | $0 |
| 4-Person Families | 10 (16.1%) | $50,000 |
| 5-Person Families | 7 (11.3%) | $0 |
| 6-Person Families | 5 (8.1%) | $0 |
| 7+ Person Families | 0 (0.0%) | $0 |
| Total | 62 (100.0%) | $78,750 |
Family Income by Number of Earners in Ste Marie
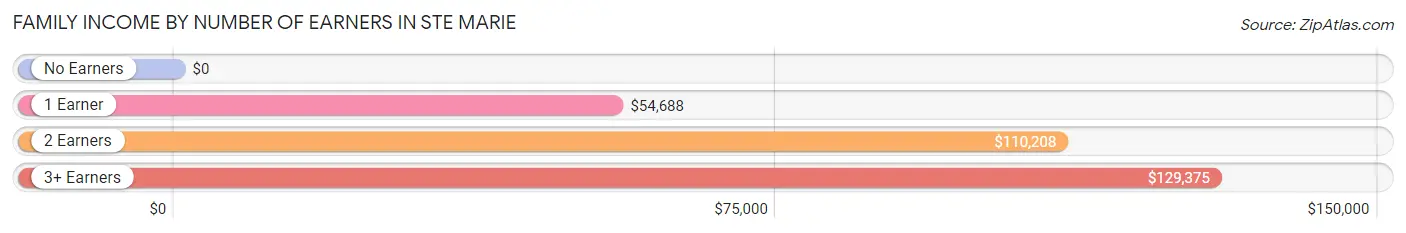
| Number of Earners | # Families | Median Income |
| No Earners | 1 (1.6%) | $0 |
| 1 Earner | 19 (30.6%) | $54,688 |
| 2 Earners | 37 (59.7%) | $110,208 |
| 3+ Earners | 5 (8.1%) | $129,375 |
| Total | 62 (100.0%) | $78,750 |
Household Income in Ste Marie
Household Income Brackets in Ste Marie
With 21 households falling in the category, the $100,000 to $149,999 income range is the most frequent in Ste Marie, accounting for 23.6% of all households.
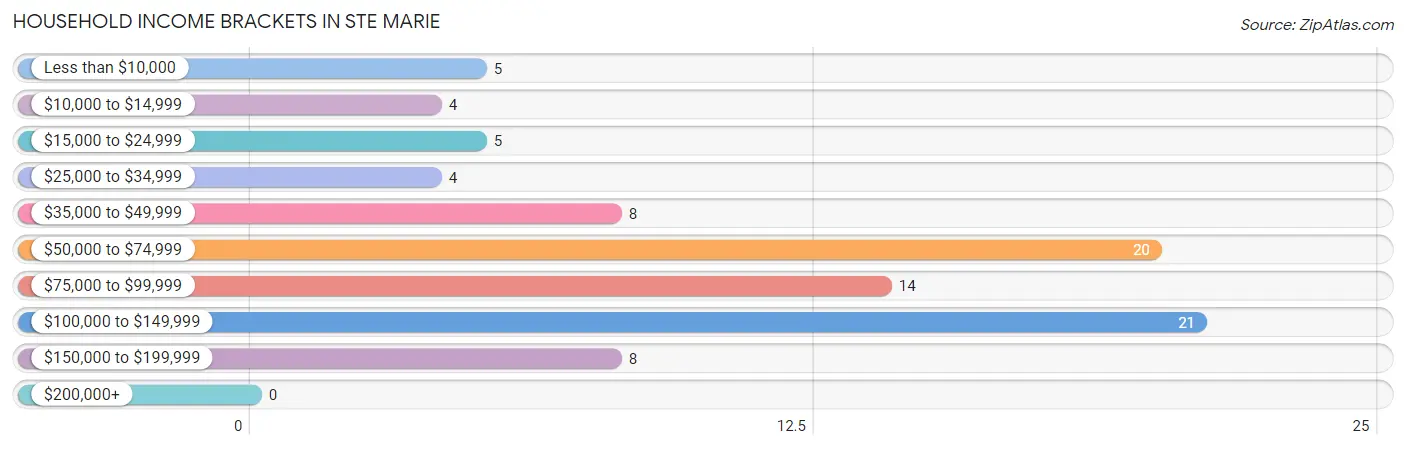
| Income Bracket | # Households | % Households |
| Less than $10,000 | 5 | 5.6% |
| $10,000 to $14,999 | 4 | 4.5% |
| $15,000 to $24,999 | 5 | 5.6% |
| $25,000 to $34,999 | 4 | 4.5% |
| $35,000 to $49,999 | 8 | 9.0% |
| $50,000 to $74,999 | 20 | 22.5% |
| $75,000 to $99,999 | 14 | 15.7% |
| $100,000 to $149,999 | 21 | 23.6% |
| $150,000 to $199,999 | 8 | 9.0% |
| $200,000+ | 0 | 0.0% |
Household Income by Householder Age in Ste Marie
The median household income in Ste Marie is $73,125, with the highest median household income of $77,917 found in the 25 to 44 years age bracket for the primary householder. A total of 33 households (37.1%) fall into this category. Meanwhile, the 15 to 24 years age bracket for the primary householder has the lowest median household income of $0, with 5 households (5.6%) in this group.
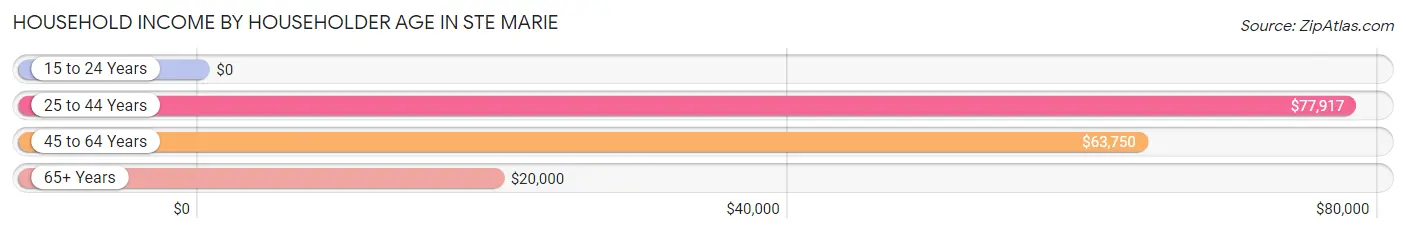
| Income Bracket | # Households | Median Income |
| 15 to 24 Years | 5 (5.6%) | $0 |
| 25 to 44 Years | 33 (37.1%) | $77,917 |
| 45 to 64 Years | 39 (43.8%) | $63,750 |
| 65+ Years | 12 (13.5%) | $20,000 |
| Total | 89 (100.0%) | $73,125 |
Poverty in Ste Marie
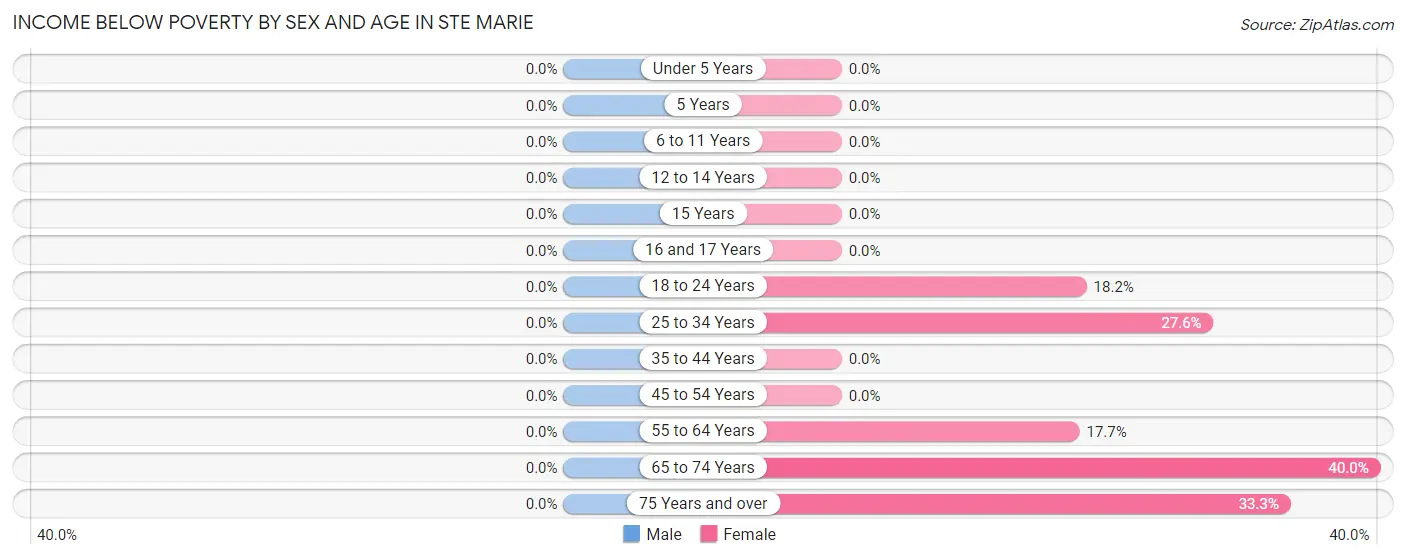
Income Below Poverty by Sex and Age in Ste Marie
| Age Bracket | Male | Female |
| Under 5 Years | 0 (0.0%) | 0 (0.0%) |
| 5 Years | 0 (0.0%) | 0 (0.0%) |
| 6 to 11 Years | 0 (0.0%) | 0 (0.0%) |
| 12 to 14 Years | 0 (0.0%) | 0 (0.0%) |
| 15 Years | 0 (0.0%) | 0 (0.0%) |
| 16 and 17 Years | 0 (0.0%) | 0 (0.0%) |
| 18 to 24 Years | 0 (0.0%) | 2 (18.2%) |
| 25 to 34 Years | 0 (0.0%) | 8 (27.6%) |
| 35 to 44 Years | 0 (0.0%) | 0 (0.0%) |
| 45 to 54 Years | 0 (0.0%) | 0 (0.0%) |
| 55 to 64 Years | 0 (0.0%) | 3 (17.6%) |
| 65 to 74 Years | 0 (0.0%) | 2 (40.0%) |
| 75 Years and over | 0 (0.0%) | 2 (33.3%) |
| Total | 0 (0.0%) | 17 (11.0%) |
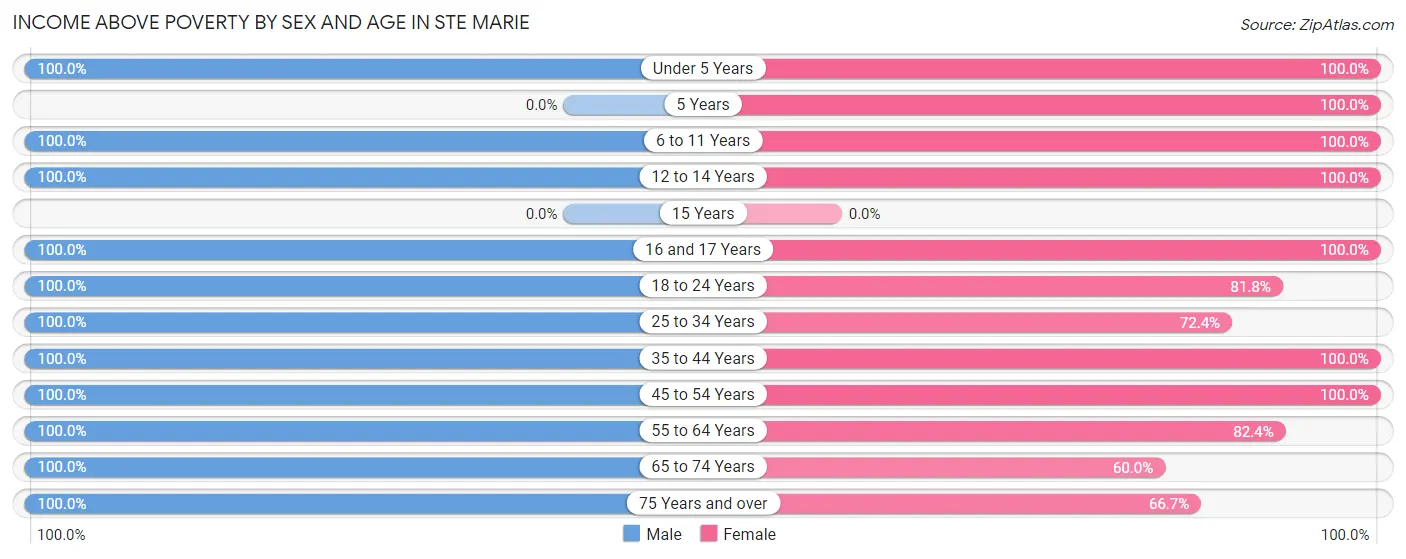
Income Above Poverty by Sex and Age in Ste Marie
According to the poverty statistics in Ste Marie, males aged under 5 years and females aged under 5 years are the age groups that are most secure financially, with 100.0% of males and 100.0% of females in these age groups living above the poverty line.
| Age Bracket | Male | Female |
| Under 5 Years | 15 (100.0%) | 11 (100.0%) |
| 5 Years | 0 (0.0%) | 1 (100.0%) |
| 6 to 11 Years | 21 (100.0%) | 21 (100.0%) |
| 12 to 14 Years | 8 (100.0%) | 18 (100.0%) |
| 15 Years | 0 (0.0%) | 0 (0.0%) |
| 16 and 17 Years | 7 (100.0%) | 3 (100.0%) |
| 18 to 24 Years | 7 (100.0%) | 9 (81.8%) |
| 25 to 34 Years | 8 (100.0%) | 21 (72.4%) |
| 35 to 44 Years | 24 (100.0%) | 18 (100.0%) |
| 45 to 54 Years | 30 (100.0%) | 14 (100.0%) |
| 55 to 64 Years | 9 (100.0%) | 14 (82.4%) |
| 65 to 74 Years | 3 (100.0%) | 3 (60.0%) |
| 75 Years and over | 3 (100.0%) | 4 (66.7%) |
| Total | 135 (100.0%) | 137 (89.0%) |
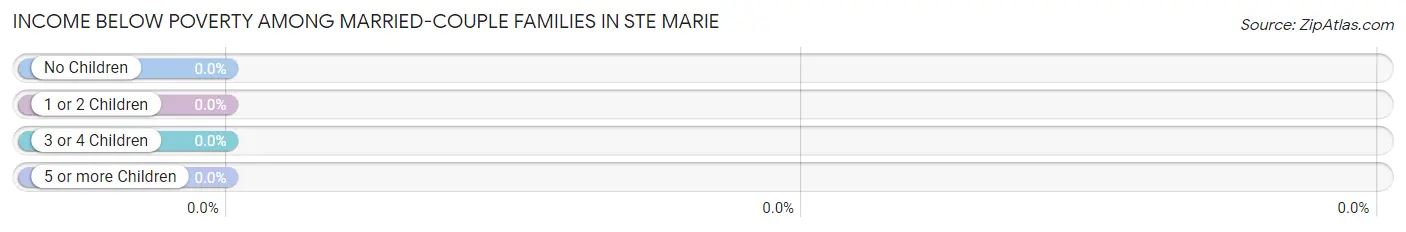
Income Below Poverty Among Married-Couple Families in Ste Marie
| Children | Above Poverty | Below Poverty |
| No Children | 21 (100.0%) | 0 (0.0%) |
| 1 or 2 Children | 12 (100.0%) | 0 (0.0%) |
| 3 or 4 Children | 10 (100.0%) | 0 (0.0%) |
| 5 or more Children | 0 (0.0%) | 0 (0.0%) |
| Total | 43 (100.0%) | 0 (0.0%) |
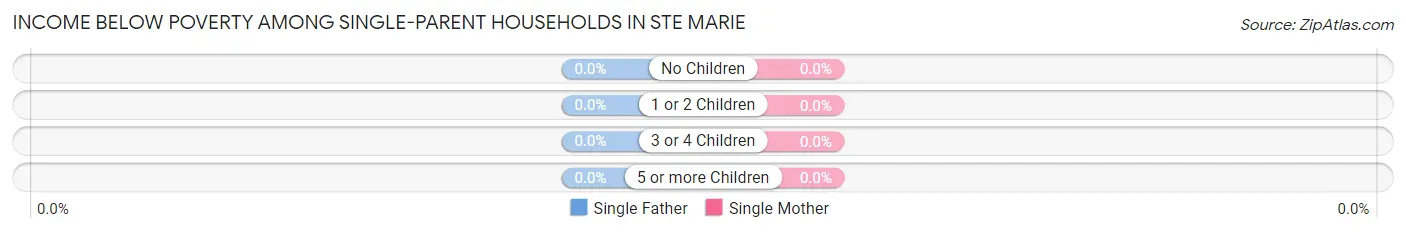
Income Below Poverty Among Single-Parent Households in Ste Marie
| Children | Single Father | Single Mother |
| No Children | 0 (0.0%) | 0 (0.0%) |
| 1 or 2 Children | 0 (0.0%) | 0 (0.0%) |
| 3 or 4 Children | 0 (0.0%) | 0 (0.0%) |
| 5 or more Children | 0 (0.0%) | 0 (0.0%) |
| Total | 0 (0.0%) | 0 (0.0%) |
Income Below Poverty Among Married-Couple vs Single-Parent Households in Ste Marie
| Children | Married-Couple Families | Single-Parent Households |
| No Children | 0 (0.0%) | 0 (0.0%) |
| 1 or 2 Children | 0 (0.0%) | 0 (0.0%) |
| 3 or 4 Children | 0 (0.0%) | 0 (0.0%) |
| 5 or more Children | 0 (0.0%) | 0 (0.0%) |
| Total | 0 (0.0%) | 0 (0.0%) |
Employment Characteristics in Ste Marie
Employment by Class of Employer in Ste Marie
Among the 135 employed individuals in Ste Marie, private company employees (88 | 65.2%), self-employed (not incorporated) (19 | 14.1%), and local government employees (11 | 8.2%) make up the most common classes of employment.
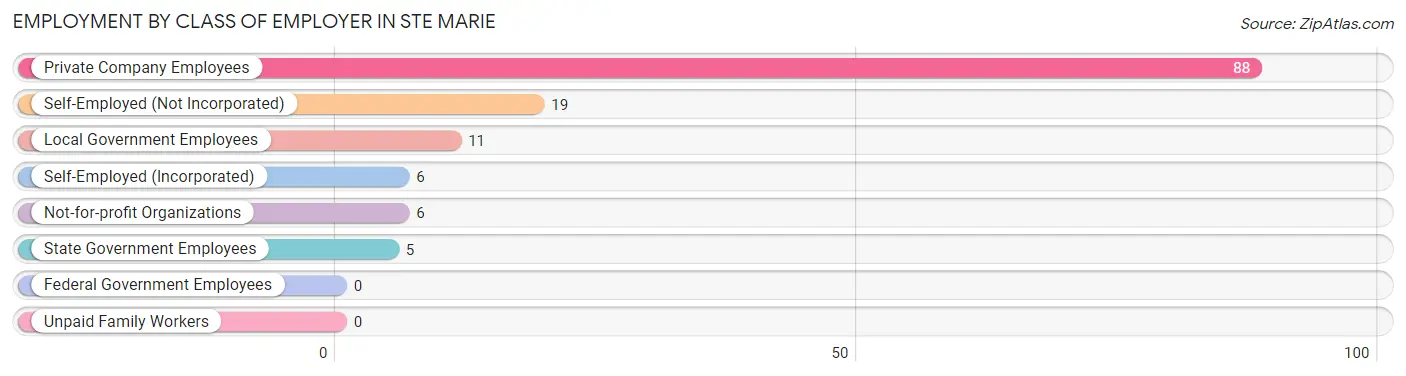
| Employer Class | # Employees | % Employees |
| Private Company Employees | 88 | 65.2% |
| Self-Employed (Incorporated) | 6 | 4.4% |
| Self-Employed (Not Incorporated) | 19 | 14.1% |
| Not-for-profit Organizations | 6 | 4.4% |
| Local Government Employees | 11 | 8.2% |
| State Government Employees | 5 | 3.7% |
| Federal Government Employees | 0 | 0.0% |
| Unpaid Family Workers | 0 | 0.0% |
| Total | 135 | 100.0% |
Employment Status by Age in Ste Marie
According to the labor force statistics for Ste Marie, out of the total population over 16 years of age (194), 73.2% or 142 individuals are in the labor force, with 3.5% or 5 of them unemployed. The age group with the highest labor force participation rate is 30 to 34 years, with 100.0% or 14 individuals in the labor force. Within the labor force, the 25 to 29 years age range has the highest percentage of unemployed individuals, with 19.0% or 4 of them being unemployed.
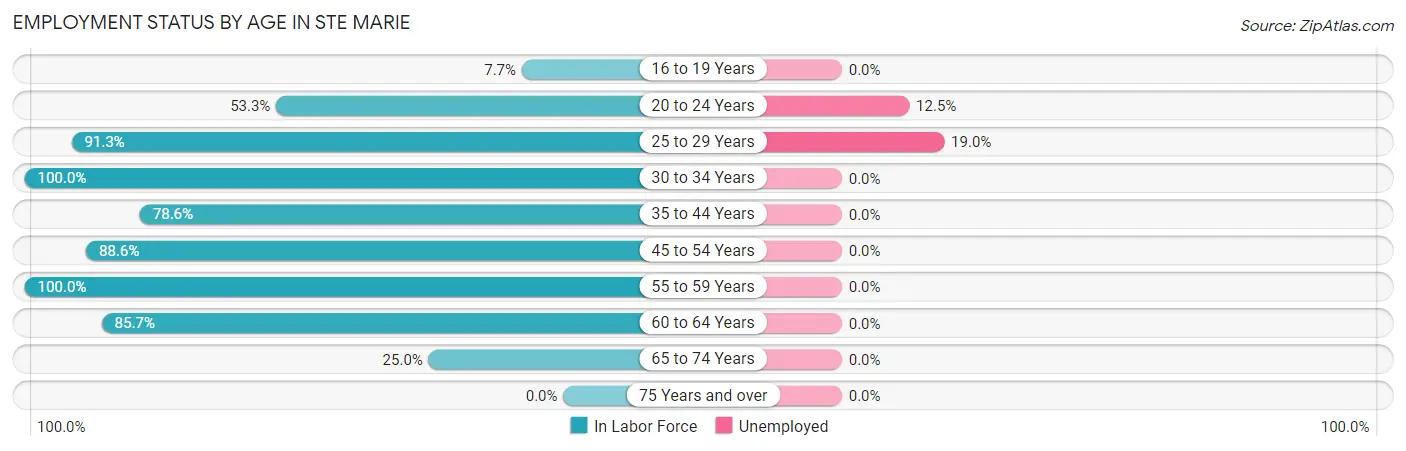
| Age Bracket | In Labor Force | Unemployed |
| 16 to 19 Years | 1 (7.7%) | 0 (0.0%) |
| 20 to 24 Years | 8 (53.3%) | 1 (12.5%) |
| 25 to 29 Years | 21 (91.3%) | 4 (19.0%) |
| 30 to 34 Years | 14 (100.0%) | 0 (0.0%) |
| 35 to 44 Years | 33 (78.6%) | 0 (0.0%) |
| 45 to 54 Years | 39 (88.6%) | 0 (0.0%) |
| 55 to 59 Years | 12 (100.0%) | 0 (0.0%) |
| 60 to 64 Years | 12 (85.7%) | 0 (0.0%) |
| 65 to 74 Years | 2 (25.0%) | 0 (0.0%) |
| 75 Years and over | 0 (0.0%) | 0 (0.0%) |
| Total | 142 (73.2%) | 5 (3.5%) |
Employment Status by Educational Attainment in Ste Marie
According to labor force statistics for Ste Marie, 87.9% of individuals (131) out of the total population between 25 and 64 years of age (149) are in the labor force, with 3.1% or 4 of them being unemployed. The group with the highest labor force participation rate are those with the educational attainment of less than high school, with 100.0% or 1 individuals in the labor force. Within the labor force, individuals with high school diploma education have the highest percentage of unemployment, with 12.1% or 4 of them being unemployed.
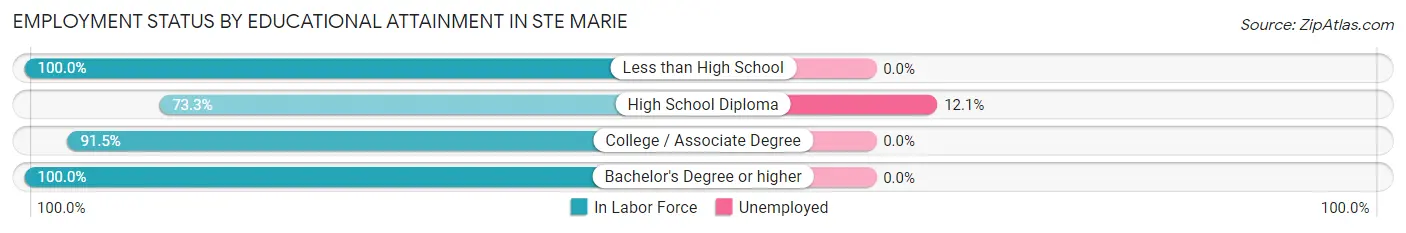
| Educational Attainment | In Labor Force | Unemployed |
| Less than High School | 1 (100.0%) | 0 (0.0%) |
| High School Diploma | 33 (73.3%) | 5 (12.1%) |
| College / Associate Degree | 65 (91.5%) | 0 (0.0%) |
| Bachelor's Degree or higher | 32 (100.0%) | 0 (0.0%) |
| Total | 131 (87.9%) | 5 (3.1%) |
Employment Occupations by Sex in Ste Marie
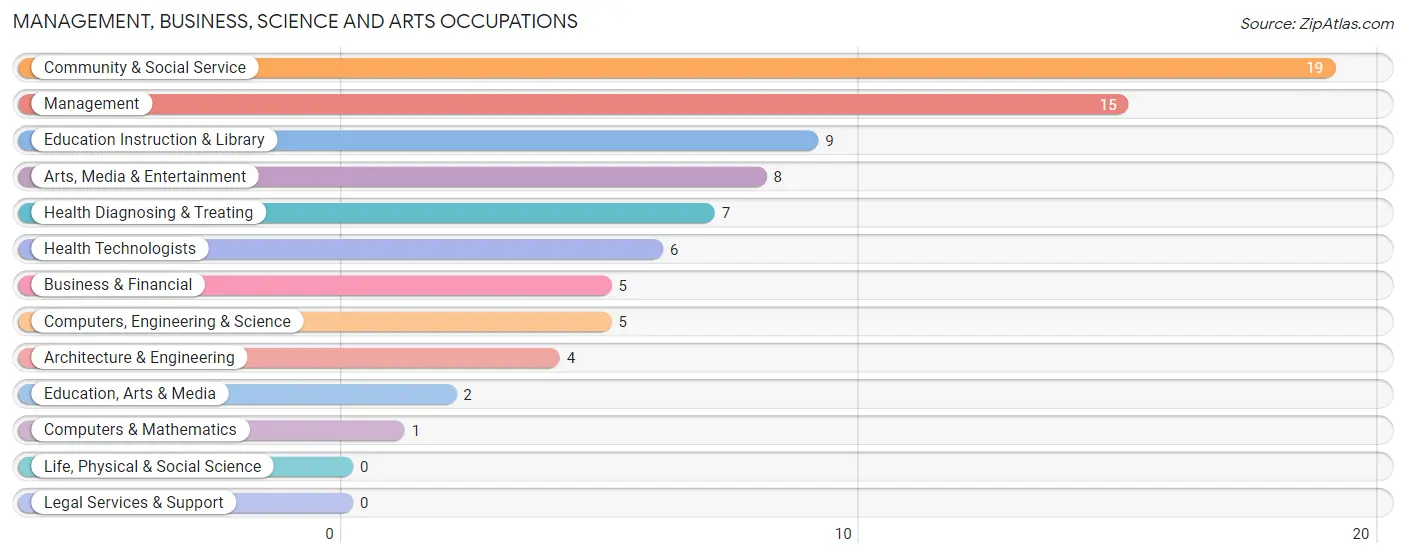
Management, Business, Science and Arts Occupations
The most common Management, Business, Science and Arts occupations in Ste Marie are Community & Social Service (19 | 13.9%), Management (15 | 11.0%), Education Instruction & Library (9 | 6.6%), Arts, Media & Entertainment (8 | 5.8%), and Health Diagnosing & Treating (7 | 5.1%).
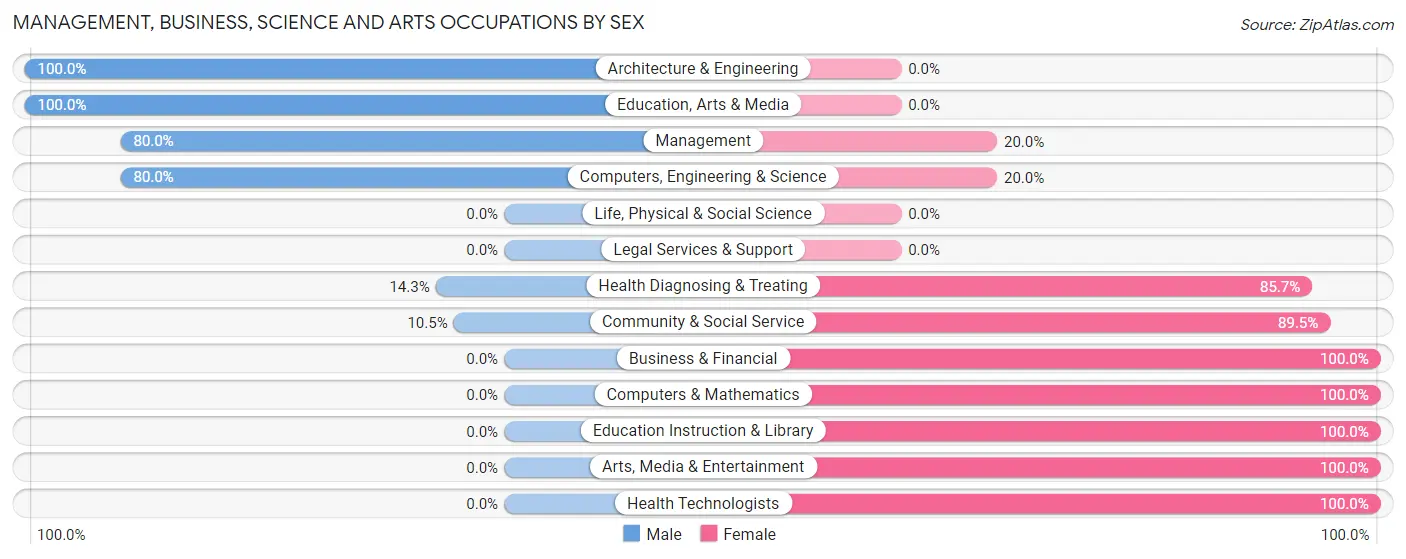
Management, Business, Science and Arts Occupations by Sex
Within the Management, Business, Science and Arts occupations in Ste Marie, the most male-oriented occupations are Architecture & Engineering (100.0%), Education, Arts & Media (100.0%), and Management (80.0%), while the most female-oriented occupations are Business & Financial (100.0%), Computers & Mathematics (100.0%), and Education Instruction & Library (100.0%).
| Occupation | Male | Female |
| Management | 12 (80.0%) | 3 (20.0%) |
| Business & Financial | 0 (0.0%) | 5 (100.0%) |
| Computers, Engineering & Science | 4 (80.0%) | 1 (20.0%) |
| Computers & Mathematics | 0 (0.0%) | 1 (100.0%) |
| Architecture & Engineering | 4 (100.0%) | 0 (0.0%) |
| Life, Physical & Social Science | 0 (0.0%) | 0 (0.0%) |
| Community & Social Service | 2 (10.5%) | 17 (89.5%) |
| Education, Arts & Media | 2 (100.0%) | 0 (0.0%) |
| Legal Services & Support | 0 (0.0%) | 0 (0.0%) |
| Education Instruction & Library | 0 (0.0%) | 9 (100.0%) |
| Arts, Media & Entertainment | 0 (0.0%) | 8 (100.0%) |
| Health Diagnosing & Treating | 1 (14.3%) | 6 (85.7%) |
| Health Technologists | 0 (0.0%) | 6 (100.0%) |
| Total (Category) | 19 (37.2%) | 32 (62.7%) |
| Total (Overall) | 69 (50.4%) | 68 (49.6%) |
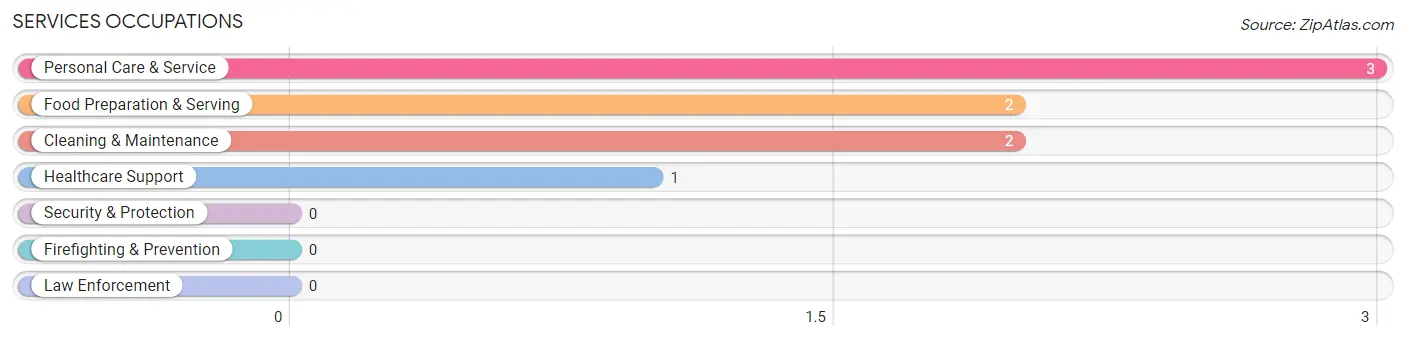
Services Occupations
The most common Services occupations in Ste Marie are Personal Care & Service (3 | 2.2%), Food Preparation & Serving (2 | 1.5%), Cleaning & Maintenance (2 | 1.5%), and Healthcare Support (1 | 0.7%).
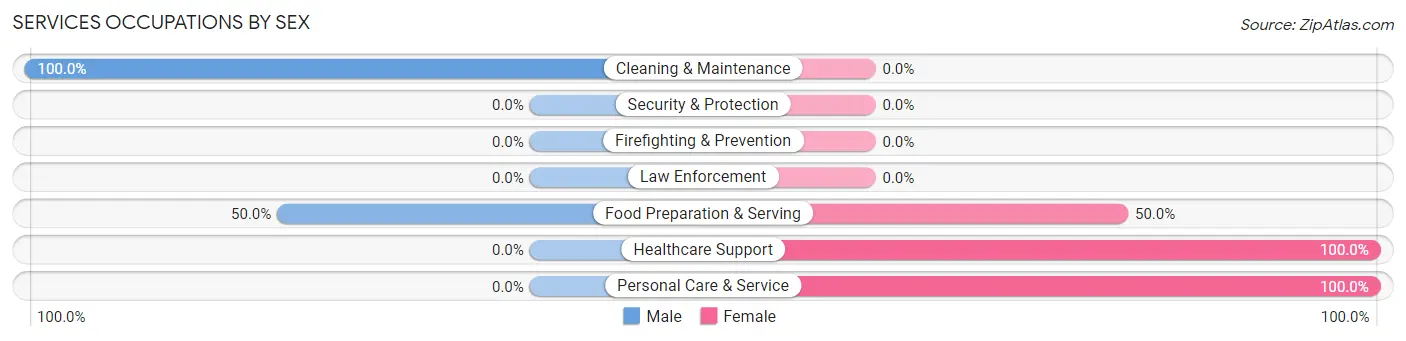
Services Occupations by Sex
Within the Services occupations in Ste Marie, the most male-oriented occupations are Cleaning & Maintenance (100.0%), and Food Preparation & Serving (50.0%), while the most female-oriented occupations are Healthcare Support (100.0%), Personal Care & Service (100.0%), and Food Preparation & Serving (50.0%).
| Occupation | Male | Female |
| Healthcare Support | 0 (0.0%) | 1 (100.0%) |
| Security & Protection | 0 (0.0%) | 0 (0.0%) |
| Firefighting & Prevention | 0 (0.0%) | 0 (0.0%) |
| Law Enforcement | 0 (0.0%) | 0 (0.0%) |
| Food Preparation & Serving | 1 (50.0%) | 1 (50.0%) |
| Cleaning & Maintenance | 2 (100.0%) | 0 (0.0%) |
| Personal Care & Service | 0 (0.0%) | 3 (100.0%) |
| Total (Category) | 3 (37.5%) | 5 (62.5%) |
| Total (Overall) | 69 (50.4%) | 68 (49.6%) |
Sales and Office Occupations
The most common Sales and Office occupations in Ste Marie are Office & Administration (20 | 14.6%), and Sales & Related (10 | 7.3%).
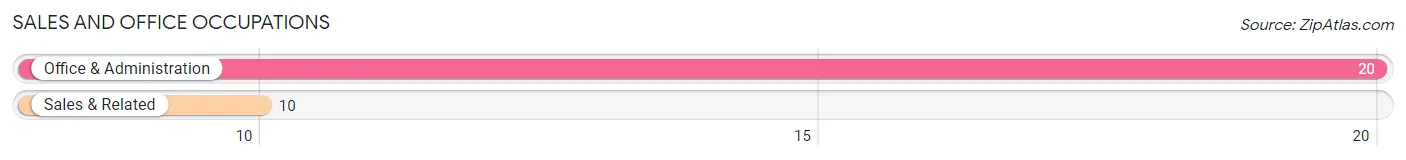
Sales and Office Occupations by Sex
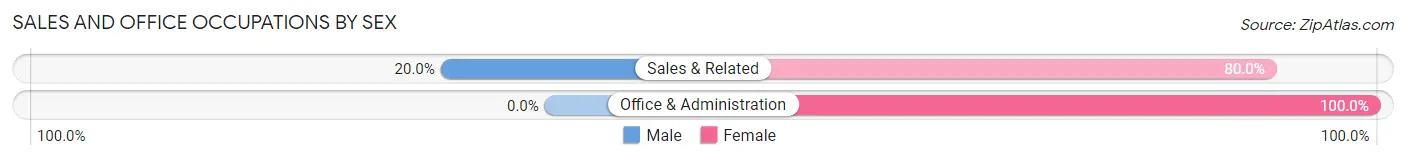
| Occupation | Male | Female |
| Sales & Related | 2 (20.0%) | 8 (80.0%) |
| Office & Administration | 0 (0.0%) | 20 (100.0%) |
| Total (Category) | 2 (6.7%) | 28 (93.3%) |
| Total (Overall) | 69 (50.4%) | 68 (49.6%) |
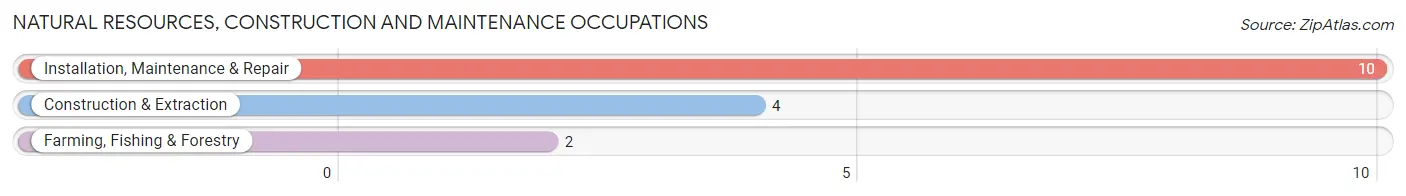
Natural Resources, Construction and Maintenance Occupations
The most common Natural Resources, Construction and Maintenance occupations in Ste Marie are Installation, Maintenance & Repair (10 | 7.3%), Construction & Extraction (4 | 2.9%), and Farming, Fishing & Forestry (2 | 1.5%).
Natural Resources, Construction and Maintenance Occupations by Sex
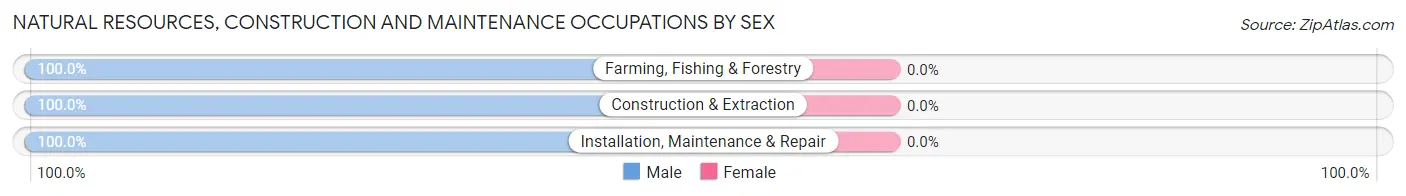
| Occupation | Male | Female |
| Farming, Fishing & Forestry | 2 (100.0%) | 0 (0.0%) |
| Construction & Extraction | 4 (100.0%) | 0 (0.0%) |
| Installation, Maintenance & Repair | 10 (100.0%) | 0 (0.0%) |
| Total (Category) | 16 (100.0%) | 0 (0.0%) |
| Total (Overall) | 69 (50.4%) | 68 (49.6%) |
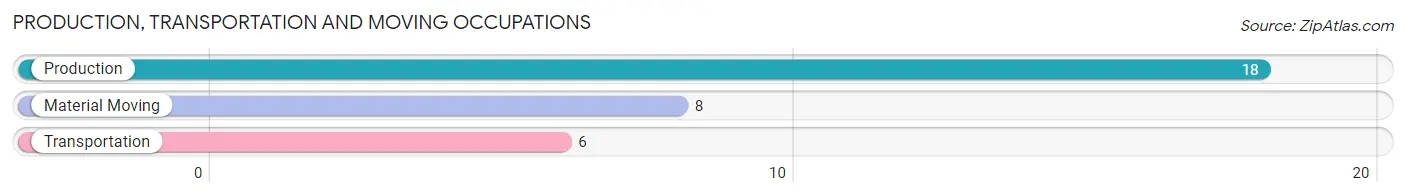
Production, Transportation and Moving Occupations
The most common Production, Transportation and Moving occupations in Ste Marie are Production (18 | 13.1%), Material Moving (8 | 5.8%), and Transportation (6 | 4.4%).
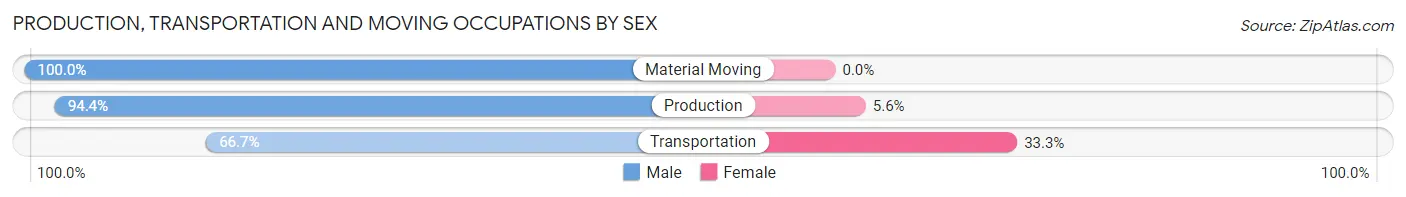
Production, Transportation and Moving Occupations by Sex
| Occupation | Male | Female |
| Production | 17 (94.4%) | 1 (5.6%) |
| Transportation | 4 (66.7%) | 2 (33.3%) |
| Material Moving | 8 (100.0%) | 0 (0.0%) |
| Total (Category) | 29 (90.6%) | 3 (9.4%) |
| Total (Overall) | 69 (50.4%) | 68 (49.6%) |
Employment Industries by Sex in Ste Marie
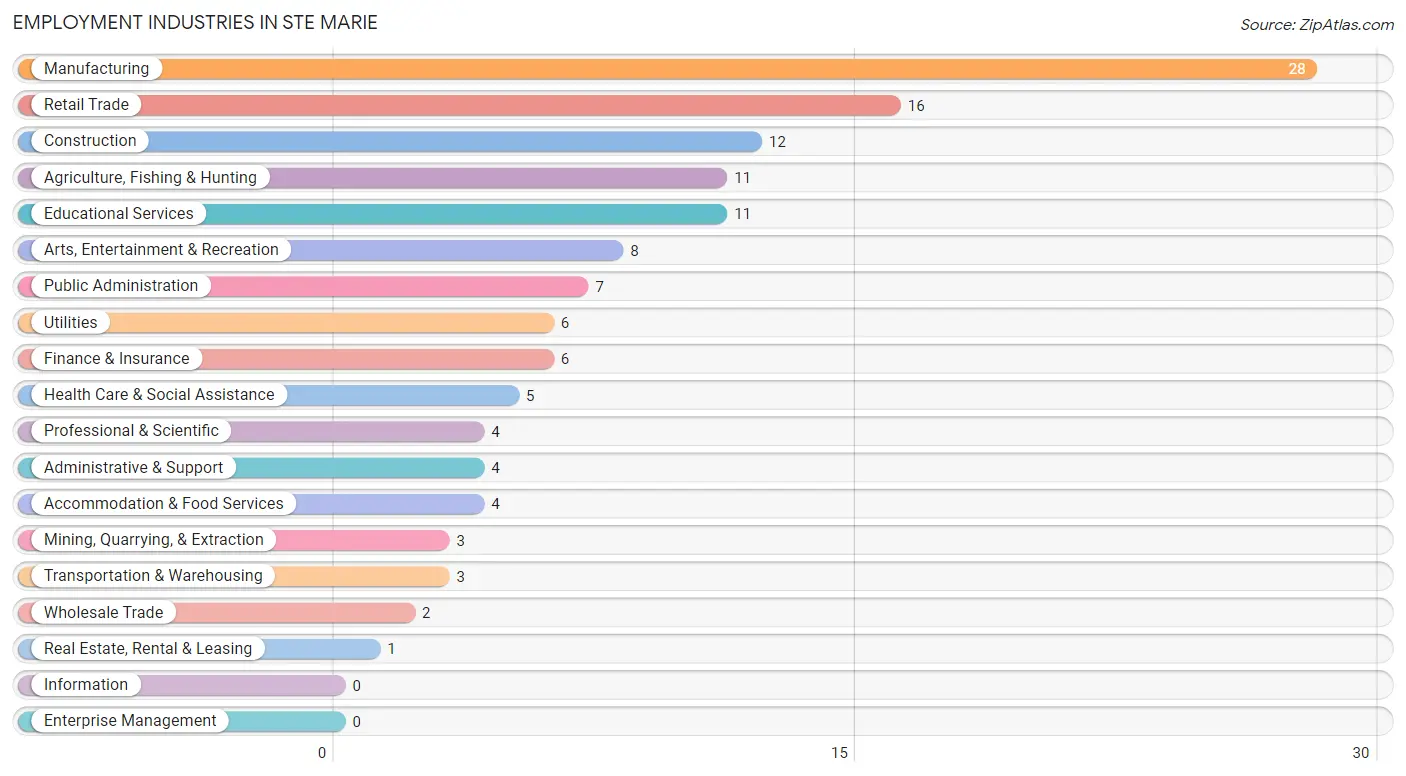
Employment Industries in Ste Marie
The major employment industries in Ste Marie include Manufacturing (28 | 20.4%), Retail Trade (16 | 11.7%), Construction (12 | 8.8%), Agriculture, Fishing & Hunting (11 | 8.0%), and Educational Services (11 | 8.0%).
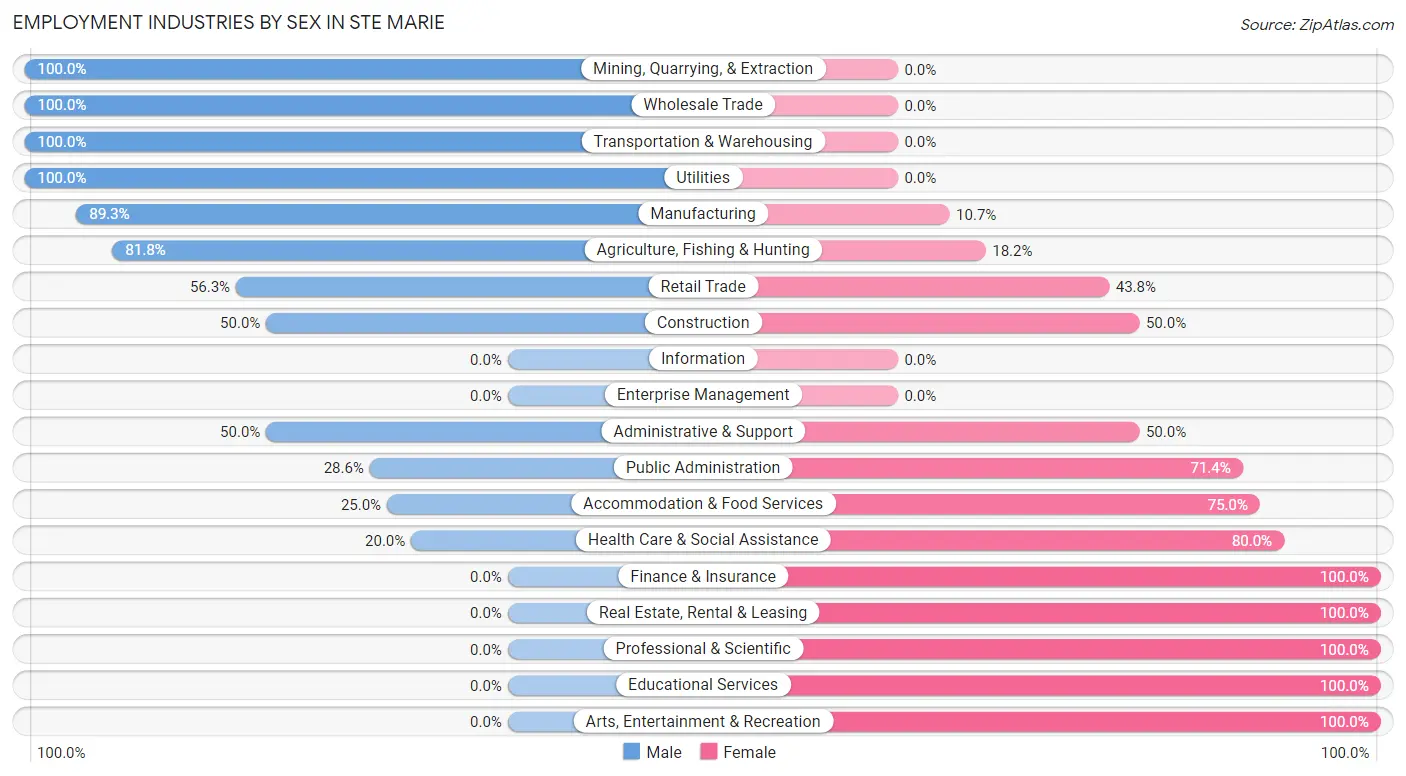
Employment Industries by Sex in Ste Marie
The Ste Marie industries that see more men than women are Mining, Quarrying, & Extraction (100.0%), Wholesale Trade (100.0%), and Transportation & Warehousing (100.0%), whereas the industries that tend to have a higher number of women are Finance & Insurance (100.0%), Real Estate, Rental & Leasing (100.0%), and Professional & Scientific (100.0%).
| Industry | Male | Female |
| Agriculture, Fishing & Hunting | 9 (81.8%) | 2 (18.2%) |
| Mining, Quarrying, & Extraction | 3 (100.0%) | 0 (0.0%) |
| Construction | 6 (50.0%) | 6 (50.0%) |
| Manufacturing | 25 (89.3%) | 3 (10.7%) |
| Wholesale Trade | 2 (100.0%) | 0 (0.0%) |
| Retail Trade | 9 (56.2%) | 7 (43.8%) |
| Transportation & Warehousing | 3 (100.0%) | 0 (0.0%) |
| Utilities | 6 (100.0%) | 0 (0.0%) |
| Information | 0 (0.0%) | 0 (0.0%) |
| Finance & Insurance | 0 (0.0%) | 6 (100.0%) |
| Real Estate, Rental & Leasing | 0 (0.0%) | 1 (100.0%) |
| Professional & Scientific | 0 (0.0%) | 4 (100.0%) |
| Enterprise Management | 0 (0.0%) | 0 (0.0%) |
| Administrative & Support | 2 (50.0%) | 2 (50.0%) |
| Educational Services | 0 (0.0%) | 11 (100.0%) |
| Health Care & Social Assistance | 1 (20.0%) | 4 (80.0%) |
| Arts, Entertainment & Recreation | 0 (0.0%) | 8 (100.0%) |
| Accommodation & Food Services | 1 (25.0%) | 3 (75.0%) |
| Public Administration | 2 (28.6%) | 5 (71.4%) |
| Total | 69 (50.4%) | 68 (49.6%) |
Education in Ste Marie
School Enrollment in Ste Marie
The most common levels of schooling among the 94 students in Ste Marie are elementary school (31 | 33.0%), middle school (26 | 27.7%), and high school (11 | 11.7%).
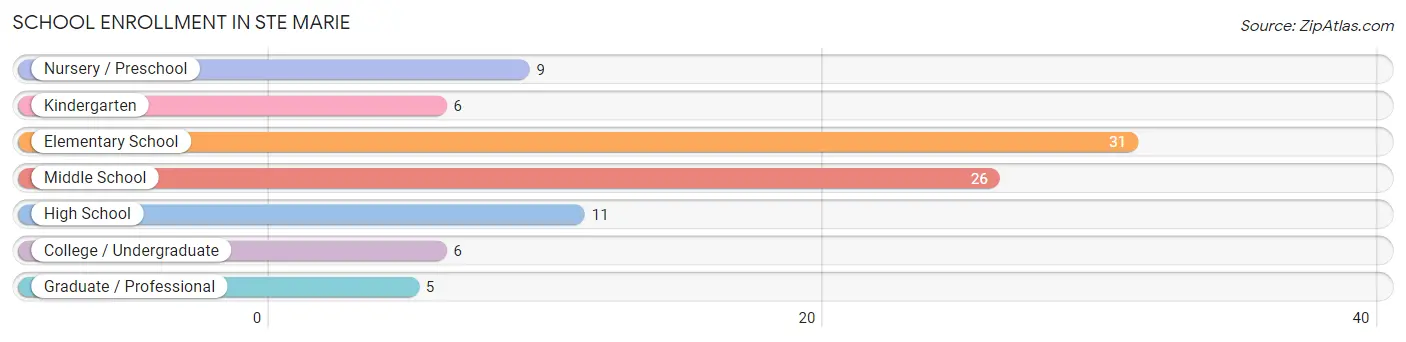
| School Level | # Students | % Students |
| Nursery / Preschool | 9 | 9.6% |
| Kindergarten | 6 | 6.4% |
| Elementary School | 31 | 33.0% |
| Middle School | 26 | 27.7% |
| High School | 11 | 11.7% |
| College / Undergraduate | 6 | 6.4% |
| Graduate / Professional | 5 | 5.3% |
| Total | 94 | 100.0% |
School Enrollment by Age by Funding Source in Ste Marie
Out of a total of 94 students who are enrolled in schools in Ste Marie, 7 (7.4%) attend a private institution, while the remaining 87 (92.6%) are enrolled in public schools. The age group of 20 to 24 year olds has the highest likelihood of being enrolled in private schools, with 5 (71.4% in the age bracket) enrolled. Conversely, the age group of 3 to 4 year olds has the lowest likelihood of being enrolled in a private school, with 8 (100.0% in the age bracket) attending a public institution.
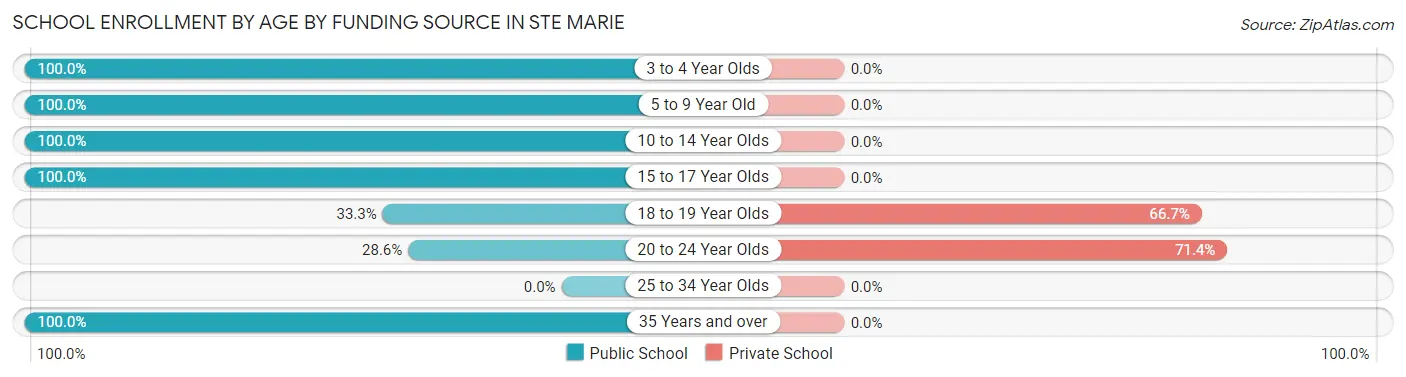
| Age Bracket | Public School | Private School |
| 3 to 4 Year Olds | 8 (100.0%) | 0 (0.0%) |
| 5 to 9 Year Old | 23 (100.0%) | 0 (0.0%) |
| 10 to 14 Year Olds | 41 (100.0%) | 0 (0.0%) |
| 15 to 17 Year Olds | 10 (100.0%) | 0 (0.0%) |
| 18 to 19 Year Olds | 1 (33.3%) | 2 (66.7%) |
| 20 to 24 Year Olds | 2 (28.6%) | 5 (71.4%) |
| 25 to 34 Year Olds | 0 (0.0%) | 0 (0.0%) |
| 35 Years and over | 2 (100.0%) | 0 (0.0%) |
| Total | 87 (92.6%) | 7 (7.4%) |
Educational Attainment by Field of Study in Ste Marie
Bio, nature & agricultural (12 | 31.6%), computers & mathematics (7 | 18.4%), business (7 | 18.4%), education (7 | 18.4%), and science & technology (3 | 7.9%) are the most common fields of study among 38 individuals in Ste Marie who have obtained a bachelor's degree or higher.
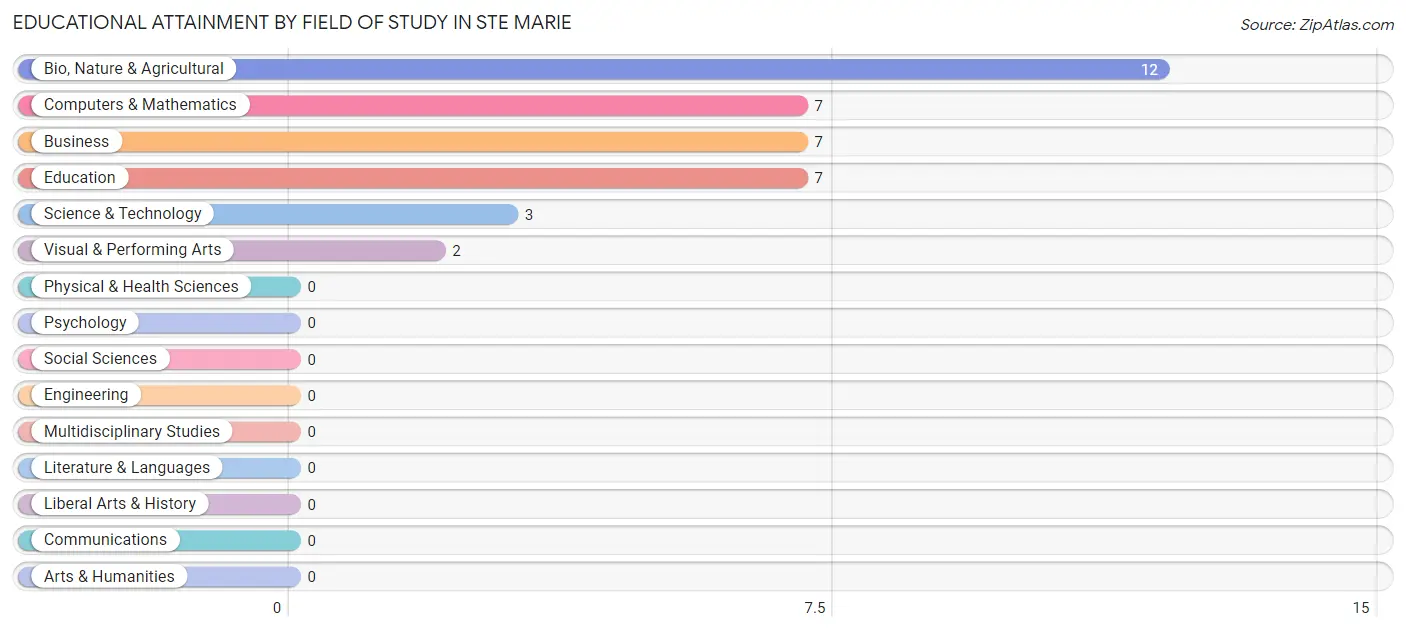
| Field of Study | # Graduates | % Graduates |
| Computers & Mathematics | 7 | 18.4% |
| Bio, Nature & Agricultural | 12 | 31.6% |
| Physical & Health Sciences | 0 | 0.0% |
| Psychology | 0 | 0.0% |
| Social Sciences | 0 | 0.0% |
| Engineering | 0 | 0.0% |
| Multidisciplinary Studies | 0 | 0.0% |
| Science & Technology | 3 | 7.9% |
| Business | 7 | 18.4% |
| Education | 7 | 18.4% |
| Literature & Languages | 0 | 0.0% |
| Liberal Arts & History | 0 | 0.0% |
| Visual & Performing Arts | 2 | 5.3% |
| Communications | 0 | 0.0% |
| Arts & Humanities | 0 | 0.0% |
| Total | 38 | 100.0% |
Transportation & Commute in Ste Marie
Vehicle Availability by Sex in Ste Marie
The most prevalent vehicle ownership categories in Ste Marie are males with 3 vehicles (33, accounting for 48.5%) and females with 3 vehicles (32, making up 49.2%).
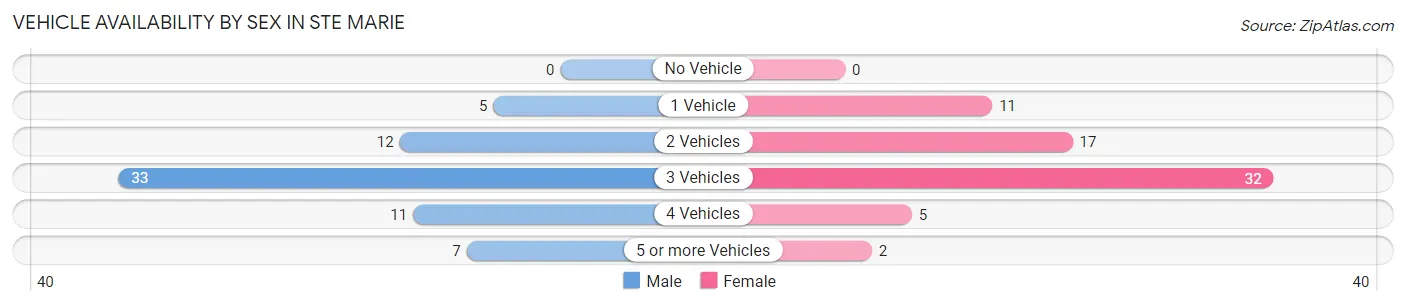
| Vehicles Available | Male | Female |
| No Vehicle | 0 (0.0%) | 0 (0.0%) |
| 1 Vehicle | 5 (7.3%) | 11 (16.4%) |
| 2 Vehicles | 12 (17.6%) | 17 (25.4%) |
| 3 Vehicles | 33 (48.5%) | 32 (47.8%) |
| 4 Vehicles | 11 (16.2%) | 5 (7.5%) |
| 5 or more Vehicles | 7 (10.3%) | 2 (3.0%) |
| Total | 68 (100.0%) | 67 (100.0%) |
Commute Time in Ste Marie
The most frequently occuring commute durations in Ste Marie are 10 to 14 minutes (29 commuters, 22.5%), less than 5 minutes (23 commuters, 17.8%), and 15 to 19 minutes (14 commuters, 10.8%).
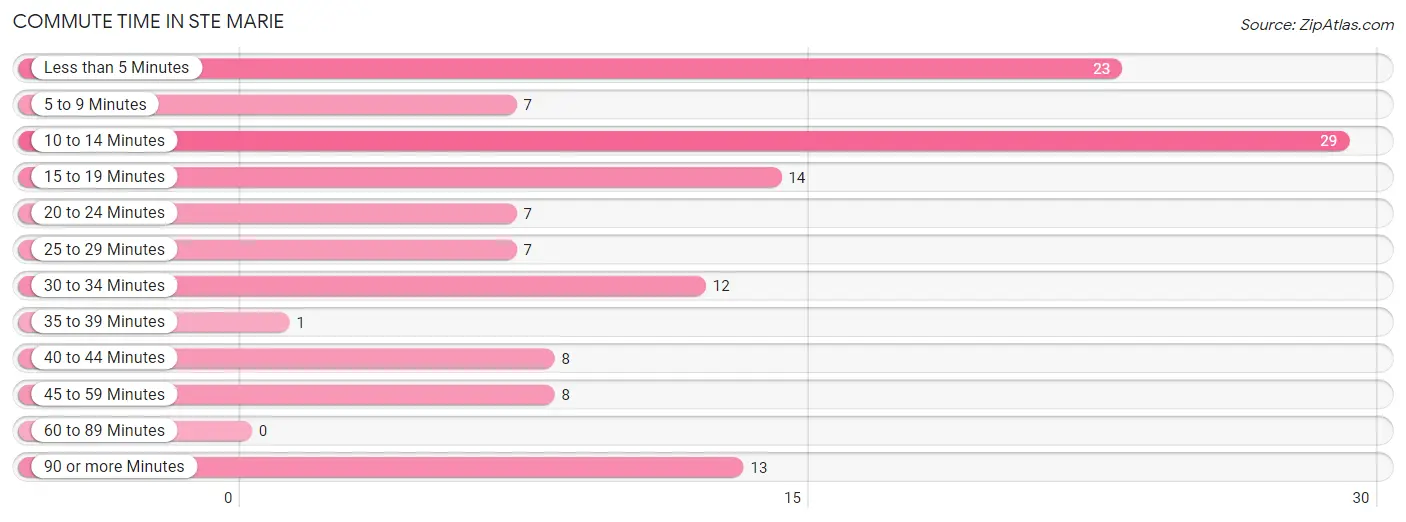
| Commute Time | # Commuters | % Commuters |
| Less than 5 Minutes | 23 | 17.8% |
| 5 to 9 Minutes | 7 | 5.4% |
| 10 to 14 Minutes | 29 | 22.5% |
| 15 to 19 Minutes | 14 | 10.8% |
| 20 to 24 Minutes | 7 | 5.4% |
| 25 to 29 Minutes | 7 | 5.4% |
| 30 to 34 Minutes | 12 | 9.3% |
| 35 to 39 Minutes | 1 | 0.8% |
| 40 to 44 Minutes | 8 | 6.2% |
| 45 to 59 Minutes | 8 | 6.2% |
| 60 to 89 Minutes | 0 | 0.0% |
| 90 or more Minutes | 13 | 10.1% |
Commute Time by Sex in Ste Marie
The most common commute times in Ste Marie are 90 or more minutes (11 commuters, 16.7%) for males and 10 to 14 minutes (20 commuters, 31.8%) for females.
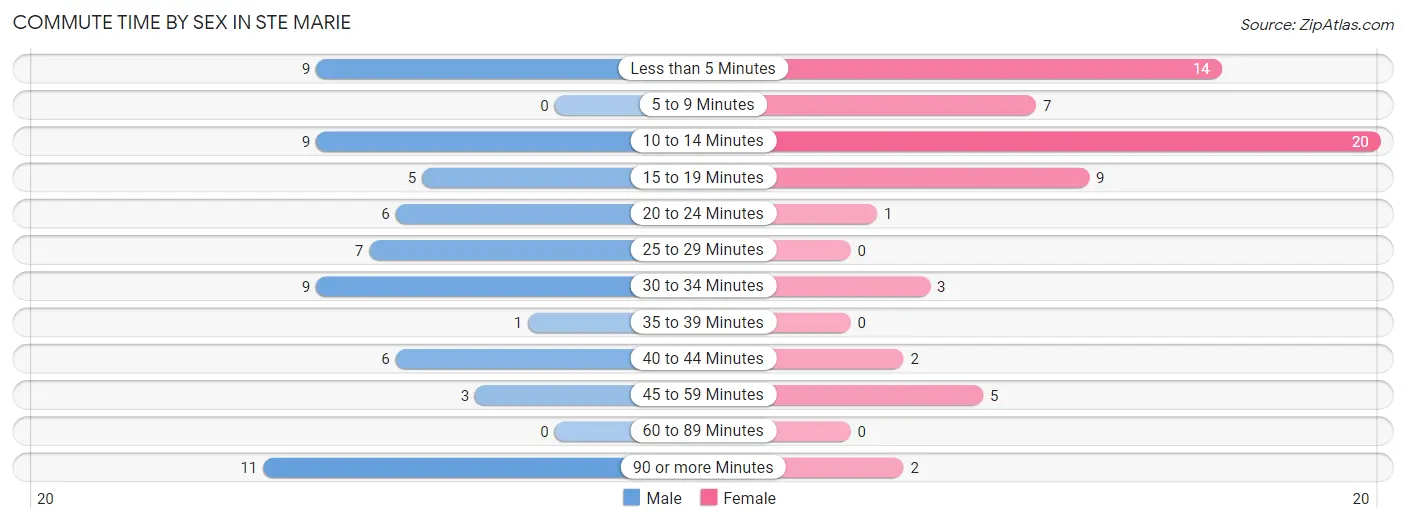
| Commute Time | Male | Female |
| Less than 5 Minutes | 9 (13.6%) | 14 (22.2%) |
| 5 to 9 Minutes | 0 (0.0%) | 7 (11.1%) |
| 10 to 14 Minutes | 9 (13.6%) | 20 (31.8%) |
| 15 to 19 Minutes | 5 (7.6%) | 9 (14.3%) |
| 20 to 24 Minutes | 6 (9.1%) | 1 (1.6%) |
| 25 to 29 Minutes | 7 (10.6%) | 0 (0.0%) |
| 30 to 34 Minutes | 9 (13.6%) | 3 (4.8%) |
| 35 to 39 Minutes | 1 (1.5%) | 0 (0.0%) |
| 40 to 44 Minutes | 6 (9.1%) | 2 (3.2%) |
| 45 to 59 Minutes | 3 (4.5%) | 5 (7.9%) |
| 60 to 89 Minutes | 0 (0.0%) | 0 (0.0%) |
| 90 or more Minutes | 11 (16.7%) | 2 (3.2%) |
Time of Departure to Work by Sex in Ste Marie
The most frequent times of departure to work in Ste Marie are 6:00 AM to 6:29 AM (19, 28.8%) for males and 7:30 AM to 7:59 AM (31, 49.2%) for females.
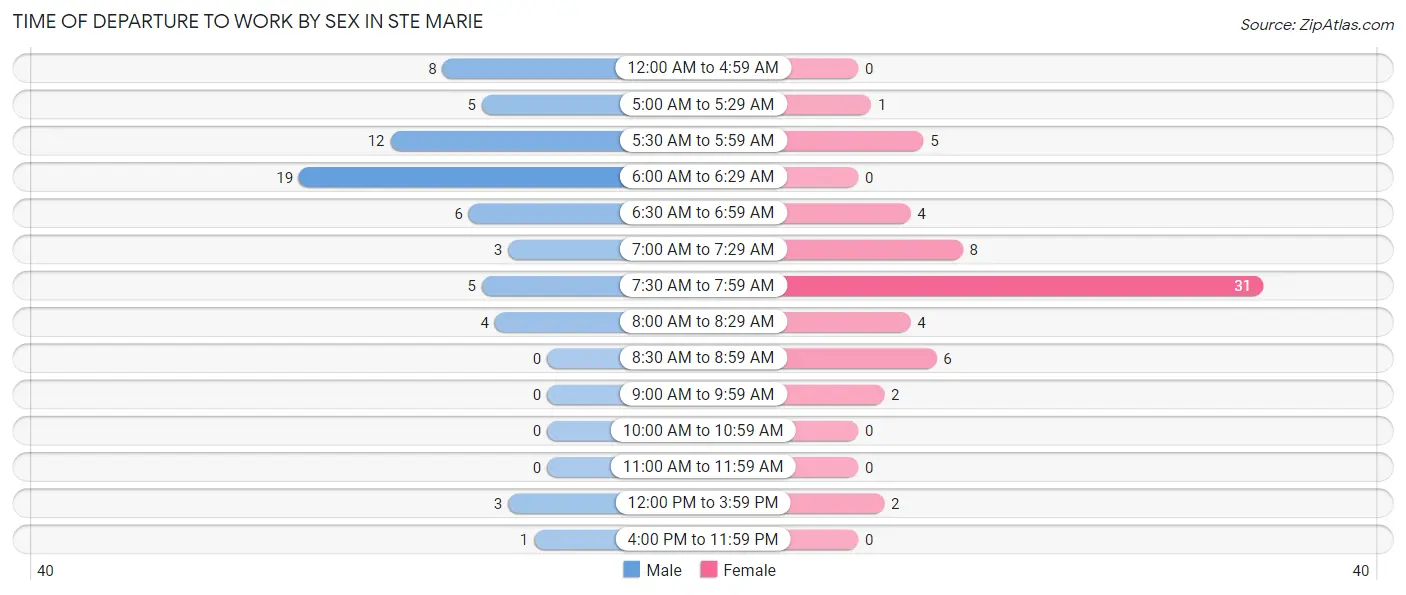
| Time of Departure | Male | Female |
| 12:00 AM to 4:59 AM | 8 (12.1%) | 0 (0.0%) |
| 5:00 AM to 5:29 AM | 5 (7.6%) | 1 (1.6%) |
| 5:30 AM to 5:59 AM | 12 (18.2%) | 5 (7.9%) |
| 6:00 AM to 6:29 AM | 19 (28.8%) | 0 (0.0%) |
| 6:30 AM to 6:59 AM | 6 (9.1%) | 4 (6.4%) |
| 7:00 AM to 7:29 AM | 3 (4.5%) | 8 (12.7%) |
| 7:30 AM to 7:59 AM | 5 (7.6%) | 31 (49.2%) |
| 8:00 AM to 8:29 AM | 4 (6.1%) | 4 (6.4%) |
| 8:30 AM to 8:59 AM | 0 (0.0%) | 6 (9.5%) |
| 9:00 AM to 9:59 AM | 0 (0.0%) | 2 (3.2%) |
| 10:00 AM to 10:59 AM | 0 (0.0%) | 0 (0.0%) |
| 11:00 AM to 11:59 AM | 0 (0.0%) | 0 (0.0%) |
| 12:00 PM to 3:59 PM | 3 (4.5%) | 2 (3.2%) |
| 4:00 PM to 11:59 PM | 1 (1.5%) | 0 (0.0%) |
| Total | 66 (100.0%) | 63 (100.0%) |
Housing Occupancy in Ste Marie
Occupancy by Ownership in Ste Marie
Of the total 89 dwellings in Ste Marie, owner-occupied units account for 84 (94.4%), while renter-occupied units make up 5 (5.6%).
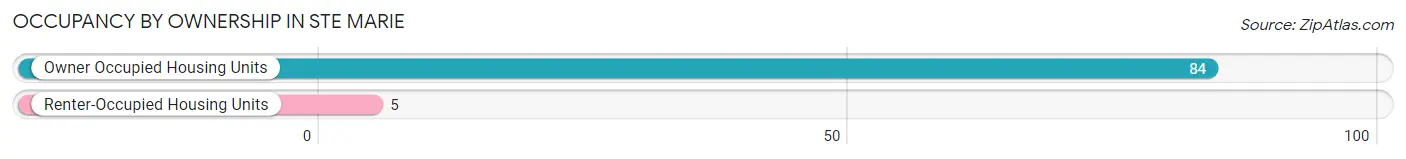
| Occupancy | # Housing Units | % Housing Units |
| Owner Occupied Housing Units | 84 | 94.4% |
| Renter-Occupied Housing Units | 5 | 5.6% |
| Total Occupied Housing Units | 89 | 100.0% |
Occupancy by Household Size in Ste Marie
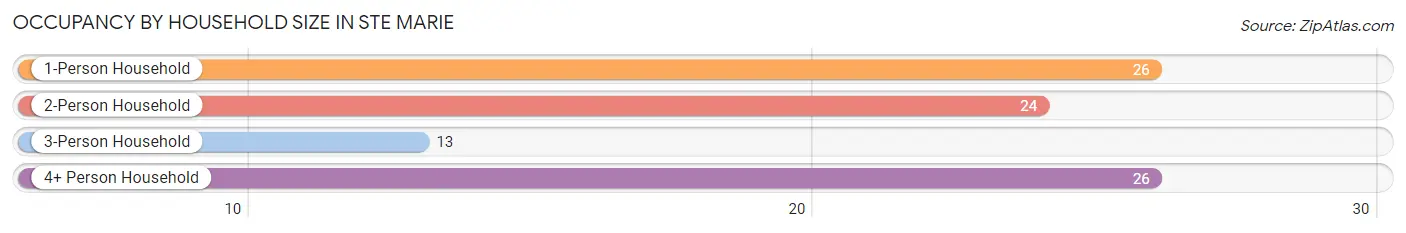
| Household Size | # Housing Units | % Housing Units |
| 1-Person Household | 26 | 29.2% |
| 2-Person Household | 24 | 27.0% |
| 3-Person Household | 13 | 14.6% |
| 4+ Person Household | 26 | 29.2% |
| Total Housing Units | 89 | 100.0% |
Occupancy by Ownership by Household Size in Ste Marie
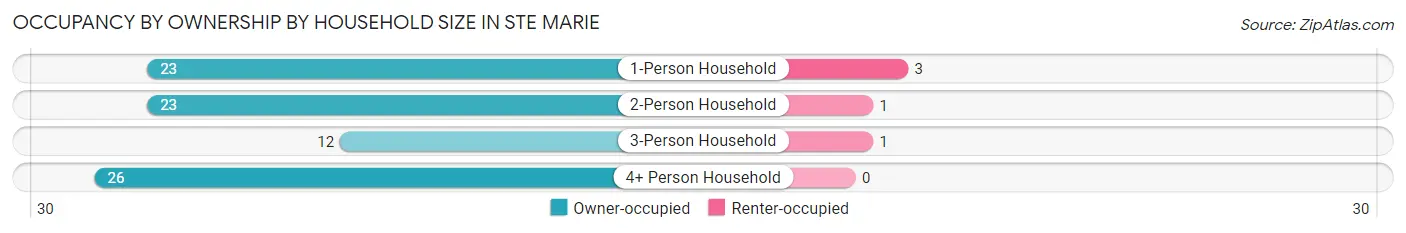
| Household Size | Owner-occupied | Renter-occupied |
| 1-Person Household | 23 (88.5%) | 3 (11.5%) |
| 2-Person Household | 23 (95.8%) | 1 (4.2%) |
| 3-Person Household | 12 (92.3%) | 1 (7.7%) |
| 4+ Person Household | 26 (100.0%) | 0 (0.0%) |
| Total Housing Units | 84 (94.4%) | 5 (5.6%) |
Occupancy by Educational Attainment in Ste Marie
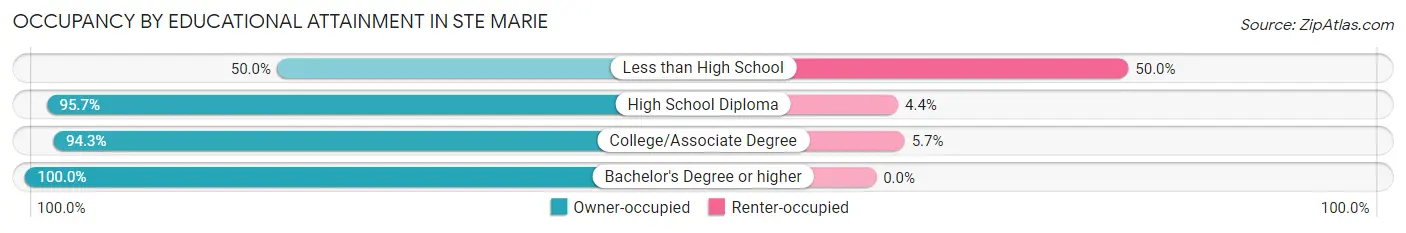
| Household Size | Owner-occupied | Renter-occupied |
| Less than High School | 1 (50.0%) | 1 (50.0%) |
| High School Diploma | 22 (95.7%) | 1 (4.3%) |
| College/Associate Degree | 50 (94.3%) | 3 (5.7%) |
| Bachelor's Degree or higher | 11 (100.0%) | 0 (0.0%) |
Occupancy by Age of Householder in Ste Marie
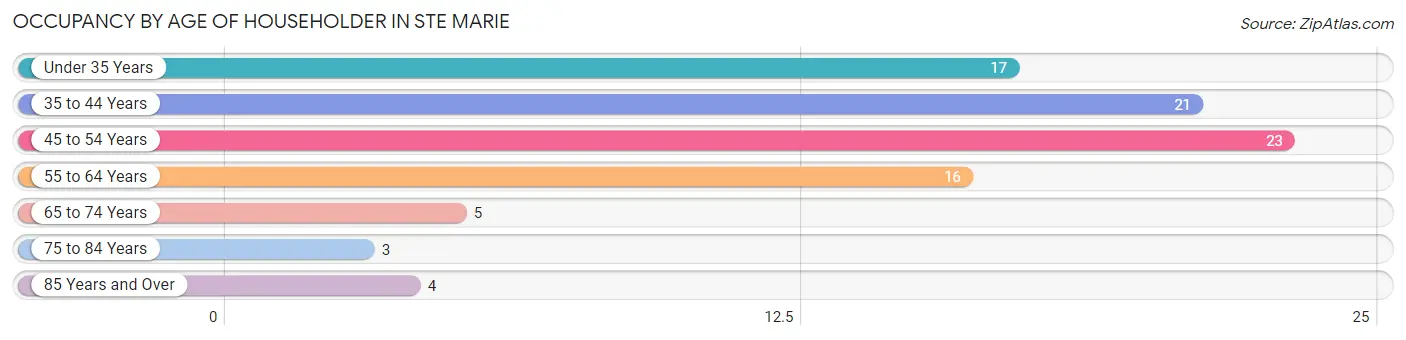
| Age Bracket | # Households | % Households |
| Under 35 Years | 17 | 19.1% |
| 35 to 44 Years | 21 | 23.6% |
| 45 to 54 Years | 23 | 25.8% |
| 55 to 64 Years | 16 | 18.0% |
| 65 to 74 Years | 5 | 5.6% |
| 75 to 84 Years | 3 | 3.4% |
| 85 Years and Over | 4 | 4.5% |
| Total | 89 | 100.0% |
Housing Finances in Ste Marie
Median Income by Occupancy in Ste Marie
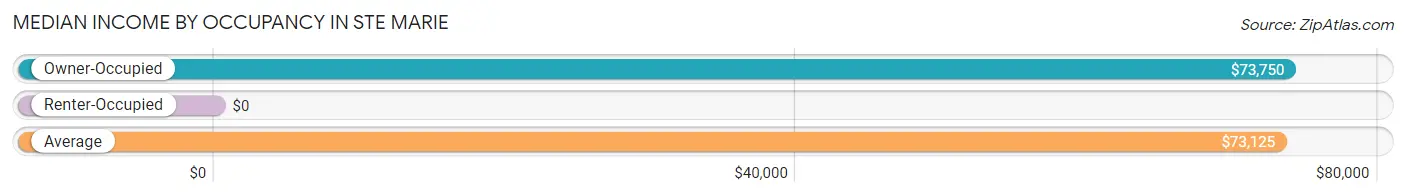
| Occupancy Type | # Households | Median Income |
| Owner-Occupied | 84 (94.4%) | $73,750 |
| Renter-Occupied | 5 (5.6%) | $0 |
| Average | 89 (100.0%) | $73,125 |
Occupancy by Householder Income Bracket in Ste Marie
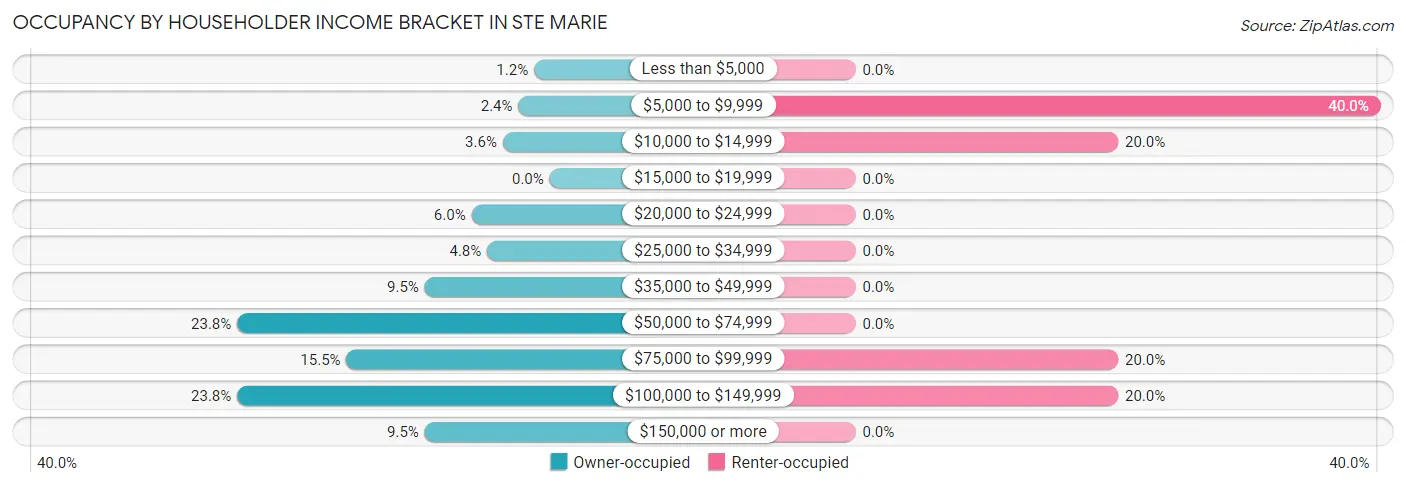
| Income Bracket | Owner-occupied | Renter-occupied |
| Less than $5,000 | 1 (1.2%) | 0 (0.0%) |
| $5,000 to $9,999 | 2 (2.4%) | 2 (40.0%) |
| $10,000 to $14,999 | 3 (3.6%) | 1 (20.0%) |
| $15,000 to $19,999 | 0 (0.0%) | 0 (0.0%) |
| $20,000 to $24,999 | 5 (5.9%) | 0 (0.0%) |
| $25,000 to $34,999 | 4 (4.8%) | 0 (0.0%) |
| $35,000 to $49,999 | 8 (9.5%) | 0 (0.0%) |
| $50,000 to $74,999 | 20 (23.8%) | 0 (0.0%) |
| $75,000 to $99,999 | 13 (15.5%) | 1 (20.0%) |
| $100,000 to $149,999 | 20 (23.8%) | 1 (20.0%) |
| $150,000 or more | 8 (9.5%) | 0 (0.0%) |
| Total | 84 (100.0%) | 5 (100.0%) |
Monthly Housing Cost Tiers in Ste Marie
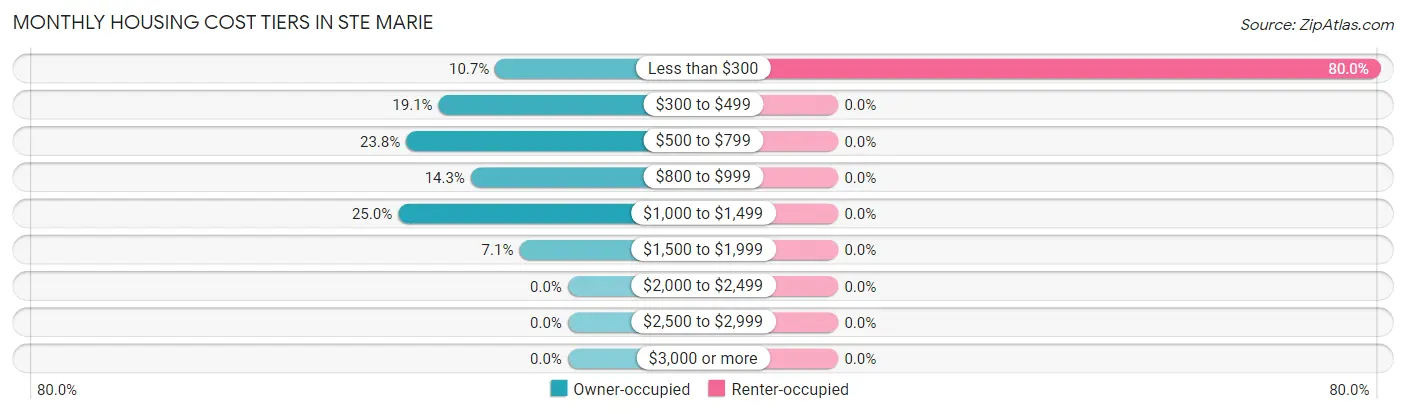
| Monthly Cost | Owner-occupied | Renter-occupied |
| Less than $300 | 9 (10.7%) | 4 (80.0%) |
| $300 to $499 | 16 (19.1%) | 0 (0.0%) |
| $500 to $799 | 20 (23.8%) | 0 (0.0%) |
| $800 to $999 | 12 (14.3%) | 0 (0.0%) |
| $1,000 to $1,499 | 21 (25.0%) | 0 (0.0%) |
| $1,500 to $1,999 | 6 (7.1%) | 0 (0.0%) |
| $2,000 to $2,499 | 0 (0.0%) | 0 (0.0%) |
| $2,500 to $2,999 | 0 (0.0%) | 0 (0.0%) |
| $3,000 or more | 0 (0.0%) | 0 (0.0%) |
| Total | 84 (100.0%) | 5 (100.0%) |
Physical Housing Characteristics in Ste Marie
Housing Structures in Ste Marie
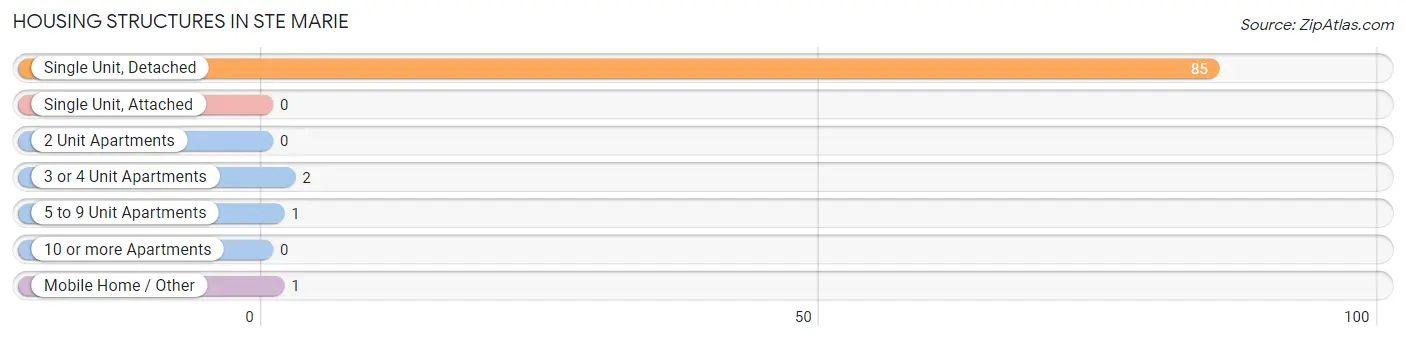
| Structure Type | # Housing Units | % Housing Units |
| Single Unit, Detached | 85 | 95.5% |
| Single Unit, Attached | 0 | 0.0% |
| 2 Unit Apartments | 0 | 0.0% |
| 3 or 4 Unit Apartments | 2 | 2.2% |
| 5 to 9 Unit Apartments | 1 | 1.1% |
| 10 or more Apartments | 0 | 0.0% |
| Mobile Home / Other | 1 | 1.1% |
| Total | 89 | 100.0% |
Housing Structures by Occupancy in Ste Marie
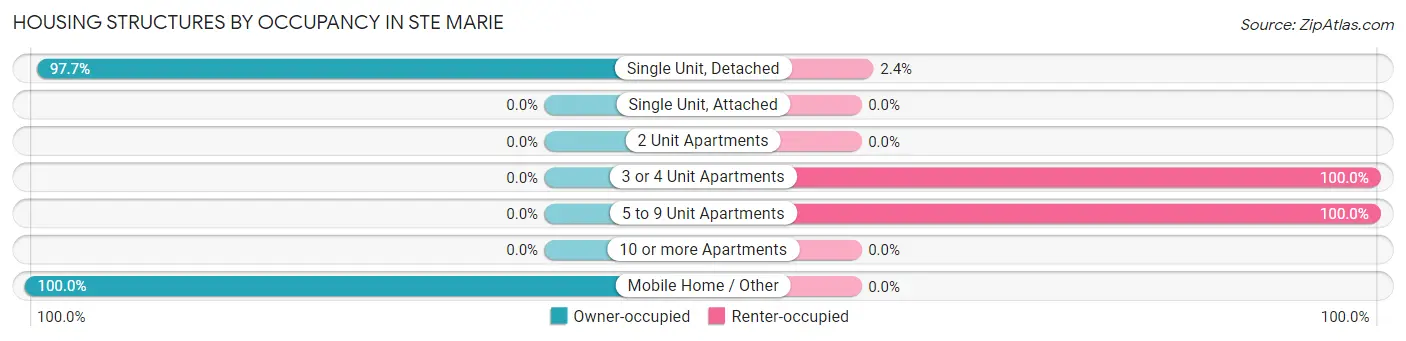
| Structure Type | Owner-occupied | Renter-occupied |
| Single Unit, Detached | 83 (97.7%) | 2 (2.4%) |
| Single Unit, Attached | 0 (0.0%) | 0 (0.0%) |
| 2 Unit Apartments | 0 (0.0%) | 0 (0.0%) |
| 3 or 4 Unit Apartments | 0 (0.0%) | 2 (100.0%) |
| 5 to 9 Unit Apartments | 0 (0.0%) | 1 (100.0%) |
| 10 or more Apartments | 0 (0.0%) | 0 (0.0%) |
| Mobile Home / Other | 1 (100.0%) | 0 (0.0%) |
| Total | 84 (94.4%) | 5 (5.6%) |
Housing Structures by Number of Rooms in Ste Marie
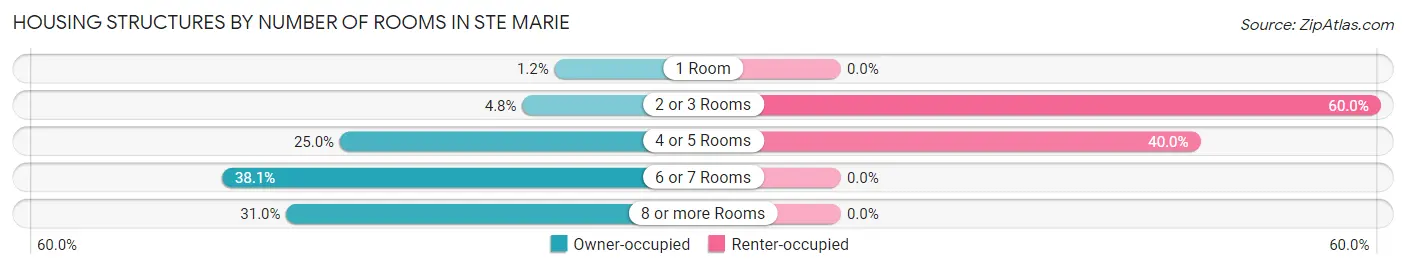
| Number of Rooms | Owner-occupied | Renter-occupied |
| 1 Room | 1 (1.2%) | 0 (0.0%) |
| 2 or 3 Rooms | 4 (4.8%) | 3 (60.0%) |
| 4 or 5 Rooms | 21 (25.0%) | 2 (40.0%) |
| 6 or 7 Rooms | 32 (38.1%) | 0 (0.0%) |
| 8 or more Rooms | 26 (30.9%) | 0 (0.0%) |
| Total | 84 (100.0%) | 5 (100.0%) |
Housing Structure by Heating Type in Ste Marie
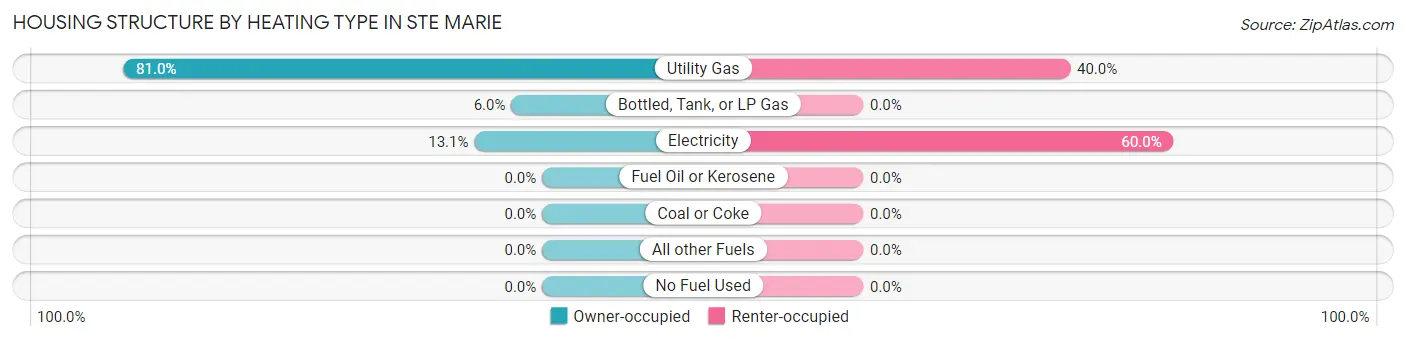
| Heating Type | Owner-occupied | Renter-occupied |
| Utility Gas | 68 (80.9%) | 2 (40.0%) |
| Bottled, Tank, or LP Gas | 5 (5.9%) | 0 (0.0%) |
| Electricity | 11 (13.1%) | 3 (60.0%) |
| Fuel Oil or Kerosene | 0 (0.0%) | 0 (0.0%) |
| Coal or Coke | 0 (0.0%) | 0 (0.0%) |
| All other Fuels | 0 (0.0%) | 0 (0.0%) |
| No Fuel Used | 0 (0.0%) | 0 (0.0%) |
| Total | 84 (100.0%) | 5 (100.0%) |
Household Vehicle Usage in Ste Marie
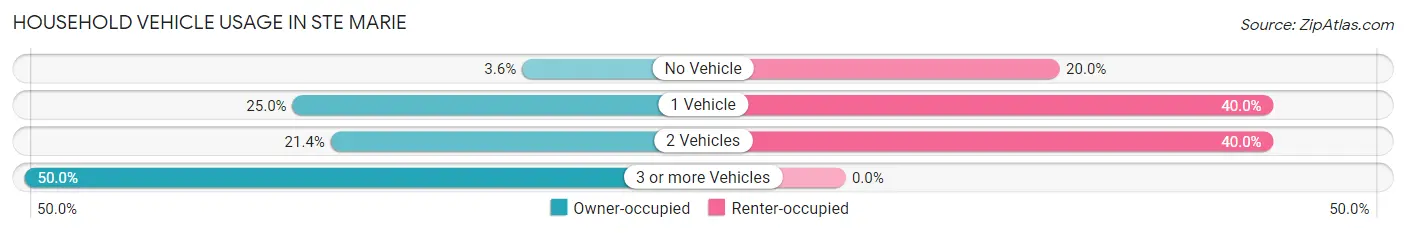
| Vehicles per Household | Owner-occupied | Renter-occupied |
| No Vehicle | 3 (3.6%) | 1 (20.0%) |
| 1 Vehicle | 21 (25.0%) | 2 (40.0%) |
| 2 Vehicles | 18 (21.4%) | 2 (40.0%) |
| 3 or more Vehicles | 42 (50.0%) | 0 (0.0%) |
| Total | 84 (100.0%) | 5 (100.0%) |
Real Estate & Mortgages in Ste Marie
Real Estate and Mortgage Overview in Ste Marie
| Characteristic | Without Mortgage | With Mortgage |
| Housing Units | 33 | 51 |
| Median Property Value | $82,500 | $112,500 |
| Median Household Income | $53,750 | $5 |
| Monthly Housing Costs | $442 | $0 |
| Real Estate Taxes | $1,500 | $0 |
Property Value by Mortgage Status in Ste Marie
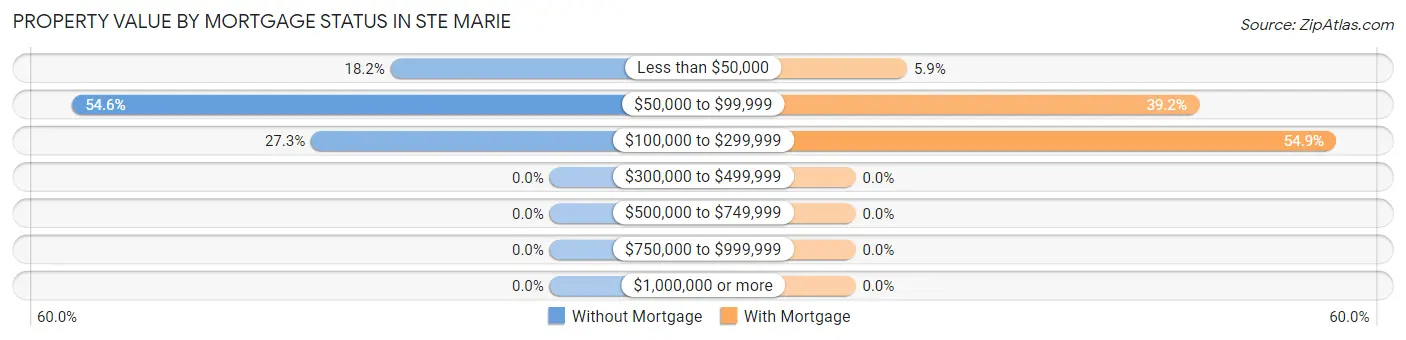
| Property Value | Without Mortgage | With Mortgage |
| Less than $50,000 | 6 (18.2%) | 3 (5.9%) |
| $50,000 to $99,999 | 18 (54.5%) | 20 (39.2%) |
| $100,000 to $299,999 | 9 (27.3%) | 28 (54.9%) |
| $300,000 to $499,999 | 0 (0.0%) | 0 (0.0%) |
| $500,000 to $749,999 | 0 (0.0%) | 0 (0.0%) |
| $750,000 to $999,999 | 0 (0.0%) | 0 (0.0%) |
| $1,000,000 or more | 0 (0.0%) | 0 (0.0%) |
| Total | 33 (100.0%) | 51 (100.0%) |
Household Income by Mortgage Status in Ste Marie
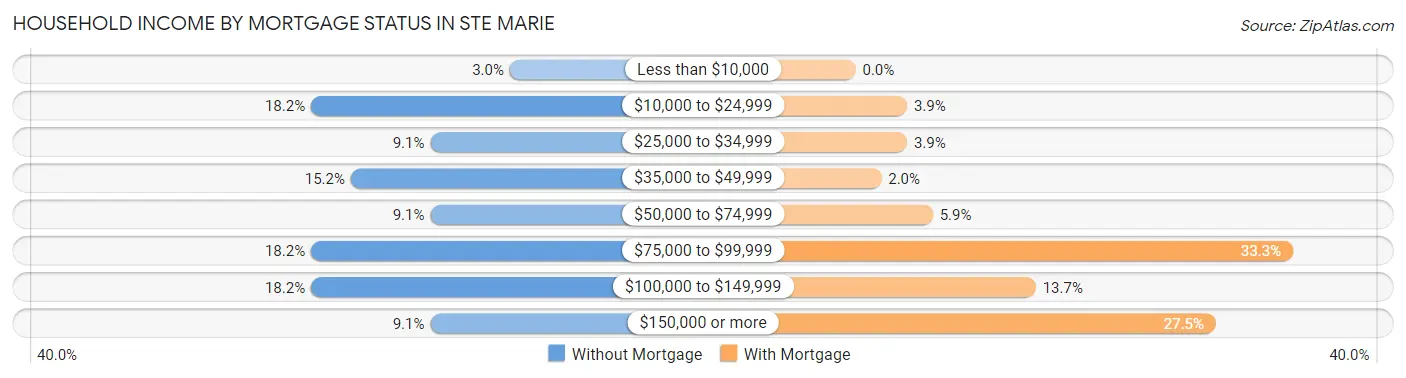
| Household Income | Without Mortgage | With Mortgage |
| Less than $10,000 | 1 (3.0%) | 0 (0.0%) |
| $10,000 to $24,999 | 6 (18.2%) | 2 (3.9%) |
| $25,000 to $34,999 | 3 (9.1%) | 2 (3.9%) |
| $35,000 to $49,999 | 5 (15.1%) | 1 (2.0%) |
| $50,000 to $74,999 | 3 (9.1%) | 3 (5.9%) |
| $75,000 to $99,999 | 6 (18.2%) | 17 (33.3%) |
| $100,000 to $149,999 | 6 (18.2%) | 7 (13.7%) |
| $150,000 or more | 3 (9.1%) | 14 (27.5%) |
| Total | 33 (100.0%) | 51 (100.0%) |
Property Value to Household Income Ratio in Ste Marie
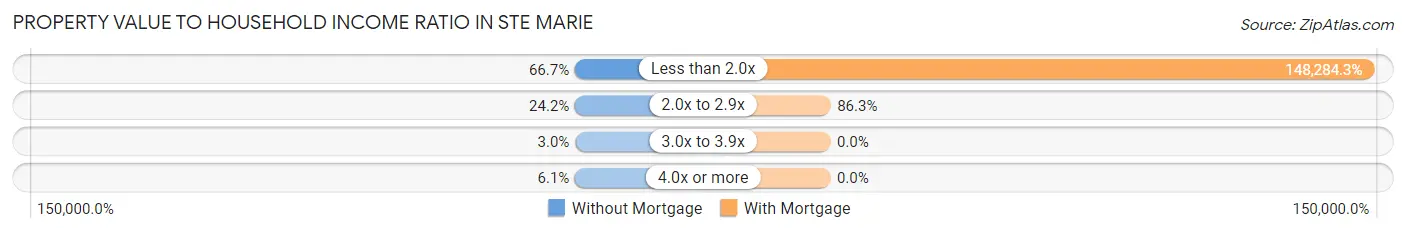
| Value-to-Income Ratio | Without Mortgage | With Mortgage |
| Less than 2.0x | 22 (66.7%) | 75,625 (148,284.3%) |
| 2.0x to 2.9x | 8 (24.2%) | 44 (86.3%) |
| 3.0x to 3.9x | 1 (3.0%) | 0 (0.0%) |
| 4.0x or more | 2 (6.1%) | 0 (0.0%) |
| Total | 33 (100.0%) | 51 (100.0%) |
Real Estate Taxes by Mortgage Status in Ste Marie
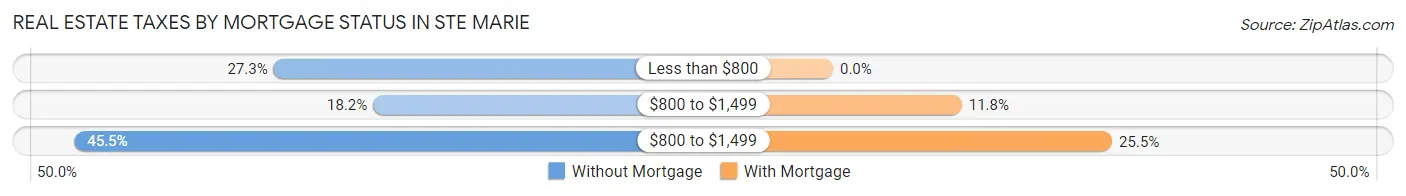
| Property Taxes | Without Mortgage | With Mortgage |
| Less than $800 | 9 (27.3%) | 0 (0.0%) |
| $800 to $1,499 | 6 (18.2%) | 6 (11.8%) |
| $800 to $1,499 | 15 (45.5%) | 13 (25.5%) |
| Total | 33 (100.0%) | 51 (100.0%) |
Health & Disability in Ste Marie
Health Insurance Coverage by Age in Ste Marie
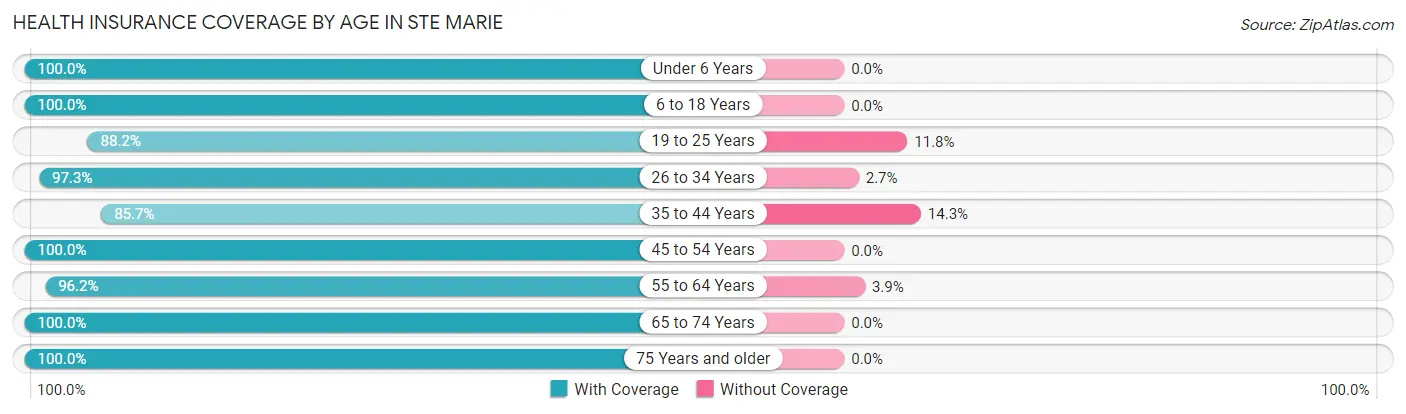
| Age Bracket | With Coverage | Without Coverage |
| Under 6 Years | 27 (100.0%) | 0 (0.0%) |
| 6 to 18 Years | 79 (100.0%) | 0 (0.0%) |
| 19 to 25 Years | 15 (88.2%) | 2 (11.8%) |
| 26 to 34 Years | 36 (97.3%) | 1 (2.7%) |
| 35 to 44 Years | 36 (85.7%) | 6 (14.3%) |
| 45 to 54 Years | 44 (100.0%) | 0 (0.0%) |
| 55 to 64 Years | 25 (96.2%) | 1 (3.8%) |
| 65 to 74 Years | 8 (100.0%) | 0 (0.0%) |
| 75 Years and older | 9 (100.0%) | 0 (0.0%) |
| Total | 279 (96.5%) | 10 (3.5%) |
Health Insurance Coverage by Citizenship Status in Ste Marie
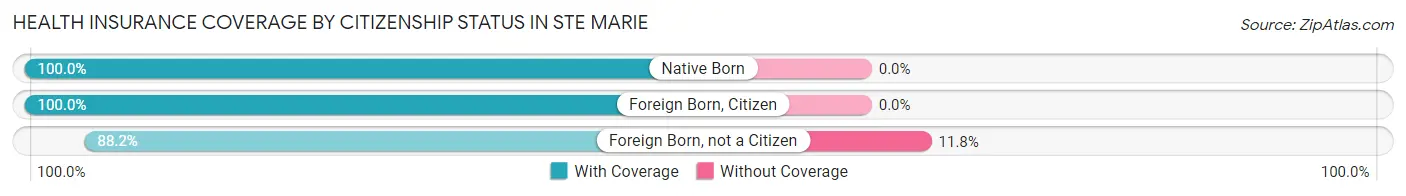
| Citizenship Status | With Coverage | Without Coverage |
| Native Born | 27 (100.0%) | 0 (0.0%) |
| Foreign Born, Citizen | 79 (100.0%) | 0 (0.0%) |
| Foreign Born, not a Citizen | 15 (88.2%) | 2 (11.8%) |
Health Insurance Coverage by Household Income in Ste Marie
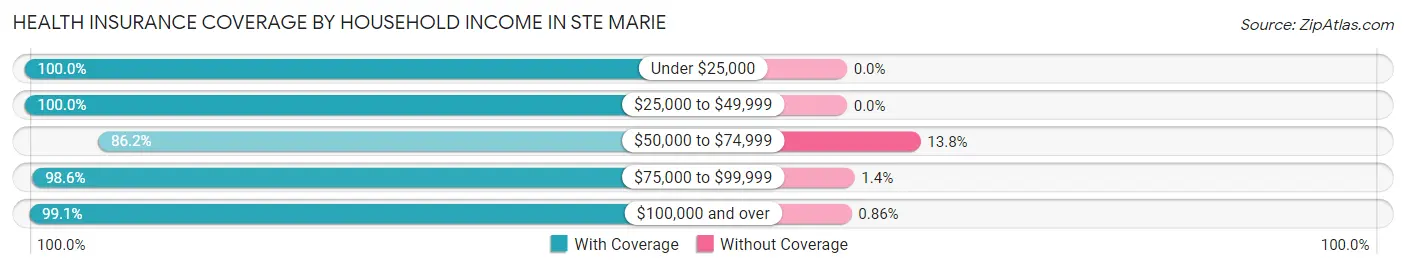
| Household Income | With Coverage | Without Coverage |
| Under $25,000 | 14 (100.0%) | 0 (0.0%) |
| $25,000 to $49,999 | 31 (100.0%) | 0 (0.0%) |
| $50,000 to $74,999 | 50 (86.2%) | 8 (13.8%) |
| $75,000 to $99,999 | 69 (98.6%) | 1 (1.4%) |
| $100,000 and over | 115 (99.1%) | 1 (0.9%) |
Public vs Private Health Insurance Coverage by Age in Ste Marie
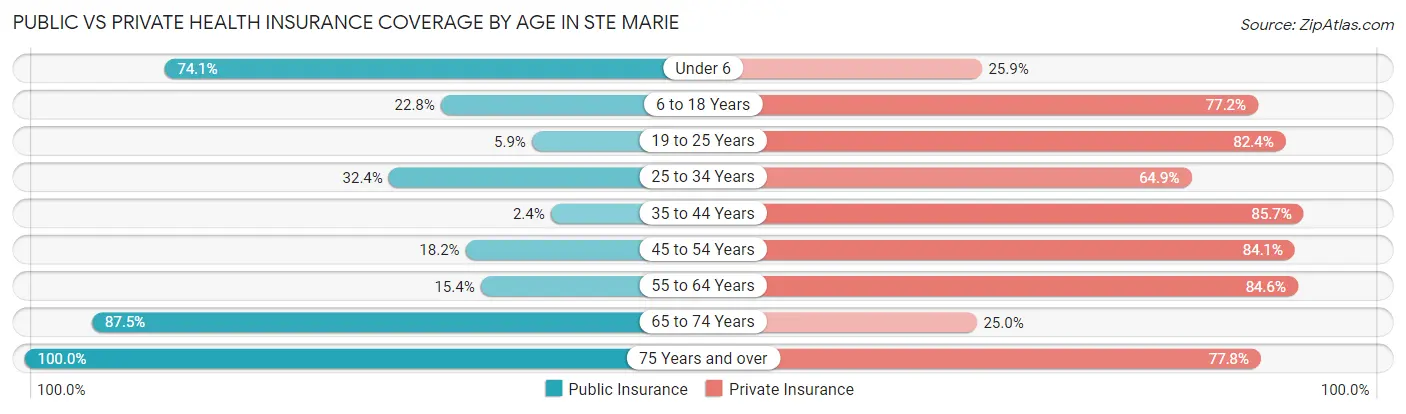
| Age Bracket | Public Insurance | Private Insurance |
| Under 6 | 20 (74.1%) | 7 (25.9%) |
| 6 to 18 Years | 18 (22.8%) | 61 (77.2%) |
| 19 to 25 Years | 1 (5.9%) | 14 (82.4%) |
| 25 to 34 Years | 12 (32.4%) | 24 (64.9%) |
| 35 to 44 Years | 1 (2.4%) | 36 (85.7%) |
| 45 to 54 Years | 8 (18.2%) | 37 (84.1%) |
| 55 to 64 Years | 4 (15.4%) | 22 (84.6%) |
| 65 to 74 Years | 7 (87.5%) | 2 (25.0%) |
| 75 Years and over | 9 (100.0%) | 7 (77.8%) |
| Total | 80 (27.7%) | 210 (72.7%) |
Disability Status by Sex by Age in Ste Marie
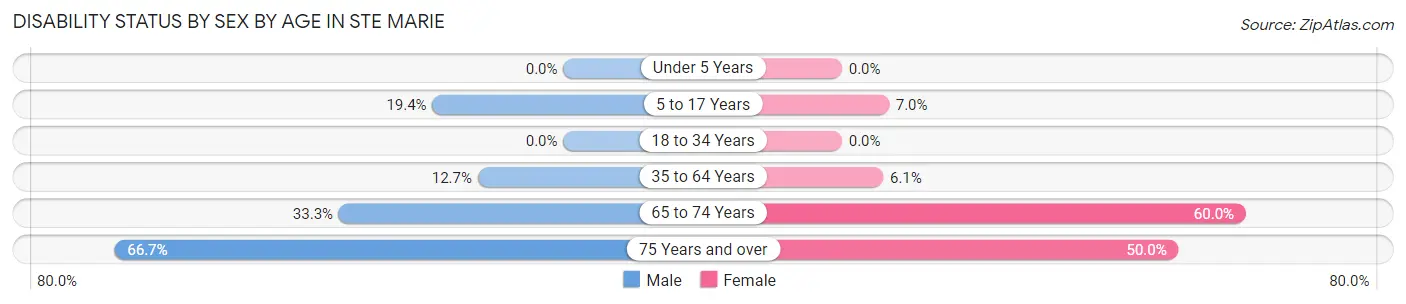
| Age Bracket | Male | Female |
| Under 5 Years | 0 (0.0%) | 0 (0.0%) |
| 5 to 17 Years | 7 (19.4%) | 3 (7.0%) |
| 18 to 34 Years | 0 (0.0%) | 0 (0.0%) |
| 35 to 64 Years | 8 (12.7%) | 3 (6.1%) |
| 65 to 74 Years | 1 (33.3%) | 3 (60.0%) |
| 75 Years and over | 2 (66.7%) | 3 (50.0%) |
Disability Class by Sex by Age in Ste Marie
Disability Class: Hearing Difficulty
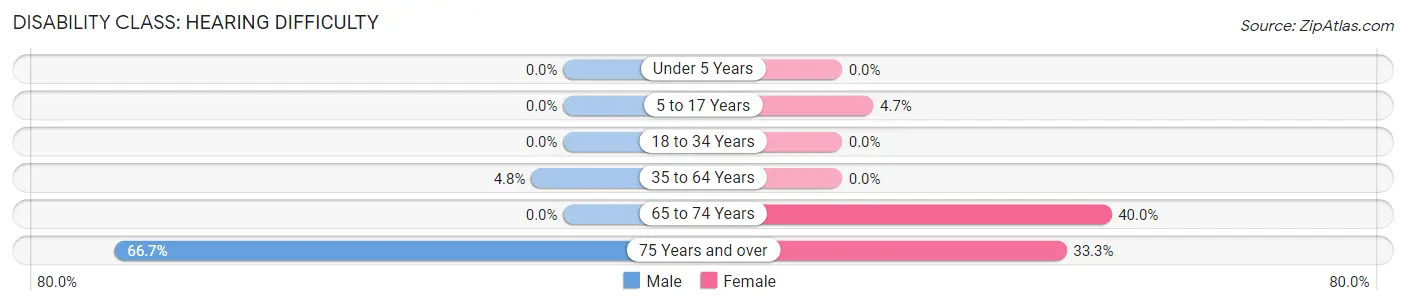
| Age Bracket | Male | Female |
| Under 5 Years | 0 (0.0%) | 0 (0.0%) |
| 5 to 17 Years | 0 (0.0%) | 2 (4.6%) |
| 18 to 34 Years | 0 (0.0%) | 0 (0.0%) |
| 35 to 64 Years | 3 (4.8%) | 0 (0.0%) |
| 65 to 74 Years | 0 (0.0%) | 2 (40.0%) |
| 75 Years and over | 2 (66.7%) | 2 (33.3%) |
Disability Class: Vision Difficulty
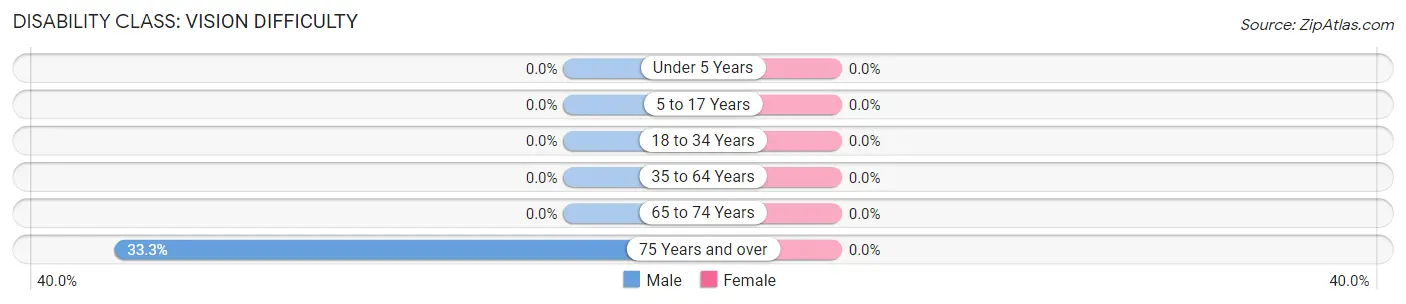
| Age Bracket | Male | Female |
| Under 5 Years | 0 (0.0%) | 0 (0.0%) |
| 5 to 17 Years | 0 (0.0%) | 0 (0.0%) |
| 18 to 34 Years | 0 (0.0%) | 0 (0.0%) |
| 35 to 64 Years | 0 (0.0%) | 0 (0.0%) |
| 65 to 74 Years | 0 (0.0%) | 0 (0.0%) |
| 75 Years and over | 1 (33.3%) | 0 (0.0%) |
Disability Class: Cognitive Difficulty
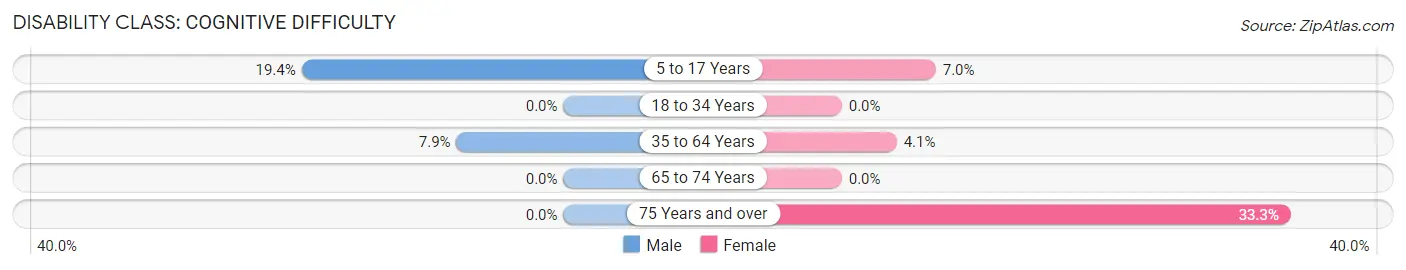
| Age Bracket | Male | Female |
| 5 to 17 Years | 7 (19.4%) | 3 (7.0%) |
| 18 to 34 Years | 0 (0.0%) | 0 (0.0%) |
| 35 to 64 Years | 5 (7.9%) | 2 (4.1%) |
| 65 to 74 Years | 0 (0.0%) | 0 (0.0%) |
| 75 Years and over | 0 (0.0%) | 2 (33.3%) |
Disability Class: Ambulatory Difficulty
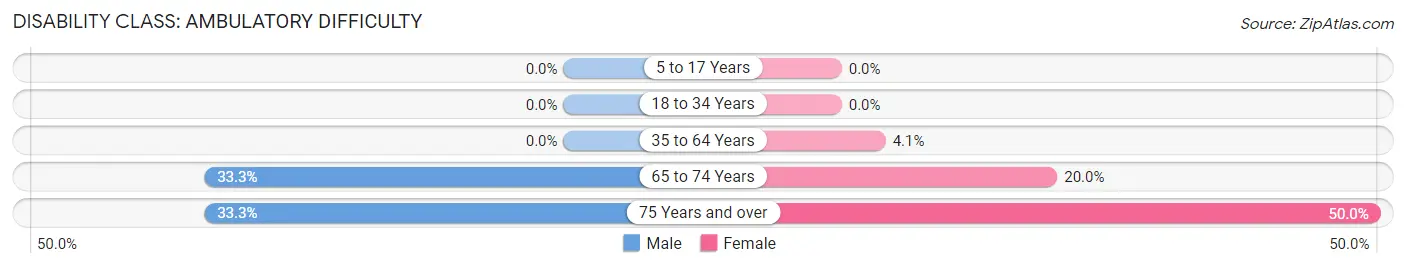
| Age Bracket | Male | Female |
| 5 to 17 Years | 0 (0.0%) | 0 (0.0%) |
| 18 to 34 Years | 0 (0.0%) | 0 (0.0%) |
| 35 to 64 Years | 0 (0.0%) | 2 (4.1%) |
| 65 to 74 Years | 1 (33.3%) | 1 (20.0%) |
| 75 Years and over | 1 (33.3%) | 3 (50.0%) |
Disability Class: Self-Care Difficulty
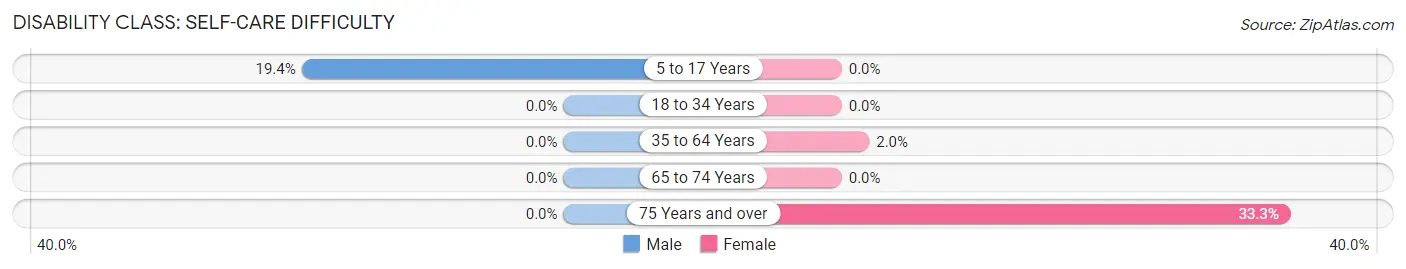
| Age Bracket | Male | Female |
| 5 to 17 Years | 7 (19.4%) | 0 (0.0%) |
| 18 to 34 Years | 0 (0.0%) | 0 (0.0%) |
| 35 to 64 Years | 0 (0.0%) | 1 (2.0%) |
| 65 to 74 Years | 0 (0.0%) | 0 (0.0%) |
| 75 Years and over | 0 (0.0%) | 2 (33.3%) |
Technology Access in Ste Marie
Computing Device Access in Ste Marie
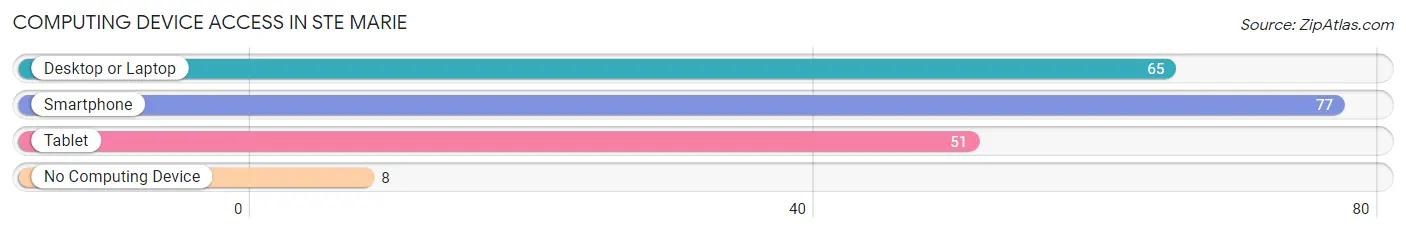
| Device Type | # Households | % Households |
| Desktop or Laptop | 65 | 73.0% |
| Smartphone | 77 | 86.5% |
| Tablet | 51 | 57.3% |
| No Computing Device | 8 | 9.0% |
| Total | 89 | 100.0% |
Internet Access in Ste Marie
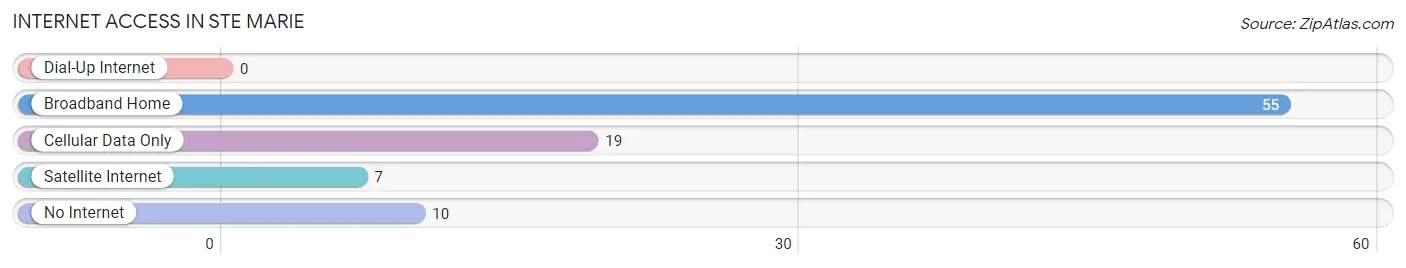
| Internet Type | # Households | % Households |
| Dial-Up Internet | 0 | 0.0% |
| Broadband Home | 55 | 61.8% |
| Cellular Data Only | 19 | 21.3% |
| Satellite Internet | 7 | 7.9% |
| No Internet | 10 | 11.2% |
| Total | 89 | 100.0% |
Ste Marie Summary
Marie, Illinois is a small village located in St. Clair County, Illinois. It is situated on the banks of the Mississippi River, just south of St. Louis, Missouri. The village has a population of approximately 1,000 people and is part of the Greater St. Louis metropolitan area.
History
The area that is now St. Marie was first settled in the early 1800s by French-Canadian immigrants. The village was originally known as “La Petite Prairie” and was a small farming community. In 1837, the village was renamed St. Marie after the patron saint of the local Catholic church.
In the late 1800s, the village began to grow and develop. The first post office was established in 1876 and the first school was built in 1877. The village was incorporated in 1883 and the first mayor was elected in 1884.
In the early 1900s, the village experienced a period of growth and development. The first bank was established in 1906 and the first telephone service was established in 1907. The village also saw the construction of a new school, a new library, and a new fire station.
Geography
St. Marie is located in St. Clair County, Illinois. It is situated on the banks of the Mississippi River, just south of St. Louis, Missouri. The village has a total area of 0.6 square miles, all of which is land.
The village is located in a flat, low-lying area. The terrain is mostly flat with some rolling hills. The climate is humid continental, with hot summers and cold winters.
Economy
The economy of St. Marie is largely based on agriculture and tourism. The village is home to several small farms, which produce a variety of crops, including corn, soybeans, and wheat. The village also has several small businesses, including a grocery store, a hardware store, and a restaurant.
Tourism is an important part of the local economy. The village is home to several historic sites, including the St. Marie Historic District, which is listed on the National Register of Historic Places. The village also hosts several annual festivals, including the St. Marie Fall Festival and the St. Marie Christmas Festival.
Demographics
As of the 2010 census, the population of St. Marie was 1,000. The racial makeup of the village was 97.2% White, 0.7% African American, 0.2% Native American, 0.2% Asian, 0.2% from other races, and 1.7% from two or more races. Hispanic or Latino of any race were 1.2% of the population.
The median income for a household in the village was $45,000, and the median income for a family was $50,000. The per capita income for the village was $20,000. About 8.3% of families and 10.2% of the population were below the poverty line, including 14.3% of those under age 18 and none of those age 65 or over.
St. Marie is a small village with a rich history and a vibrant economy. The village is home to several historic sites and hosts several annual festivals. The village has a diverse population and a strong sense of community.
Common Questions
What is the Total Population of Ste Marie?
Total Population of Ste Marie is 289.
What is the Total Male Population of Ste Marie?
Total Male Population of Ste Marie is 135.
What is the Total Female Population of Ste Marie?
Total Female Population of Ste Marie is 154.
What is the Ratio of Males per 100 Females in Ste Marie?
There are 87.66 Males per 100 Females in Ste Marie.
What is the Ratio of Females per 100 Males in Ste Marie?
There are 114.07 Females per 100 Males in Ste Marie.
What is the Median Population Age in Ste Marie?
Median Population Age in Ste Marie is 29.8 Years.
What is the Average Family Size in Ste Marie
Average Family Size in Ste Marie is 4.0 People.
What is the Average Household Size in Ste Marie
Average Household Size in Ste Marie is 3.2 People.
What is Per Capita Income in Ste Marie?
Per Capita income in Ste Marie is $26,526.
What is the Median Family Income in Ste Marie?
Median Family Income in Ste Marie is $78,750.
What is the Median Household income in Ste Marie?
Median Household Income in Ste Marie is $73,125.
What is Income or Wage Gap in Ste Marie?
Income or Wage Gap in Ste Marie is 68.6%.
Women in Ste Marie earn 31.4 cents for every dollar earned by a man.
What is Inequality or Gini Index in Ste Marie?
Inequality or Gini Index in Ste Marie is 0.35.
How Large is the Labor Force in Ste Marie?
There are 142 People in the Labor Forcein in Ste Marie.
What is the Percentage of People in the Labor Force in Ste Marie?
73.2% of People are in the Labor Force in Ste Marie.
What is the Unemployment Rate in Ste Marie?
Unemployment Rate in Ste Marie is 3.5%.