Cities with the Highest Percentage of Population with a Degree in Computers and Mathematics in Washington
RELATED REPORTS & OPTIONS
Computers and Mathematics
Washington
Compare Cities
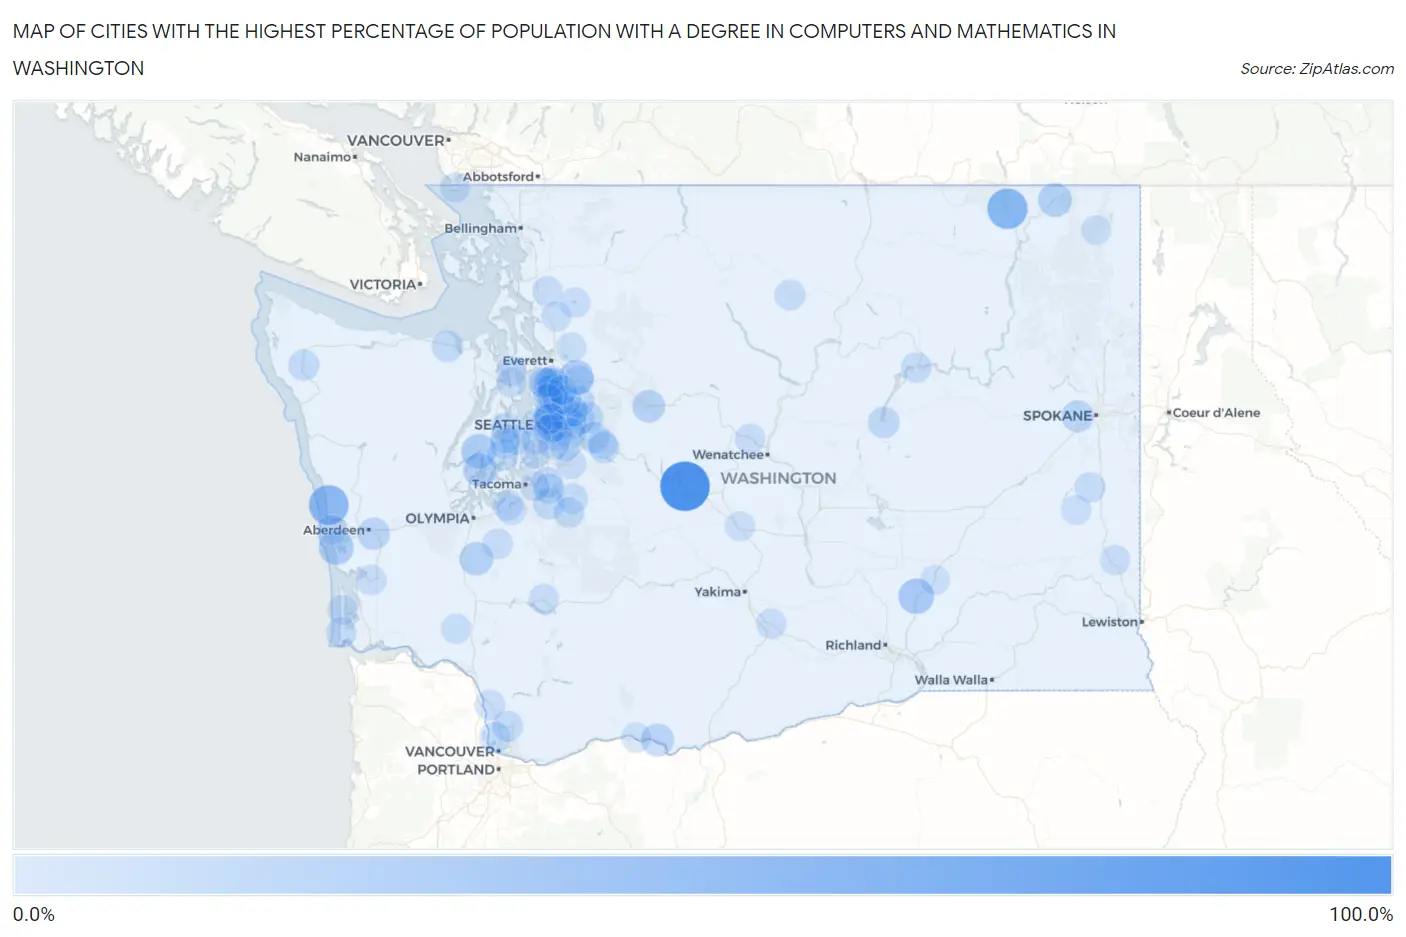
Map of Cities with the Highest Percentage of Population with a Degree in Computers and Mathematics in Washington
0.0%
100.0%
Cities with the Highest Percentage of Population with a Degree in Computers and Mathematics in Washington
| City | % Graduates | vs State | vs National | |
| 1. | Ronald | 100.0% | 7.0%(+93.0)#1 | 4.9%(+95.1)#16 |
| 2. | Orient | 55.6% | 7.0%(+48.6)#2 | 4.9%(+50.7)#84 |
| 3. | Copalis Beach | 52.4% | 7.0%(+45.5)#3 | 4.9%(+47.5)#93 |
| 4. | Mesa | 31.6% | 7.0%(+24.6)#4 | 4.9%(+26.7)#270 |
| 5. | Monroe North | 29.6% | 7.0%(+22.7)#5 | 4.9%(+24.7)#294 |
| 6. | Cohassett Beach | 29.0% | 7.0%(+22.1)#6 | 4.9%(+24.1)#306 |
| 7. | Belfair | 27.9% | 7.0%(+21.0)#7 | 4.9%(+23.0)#331 |
| 8. | Northport | 24.5% | 7.0%(+17.6)#8 | 4.9%(+19.6)#438 |
| 9. | Bucoda | 23.3% | 7.0%(+16.3)#9 | 4.9%(+18.4)#469 |
| 10. | Grapeview | 23.2% | 7.0%(+16.2)#10 | 4.9%(+18.3)#471 |
| 11. | Redmond | 22.2% | 7.0%(+15.2)#11 | 4.9%(+17.3)#518 |
| 12. | Lyle | 20.0% | 7.0%(+13.0)#12 | 4.9%(+15.1)#602 |
| 13. | Skykomish | 20.0% | 7.0%(+13.0)#13 | 4.9%(+15.1)#615 |
| 14. | Mill Creek East | 17.4% | 7.0%(+10.5)#14 | 4.9%(+12.5)#797 |
| 15. | Cosmopolis | 17.3% | 7.0%(+10.4)#15 | 4.9%(+12.5)#803 |
| 16. | Airway Heights | 16.6% | 7.0%(+9.64)#16 | 4.9%(+11.7)#877 |
| 17. | Bellevue | 16.6% | 7.0%(+9.62)#17 | 4.9%(+11.7)#878 |
| 18. | Clear Lake Cdp Skagit County | 16.1% | 7.0%(+9.12)#18 | 4.9%(+11.2)#924 |
| 19. | Bothell East | 15.7% | 7.0%(+8.76)#19 | 4.9%(+10.8)#959 |
| 20. | Coulee City | 15.4% | 7.0%(+8.42)#20 | 4.9%(+10.5)#991 |
| 21. | Ames Lake | 15.3% | 7.0%(+8.36)#21 | 4.9%(+10.4)#1,004 |
| 22. | Carnation | 14.7% | 7.0%(+7.75)#22 | 4.9%(+9.82)#1,064 |
| 23. | Duvall | 14.5% | 7.0%(+7.54)#23 | 4.9%(+9.60)#1,085 |
| 24. | Burley | 14.4% | 7.0%(+7.42)#24 | 4.9%(+9.49)#1,103 |
| 25. | River Road | 14.3% | 7.0%(+7.32)#25 | 4.9%(+9.39)#1,111 |
| 26. | Sammamish | 13.9% | 7.0%(+6.97)#26 | 4.9%(+9.04)#1,169 |
| 27. | Mcmillin | 13.9% | 7.0%(+6.91)#27 | 4.9%(+8.98)#1,179 |
| 28. | Yarrow Point | 13.8% | 7.0%(+6.82)#28 | 4.9%(+8.89)#1,192 |
| 29. | Union Hill Novelty Hill | 13.3% | 7.0%(+6.30)#29 | 4.9%(+8.37)#1,286 |
| 30. | Forks | 13.2% | 7.0%(+6.23)#30 | 4.9%(+8.30)#1,297 |
| 31. | Bothell West | 13.1% | 7.0%(+6.18)#31 | 4.9%(+8.25)#1,309 |
| 32. | Issaquah | 13.0% | 7.0%(+6.01)#32 | 4.9%(+8.08)#1,343 |
| 33. | Snoqualmie | 13.0% | 7.0%(+5.99)#33 | 4.9%(+8.06)#1,348 |
| 34. | Larch Way | 12.9% | 7.0%(+5.97)#34 | 4.9%(+8.04)#1,351 |
| 35. | Riverpoint | 12.9% | 7.0%(+5.95)#35 | 4.9%(+8.02)#1,354 |
| 36. | Felida | 12.7% | 7.0%(+5.73)#36 | 4.9%(+7.80)#1,392 |
| 37. | Kirkland | 12.6% | 7.0%(+5.60)#37 | 4.9%(+7.67)#1,412 |
| 38. | Dollars Corner | 12.3% | 7.0%(+5.35)#38 | 4.9%(+7.41)#1,472 |
| 39. | Woodinville | 12.1% | 7.0%(+5.11)#39 | 4.9%(+7.18)#1,513 |
| 40. | Riverbend | 11.6% | 7.0%(+4.68)#40 | 4.9%(+6.75)#1,615 |
| 41. | Mill Creek | 11.6% | 7.0%(+4.64)#41 | 4.9%(+6.71)#1,627 |
| 42. | Buckley | 11.5% | 7.0%(+4.53)#42 | 4.9%(+6.60)#1,649 |
| 43. | Pacific | 11.4% | 7.0%(+4.46)#43 | 4.9%(+6.53)#1,669 |
| 44. | Bothell | 11.1% | 7.0%(+4.13)#44 | 4.9%(+6.20)#1,773 |
| 45. | Enetai | 11.0% | 7.0%(+4.05)#45 | 4.9%(+6.12)#1,785 |
| 46. | North Lynnwood | 10.8% | 7.0%(+3.87)#46 | 4.9%(+5.94)#1,841 |
| 47. | Fairwood Cdp King County | 10.6% | 7.0%(+3.66)#47 | 4.9%(+5.73)#1,902 |
| 48. | Kitsap Lake | 10.6% | 7.0%(+3.65)#48 | 4.9%(+5.72)#1,907 |
| 49. | Carbonado | 10.6% | 7.0%(+3.63)#49 | 4.9%(+5.69)#1,916 |
| 50. | Rainier | 10.5% | 7.0%(+3.56)#50 | 4.9%(+5.63)#1,930 |
| 51. | Malden | 10.5% | 7.0%(+3.56)#51 | 4.9%(+5.63)#1,947 |
| 52. | Twisp | 10.5% | 7.0%(+3.55)#52 | 4.9%(+5.62)#1,951 |
| 53. | Martha Lake | 10.4% | 7.0%(+3.42)#53 | 4.9%(+5.49)#1,990 |
| 54. | Hunts Point | 9.9% | 7.0%(+2.99)#54 | 4.9%(+5.05)#2,177 |
| 55. | Grand Coulee | 9.9% | 7.0%(+2.96)#55 | 4.9%(+5.03)#2,183 |
| 56. | Long Beach | 9.9% | 7.0%(+2.94)#56 | 4.9%(+5.00)#2,193 |
| 57. | Medina | 9.9% | 7.0%(+2.92)#57 | 4.9%(+4.99)#2,201 |
| 58. | Sumner | 9.9% | 7.0%(+2.91)#58 | 4.9%(+4.97)#2,209 |
| 59. | Bethel | 9.8% | 7.0%(+2.84)#59 | 4.9%(+4.91)#2,231 |
| 60. | Woodland | 9.8% | 7.0%(+2.80)#60 | 4.9%(+4.87)#2,242 |
| 61. | South Bend | 9.6% | 7.0%(+2.64)#61 | 4.9%(+4.71)#2,315 |
| 62. | Ocean Park | 9.5% | 7.0%(+2.57)#62 | 4.9%(+4.64)#2,347 |
| 63. | Lake Cavanaugh | 9.4% | 7.0%(+2.47)#63 | 4.9%(+4.54)#2,401 |
| 64. | Albion | 9.4% | 7.0%(+2.45)#64 | 4.9%(+4.52)#2,415 |
| 65. | Clyde Hill | 9.4% | 7.0%(+2.43)#65 | 4.9%(+4.50)#2,424 |
| 66. | Mercer Island | 9.3% | 7.0%(+2.36)#66 | 4.9%(+4.43)#2,460 |
| 67. | Maple Valley | 9.2% | 7.0%(+2.21)#67 | 4.9%(+4.28)#2,525 |
| 68. | Newcastle | 9.2% | 7.0%(+2.21)#68 | 4.9%(+4.27)#2,528 |
| 69. | Cottage Lake | 9.1% | 7.0%(+2.16)#69 | 4.9%(+4.23)#2,554 |
| 70. | Zillah | 9.1% | 7.0%(+2.15)#70 | 4.9%(+4.22)#2,556 |
| 71. | Hansville | 9.1% | 7.0%(+2.12)#71 | 4.9%(+4.19)#2,595 |
| 72. | Point Roberts | 9.0% | 7.0%(+2.01)#72 | 4.9%(+4.08)#2,637 |
| 73. | Big Lake | 8.9% | 7.0%(+1.97)#73 | 4.9%(+4.04)#2,662 |
| 74. | Cashmere | 8.9% | 7.0%(+1.96)#74 | 4.9%(+4.03)#2,675 |
| 75. | Renton | 8.8% | 7.0%(+1.87)#75 | 4.9%(+3.94)#2,705 |
| 76. | Seattle | 8.8% | 7.0%(+1.80)#76 | 4.9%(+3.87)#2,754 |
| 77. | North Fort Lewis | 8.8% | 7.0%(+1.80)#77 | 4.9%(+3.86)#2,757 |
| 78. | Ryderwood | 8.7% | 7.0%(+1.77)#78 | 4.9%(+3.84)#2,772 |
| 79. | Lochsloy | 8.6% | 7.0%(+1.60)#79 | 4.9%(+3.67)#2,861 |
| 80. | Bryant | 8.5% | 7.0%(+1.50)#80 | 4.9%(+3.57)#2,916 |
| 81. | Fort Lewis | 8.4% | 7.0%(+1.48)#81 | 4.9%(+3.55)#2,924 |
| 82. | Beaux Arts Village | 8.4% | 7.0%(+1.46)#82 | 4.9%(+3.53)#2,929 |
| 83. | White Center | 8.4% | 7.0%(+1.45)#83 | 4.9%(+3.51)#2,934 |
| 84. | Morton | 8.4% | 7.0%(+1.43)#84 | 4.9%(+3.50)#2,940 |
| 85. | Ocean Shores | 8.3% | 7.0%(+1.38)#85 | 4.9%(+3.45)#2,969 |
| 86. | Normandy Park | 8.3% | 7.0%(+1.36)#86 | 4.9%(+3.43)#3,022 |
| 87. | Bingen | 8.3% | 7.0%(+1.33)#87 | 4.9%(+3.40)#3,031 |
| 88. | East Renton Highlands | 8.2% | 7.0%(+1.26)#88 | 4.9%(+3.33)#3,071 |
| 89. | Kenmore | 8.2% | 7.0%(+1.22)#89 | 4.9%(+3.29)#3,093 |
| 90. | Southworth | 8.0% | 7.0%(+1.03)#90 | 4.9%(+3.10)#3,221 |
| 91. | Maltby | 8.0% | 7.0%(+1.03)#91 | 4.9%(+3.10)#3,222 |
| 92. | Connell | 8.0% | 7.0%(+1.00)#92 | 4.9%(+3.07)#3,238 |
| 93. | Port Gamble Tribal Community | 7.9% | 7.0%(+0.952)#93 | 4.9%(+3.02)#3,281 |
| 94. | Fife | 7.8% | 7.0%(+0.791)#94 | 4.9%(+2.86)#3,407 |
| 95. | East Port Orchard | 7.6% | 7.0%(+0.669)#95 | 4.9%(+2.74)#3,511 |
| 96. | North Bend | 7.6% | 7.0%(+0.642)#96 | 4.9%(+2.71)#3,536 |
| 97. | Monroe | 7.6% | 7.0%(+0.634)#97 | 4.9%(+2.70)#3,539 |
| 98. | Ione | 7.6% | 7.0%(+0.633)#98 | 4.9%(+2.70)#3,544 |
| 99. | St John | 7.6% | 7.0%(+0.624)#99 | 4.9%(+2.69)#3,549 |
| 100. | Ellensburg | 7.5% | 7.0%(+0.572)#100 | 4.9%(+2.64)#3,573 |
Common Questions
What are the Top 10 Cities with the Highest Percentage of Population with a Degree in Computers and Mathematics in Washington?
Top 10 Cities with the Highest Percentage of Population with a Degree in Computers and Mathematics in Washington are:
#1
100.0%
#2
55.6%
#3
52.4%
#4
31.6%
#5
29.6%
#6
29.0%
#7
27.9%
#8
24.5%
#9
23.3%
#10
23.2%
What city has the Highest Percentage of Population with a Degree in Computers and Mathematics in Washington?
Ronald has the Highest Percentage of Population with a Degree in Computers and Mathematics in Washington with 100.0%.
What is the Percentage of Population with a Degree in Computers and Mathematics in the State of Washington?
Percentage of Population with a Degree in Computers and Mathematics in Washington is 7.0%.
What is the Percentage of Population with a Degree in Computers and Mathematics in the United States?
Percentage of Population with a Degree in Computers and Mathematics in the United States is 4.9%.